Diffraction-limited speckle interferometry and modeling of the circumstellar envelope of R CrB at maximum and minimum light
We present the first speckle interferometric observations of R CrB, the prototype of a class of peculiar stars which undergo irregular declines in their visible light curves. The observations were carried out with the 6 m telescope at the Special Astrophysical Observatory near maximum light (, 1996 Oct. 1) and at minimum light (, 1999 Sep. 28). A spatial resolution of 75 mas was achieved in the -band. The dust shell around R CrB is partially resolved, and the visibility is approximately 0.8 at a spatial frequency of 10 cycles/arcsec. The two-dimensional power spectra obtained at both epochs do not show any significant deviation from circular symmetry. The visibility function and spectral energy distribution obtained near maximum light can be simultaneously fitted with a model consisting of the central star and an optically thin dust shell with density proportional to . The inner boundary of the shell is found to be (19 mas) with a temperature of K. However, this simple model fails to simultaneously reproduce the visibility and spectral energy distribution obtained at minimum light. We show that this discrepancy can be attributed to thermal emission from a newly formed dust cloud.
Key Words.:
stars: carbon – stars: circumstellar matter – stars: mass-loss – stars: individual: R CrB – stars: variable: general – infrared: stars1 Introduction
The R Coronae Borealis (RCB) stars are a class of unusual objects characterized by sudden declines in their visible light curves as deep as . They are extremely hydrogen-deficient and also carbon-rich (e.g. Asplund et al. asplund00 (2000) and references therein). The RCB stars are thought to undergo the formation of dust clouds in random directions, and it is believed that a sudden decline takes place, only when a dust cloud forms in the line of sight (Loreta loreta34 (1934), O’Keefe okeefe39 (1939)). A newly formed dust cloud is expected to be accelerated by radiation pressure and to move away, expanding and dispersing over months, as the object gradually returns to its maximum visual brightness. The mechanism of the dust cloud formation and its temporal evolution are, however, still poorly understood. Especially, the location of dust formation is in dispute: far from the star, (e.g. Fadeyev fadeyev86 (1986), fadeyev88 (1988), Feast feast96 (1996)), or very close to the photosphere, (Payne-Gaposchkin PG63 (1963)). Recent photometric and spectroscopic observations as well as theoretical progress on dust formation suggest that the latter scenario may be the case (see, e.g. Clayton clayton96 (1996), Feast feast97ii (1997)), however, no definitive answer is yet available.
The spectral energy distributions (SEDs) of RCB stars exhibit infrared emission peaks around 6 8 m. The IR excess, which accounts for typically 30% of the total flux, is constantly present, regardless of the visual brightness of the central star. Therefore, the IR excess originates not from a single newly formed dust cloud, but mainly from a group of dispersed dust clouds with temperatures of approximately 600 – 900 K. For example, Walker et al. (walker96 (1996)) fit the infrared (spectro)photometric data of R CrB with a 650 K blackbody. The study of IRAS observations by Gillett et al. (gillett86 (1986)) led to the detection of an additional, very extended “fossil” shell around R CrB, whose diameter is as large as 18′, with a temperature of K. Walker (walker94 (1994)) found such fossil shells for at least four RCB stars.
Apart from the detection of the fossil shells, most of the observational results on the circumstellar environment around RCB stars were obtained by photometry and spectroscopy. Recently, Clayton & Ayres (clayton01 (2001)) have revealed extended C ii 1335 emission around two RCB stars, V854~Cen and RY~Sgr, by long-slit spectroscopy. However, such direct information on the spatial distribution of material in the vicinity of the central star has been very rare up to now. In this paper, we present high-resolution speckle interferometry carried out for R CrB at maximum and minimum light. The properties of the warm dust shell will be derived by simultaneous fits of the observed visibilities and SEDs using power-law models. We will also discuss the possible indication of a newly formed hot dust cloud.
2 Speckle interferometric observations
| 1996 Oct. 1 | 1999 Sep. 28 | |
| JD | 2450358.2 | 2451450.2 |
| (mag) | 7 | 10.61 |
| (m) | 2.191/0.411 | 2.115/0.214 |
| Reference star | HIP80322 | HIP77743 |
| 167 | 990 | |
| 198 | 1044 | |
| (ms) | 150 | 80 |
| (arcsec) | 1.4 | 1.1 |
| (mas) | 30.5 | 26.4 |
| Field of view | 8989 | 5151 |
The -band speckle interferometric observations were carried out with the 6 m telescope at the Special Astrophysical Observatory (SAO) in Russia, using our NICMOS-3 camera for the observation in 1996 and our HAWAII array speckle camera in 1999. The observations are described in Table 1.
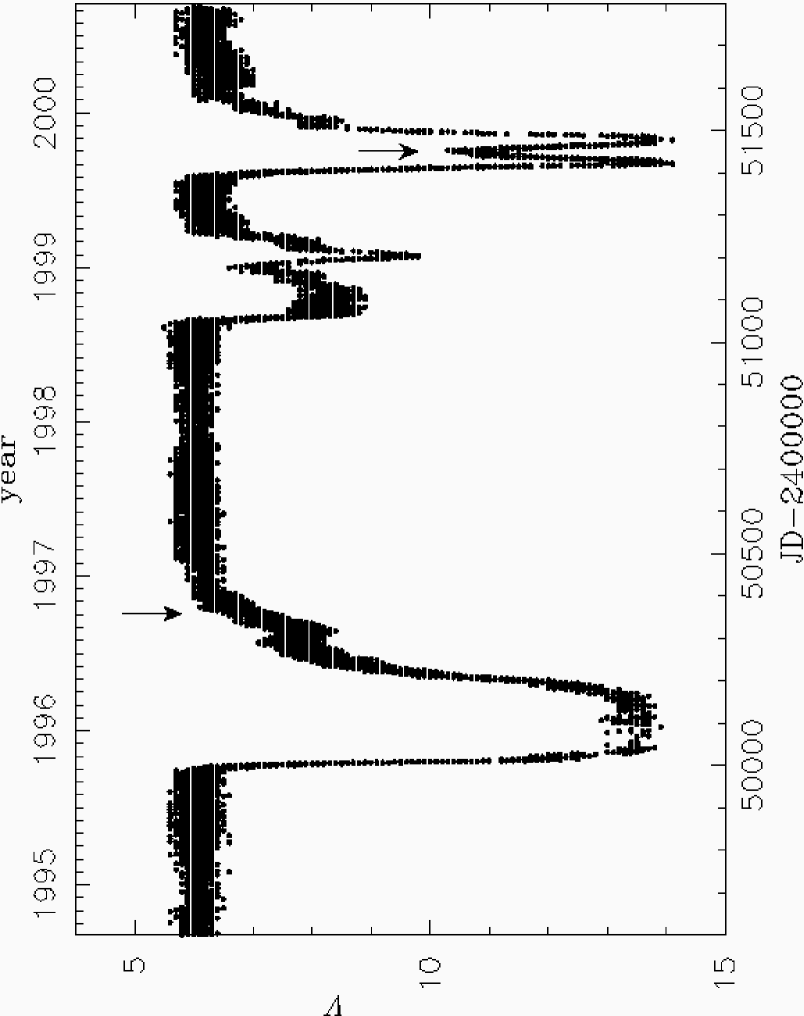
Fig. 1 shows the visual light curve of R CrB in the relevant period based on the compiled data of the American Association of Variable Star Observers (AAVSO). The data before 1996 were taken from AAVSO Monograph 4 Supplement 1, while J. A. Mattei kindly provided unpublished data for the rest of the period. On 1996 October 1, R CrB was on its final recovery from the 1995-96 deep minimum and its visual magnitude was around 7 (Mattei mattei00 (2000)). Since is approximately 6 at maximum light, the star was slightly obscured by . On 1999 September 28, the star was just between two sharp deep minima and had a visual magnitude of 10.61 (see Sect. 3). The star was heavily obscured by .
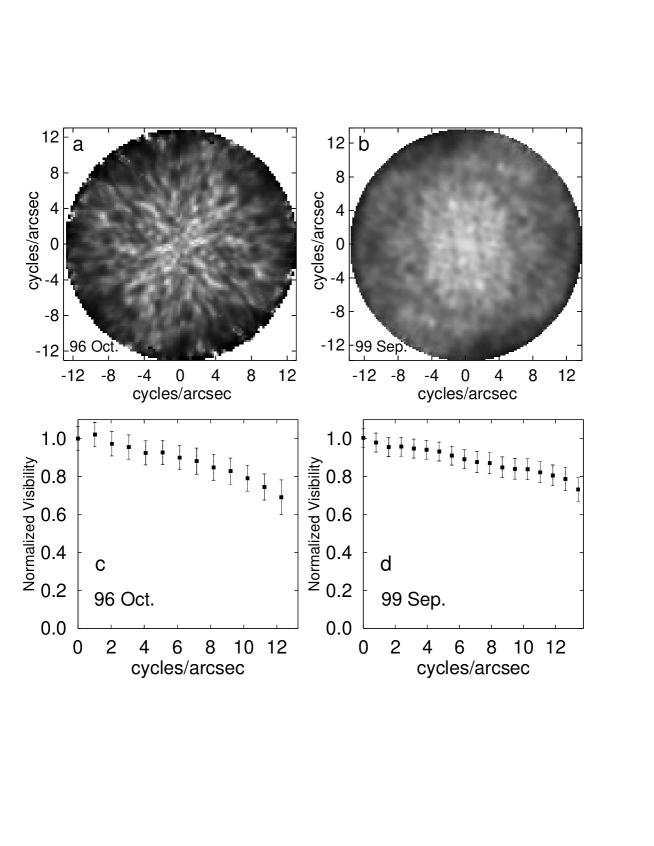
Fig. 2 shows the two-dimensional power spectra and azimuthally averaged visibility functions reconstructed with the speckle interferometry method (Labeyrie labeyrie70 (1970)). The error bars include systematic errors caused by seeing variations as well as speckle noise errors. There is no significant deviation from circular symmetry in the two-dimensional power spectra observed at both epochs. The granular features seen in Fig. 2a are the speckle noise resulting from the small number of interferograms. In Fig. 2b, a slight elongation along the vertical axis of the figure can be marginally recognized. However, this is within the error bars, and cannot be regarded as a significant feature. Clayton et al. (clayton97 (1997)) suggest a bipolar geometry for R CrB based on the wavelength dependence of the position angle of polarization. Our speckle observations seem to support a rather symmetric distribution of material. However, a disc or torus may lie very close to the star, and therefore, it is premature to rule out a bipolar geometry completely.
The reconstructed visibility functions shown in Figs. 2c and 2d exhibit no difference larger than the error bars. The source probably consists of the central star (a point source) and an extended dust shell. Visibilities observed for such objects have a plateau at high spatial frequencies resulting from the point source. In the observations presented here, the angular size of the shell is small, and therefore, the plateau is not visible within a cut-off frequency of 13 cycles/arcsec. The determination of the physical parameters of the shell by simultaneous fits to the observed visibilities and SEDs will be presented in Sect. 5.
3 Photometric data
photometry was carried out on 1999 September 29, just one night after the speckle observation. The optical () data were obtained with the 1.25 m telescope at the Crimean Astrophysical Observatory, and the infrared () data with the 1.22 m telescope at the Crimean Laboratory of the Sternberg Astronomical Institute.
No photometric data, except for the visual magnitudes compiled in the AAVSO database, have been published around the date of our speckle observation in 1996 October. Therefore, we use the data published by Shenavrin et al. (shenavrin79 (1979)), who report a series of photometric observations during the 1977 deep minimum. We use the data on 1978 January 22 (JD2443530.6), when the visual magnitude was 7.03, almost the same as that on the date of our speckle observation in 1996 October. For the - and -bands, we use photometric data obtained on 1996 June 11 (JD2450246.4) by Shenavrin (unpublished observation), about 4 months before our speckle observation. It is known that the variation of the - and -band fluxes has no correlation with the visual light curve, and that they exhibit a semi-periodic variation of mag with a period of about 1260 days (e.g. Feast et al. feast97 (1997)). In fact, the and magnitudes on 1996 June 11 are by 1.09 mag and 1.25 mag brighter than those on 1999 September 29, respectively. The - and -band fluxes measured 4 months before are expected to represent the values on the date of the speckle observation rather well.
We also use IRAS observations at 12, 25, 60, and 100 m. The very extended “fossil” shell gives rise to flux excess at 60 and 100 m, when evaluated with a large aperture (Gillett et al. gillett86 (1986)). In this paper, however, we are primarily interested in the warm dust shell which was not resolved with IRAS, therefore, we adopt the point source processed fluxes for 60 and 100 m. Long-term variations at wavelengths longer than 10 m are considered to be smaller than those in the - and -bands. Forrest et al. (forrest72 (1972)) show that the amplitude at 11 m is about half as small as those in the - and - bands. The variation at wavelengths longer than 11 m is estimated to be mag at most.
4 Description of the model
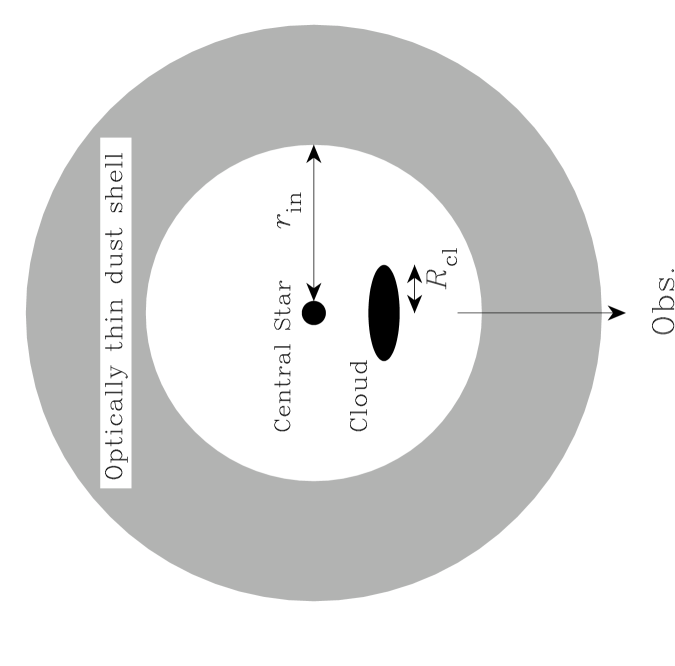
The basics of the model used here are the same as adopted by Gillett et al. (gillett86 (1986)). Fig. 3 illustrates the picture considered in our modeling. It consists of the central star and an optically thin dust shell responsible for the constant IR excess. As mentioned in Sect. 2, the star was obscured by (1999 September 28) and (1996 October 1). Therefore, an additional obscuring dust cloud, which is assumed to be circular (projected onto the sky as seen from the star), is also considered, as shown in Fig. 3.
Adopting and to be (Gillett et al. gillett86 (1986)) and 6600 – 6900 K (Asplund et al. asplund00 (2000)), respectively, the radius of the central star is approximately 70 . We adopt 6750 K for the effective temperature, and radiation from the central star is approximately represented by a blackbody. The distance to R CrB adopted here is 1.6 kpc (Gillett et al. gillett86 (1986)), yielding an angular radius of the central star of 0.23 mas.
We consider a spherical shell with an inner radius and outer radius . The shell is assumed to be optically thin not only in the infrared but also in the optical, since there is no evidence for strong circumstellar reddening for R CrB. Asplund et al. (asplund97 (1997)) found that the observed optical flux at maximum light can be well reproduced by their line-blanketed model atmospheres without any circumstellar extinction. In fact, the optical depth of the dust shell in the -band is in our models presented below. The assumption of spherical symmetry for the shell is justified, given the negative detection of deviation from circular symmetry in the observed two-dimensional power spectra.
The grain number density is assumed to decrease in a power-law of radius,
| (1) |
where is a constant which does not affect the shape of emergent SEDs, and therefore, should be adjusted to fit the flux observed on the earth.
The temperature in an optically thin dust shell is determined by the thermal balance equation
| (2) |
where is the luminosity of the central star at a given frequency, is the radius of a grain, is the absorption efficiency of a grain, and is the Planck function. Amorphous carbon is the most probable candidate for the circumstellar dust around RCB stars (e.g. Holm et al. holm82 (1982), Hecht et al. hecht84 (1984)). In Fig. 4, we show temperature distributions predicted by the thermal balance equation, using the extinction of amorphous carbon obtained by Bussoletti et al. (bussoletti87 (1987)) (AC2 sample), Rouleau & Martin (rouleau91 (1991)) (AC1 sample), and Colangeli et al. (colangeli95 (1995)) (ACAR sample). We calculate from the complex refractive index derived by Rouleau & Martin (rouleau91 (1991)) in the Mie theory, assuming a single grain size, m, and using the code published by Bohren & Huffman (bohren83 (1983)). This grain size is based on the result obtained by Hecht et al. (hecht84 (1984)), who analyzed the UV spectra of R CrB and RY Sgr and concluded that the grain size is between 0.005 and 0.06 m. As Fig. 4 shows, the temperature distributions agree with one another within K.

The flux density observed on the earth from the optically thin shell described above can be calculated by
| (3) |
where and is the mass and mass absorption coefficient of a grain, respectively, and is the distance to the star. The constant is adjusted so that the flux predicted from the models can reproduce the observed flux at 25 m, since its long-term variation mentioned in Sect. 3 is expected to be minimal, and at the same time, it does not exhibit the contribution of the fossil shell. The variation of the 25 m flux is not available in the literature, but it is estimated to be smaller than the 0.75 mag at 11 m. is set to be , which gives a good match to the far-infrared part of the observed SEDs, as we will show below.
It should be stressed here that the real circumstellar environment around R CrB is most likely much more complex than depicted by the above spherical shell model. Since dust ejection in RCB stars presumably occurs in clouds, not in a spherical shell, it is likely that the real distribution of material is clumpy or patchy without any clear inner boundary. At large distances, however, it is still plausible that a spherical shell model roughly represents the distribution of material, as long as dust clouds are ejected randomly and frequently. There may be some newly formed clouds inside the inner boundary defined in the above spherical model, if the star ejects dust clouds frequently, for example, every pulsational cycle (40 – 50 days). Without detailed knowledge about the dispersal processes of clouds, however, it is beyond the scope of this paper to construct a more detailed model. In the framework of our models, we consider only one newly formed dust cloud, as Fig. 3 illustrates.

The observed SEDs (see Sect. 5) demonstrate that the contribution of the central star is not negligible in the near-infrared. The flux from the central star was attenuated by a dust cloud in front of the star by on 1996 October 1 and on 1999 September 28. In order to estimate the attenuated flux from the star in the near-infrared, the extinction curve of the dust cloud is empirically derived from photometry in the optical, where emission from the dust shell is negligible. The effect of the obscuration due to a dust cloud is expressed as
| (4) |
where and denote fluxes observed at any given time and at maximum light, respectively, and is the optical depth of the dust cloud in front of the star. Note that the effect of interstellar extinction, though small for R CrB, cancels out, because it affects both and by the same amount.
Fig. 5 shows the temporal change of the optical depth of a dust cloud during the 1983 minimum in the , , , , and bands. The optical depth in each band was derived using the photometric data in the decline and at maximum light obtained by Goncharova (goncharova92 (1992)). We also plot the extinction curves derived for the photometric data discussed in Sect. 3. The figure illustrates that the extinction is almost independent of the wavelength at the very bottom of the deep minimum (). As the star starts its final recovery, the extinction curve starts to steepen. Pugach (pugach84 (1984)) proposed that the neutral extinction observed during the initial drop to minimum light can be explained by an optically very thick dust cloud whose coverage over the stellar disk varies with time. On the other hand, Hecht et al. (hecht84 (1984)) analyzed the change of the ratio of total to selective extinction () during decline events for R CrB and another RCB star, RY Sgr, and suggested that rather large glassy carbon particles with radii from 0.075 to 0.15 m might be responsible for the nearly neutral extinction seen at the very bottom of minimum light. These sizes are significantly larger than the 0.01 m we adopt for a single grain size, but it should be noted that we adopt 0.01 m as the grain size in the optically thin dust shell, while the large grains mentioned above are claimed to be present in a newly formed optically thick dust cloud. For the temporal change of the extinction at the rise phase from minimum light, Hecht et al. (hecht84 (1984)) proposed shattering of large grains as a possible mechanism. Efimov (efimov90 (1990)) also proposed that the observed temporal variation of colors and polarization can be accounted for by the change of grain sizes, but assuming graphite grains instead of amorphous carbon. In any case, the spectral index of the dust cloud approaches 1, as the cloud disperses and becomes part of the optically thin dust shell. Therefore, the dust properties in the optically thin shell may presumably remain constant.
The lack of detailed knowledge about the properties of dust grains formed in R CrB and of their temporal variation forces us to adopt an empirical extinction law. As Fig. 5 shows, the extinction due to a dust cloud can be approximated by . At the bottom of minimum light, is approximately 0, and changes to , as the star returns to maximum light. By the least square fit for the extinction curves shown in Fig. 5, we derive when the magnitude of the star is 10.61, while when the magnitude is 7.03. The extinction at longer wavelengths is then estimated by extrapolation. Obviously this procedure is not optimal, but with no alternatives at hand for disentangling the contributions of the central star and the dust shell for the data studied here, we are forced to adopt this method.
Assuming a blackbody for the flux of the central star, the flux density observed on the earth from the obscured central star is
| (5) |
where is the optical depth of the dust shell along the radial direction.
The flux density observed toward R CrB is, therefore, the sum of the flux from the central star obscured by a dust cloud and slightly dimmed by the optically thin dust shell (equation (5)), thermal emission from the optically thin dust shell (equation (3)), and the thermal emission of a newly formed (therefore presumably still optically thick) dust cloud given by
| (6) |
where and are the radius and the temperature of the newly formed dust cloud, respectively.
The intensity distribution for the central star and the dust shell can be written as
| (7) | |||||
where is the impact parameter and . The function takes a value of 1 for and 0 elsewhere. The lower limit of the integration is for , while for . The visibility is calculated by taking the modulus of the Fourier transform of the intensity distribution.
5 Simultaneous fit of observed visibilities and SEDs
5.1 Model fitting without thermal emission from a dust cloud


We first try to fit the observed SEDs and visibilities using models without thermal emission from a dust cloud, namely, neglecting the term given by equation (6). We adopt , appropriate for a constant mass loss and expansion velocity. The sensitiveness of the near- and mid-infrared parts of emergent SEDs to allows us to determine it by fitting the observed SEDs. The visibility functions, which directly reflect the spatial extent of the shell, enable us to examine the validity of the models described above.
Figs. 6 and 7 show the fit of the observed SEDs and visibility functions at the two epochs of our speckle observations. The SEDs and visibilities are calculated with the opacities of amorphous carbon obtained by Bussoletti et al. (bussoletti87 (1987)) (AC2 sample), Rouleau & Martin (rouleau91 (1991)) (AC1 sample), and Colangeli et al. (colangeli95 (1995)) (ACAR sample). The corresponding temperature distributions shown in Fig. 4 are used in the calculations. Figs. 6a and 6b demonstrate that the SED and visibility for the 1996 data are well reproduced with = 76 – 90 and = 900 – 950 K. For a given opacity data set, the uncertainty of is estimated to be K, translating to an uncertainty of of . Taking the average of the and derived with three different opacities and adding the uncertainties resulting from the fitting, we derive = K and = . Fig. 6c illustrates the normalized intensity profile of the best fit model for the 1996 data. It consists of the central star and a ring-like structure characteristic of an optically thin shell. Note that the predicted visibilities become plateau-like at spatial frequencies cycles/arcsec in Fig. 6b. This plateau results from the unresolved central star. It should also be noted that the good match in the wavelength range shorter than 1 m is simply due to the adoption of the empirical extinction for a dust cloud, as described in Sect. 4.

Figs. 7a and 7b reveal that the visibility observed at minimum light cannot be reproduced simultaneously with the observed SED. The observed SED can be well fitted using the models with = 700 – 800 K and = 116 – 172 , but the visibilities predicted from these models are too low as compared with the observation. Regarding this discrepancy, we first examine the approximations adopted in our models. The line-blanketing effect in the atmosphere of RCB stars is very prominent as Asplund et al. (asplund97 (1997)) show, but the use of line-blanketed atmospheres instead of the blackbody would lower by only K. The effect of the uncertainty of the effective temperature is also minor. A decrease of the effective temperature by 500 K leads to a decrease of the dust temperature by K at . Combining these effects, the dust temperature in the shell can be by K lower than those used in the fitting above. We tried to fit the observed SED and visibility using such a temperature distribution, but it has turned out that the match to the observations is not much improved.
One concern is the estimation of the -band flux of the central star obscured by the dust cloud. As described in Sect. 4, the extinction of the dust cloud in the -band is derived by extrapolation from the region shortward of 1 m. However, the actual extinction curve of the dust cloud could become steeper longward of 1 m and approach the usual extinction curve of amorphous carbon, which is characterized by a spectral index of (Le Bertre lebertre97 (1997)). We find that the observed SED and visibility can be simultaneously fitted by adopting an extinction curve for the obscuring dust cloud such as shown in Fig. 8c. The extinction curve bends at 1.4 m and the spectral index changes from 0.47 to 1.3. Figs. 8a and 8b reveal that the observed SED and visibility are fairly reproduced. It should be stressed that the physical understanding of such an extinction curve is still unclear, and that the exact shape of the extinction curve cannot be uniquely determined by the fitting presented here. However, the unusual properties of grains in the newly formed dust cloud may be responsible for the discrepancy found for the minimum light data.
5.2 Thermal emission from a newly formed dust cloud


We show an alternative to interpret the data obtained at minimum light. We propose that the inconsistency found for the 1999 data set may be attributed to the thermal emission of a newly formed optically thick dust cloud in front of the star. The newly formed dust cloud is supposedly still rather close to the star and its angular size is not yet large enough to be resolved with the 6 m telescope. This assumption may be reasonable, because the 1999 speckle observation was carried out in a decline when the star was obscured by . The size and the temperature of such a dust cloud are by no means obvious, but the temperature () should not exceed K, otherwise the thermal emission of the cloud would be too prominent and would lead to a poorer match to the observed SED. We assume a circular cloud (projected onto the sky as seen from the star) with a radius of between 1 and 10 . As shown in Fig. 3, denotes the radius of an individual cloud itself, not the distance between the cloud and the central star. As 1 corresponds to 0.23 mas, even a cloud with a radius of 10 can well be treated as a point source for our speckle interferometry. The thermal emission of the cloud is approximated by the blackbody radiation, as given by equation (6). Fig. 9c shows the normalized intensity profile of a model consisting of the central star, an optically thin dust shell, and a thermally emitting optically thick dust cloud, whose parameters will be derived below.
Figs. 9a and 9b show a simultaneous fit using models with thermal emission from a newly formed dust cloud. The observed SED and visibility are now fairly reproduced with models consisting of the central star, an optically thin dust shell with an inner radius of = 150 – 193 (average 172 ) and = 650 – 720 K (average 685 K), and an optically thick dust cloud with = 4.5 and = 1200 K. The fit should be regarded as tentative. The uncertainties of and are estimated to be K and , respectively, while those of and are about K and , respectively.
The difference of derived for the 1996 and 1999 data may indicate a variation of the dust ejection frequency. If the star experiences dust ejection less frequently, the inner boundary is expected to become larger, and the IR excess is expected to decrease. In fact, as mentioned in Sect. 3, the and magnitudes decreased monotonically by mag from 1996 to 1999. This is consistent with the trend found for derived for the two epochs, but further observations are required to confirm this correlation.
Now we apply the thermally emitting cloud models to the data obtained near maximum light as well for the following reason. Fig. 1 shows that R CrB started its final recovery from the 1995-96 deep minimum about 6 months before our speckle observation on 1996 October 1. If dust ejection occurs rather frequently, for example, every pulsational cycle (40 – 50 days), we can expect that the star underwent dust ejection out of the line of sight during these 6 months. It is likely that newly formed dust clouds out of the line of sight existed on 1996 October 1, in addition to the dust cloud in front of the star responsible for an obscuration of . The latter cloud may already be regarded as part of the optically thin dust shell, because is derived for this cloud by the extrapolation described in Sect. 4. Therefore, for near maximum light, we consider a model with the central star dimmed by , thermal emission from an optically thin dust shell, and that from a newly formed optically thick dust cloud out of the line of sight. Fig. 10 shows the SED and visibility calculated with an optically thick dust cloud with a radius of = 4.5 and = 1200 K, in addition to the dimmed central star and the optically thin dust shell, whose parameters are the same as shown in Fig. 6. The cloud is placed out of the line of sight, 20 (5 mas) offset from the central star in the plane of the sky. Since the central star has already almost regained its brightness near maximum light, the effect of the newly formed dust cloud is minor on the SED and visibility. Therefore, the models including thermal emission from a newly formed dust cloud can also provide good matches to the SED and visibility observed near maximum light.
6 Concluding Remarks
Our 75 mas resolution speckle interferometric observations with the SAO 6 m telescope have spatially resolved the dust shell around R CrB for the first time. Neither the observation near maximum light nor at minimum light shows any clear deviation from circular symmetry.
In order to derive the size of the dust shell, we first considered models consisting of the central star and an optically thin dust shell, neglecting the thermal emission of a newly formed dust cloud. Simultaneous fits of the models to the observed SED and visibility have demonstrated that a model with the central star and an optically thin dust shell with density proportional to seems to be appropriate for R CrB near maximum light. The inner boundary is found to be with a temperature of K.
This simple picture fails to simultaneously reproduce the SED and visibility observed at minimum light, which has led us to investigate models with thermal emission from a newly formed optically thick dust cloud whose angular size is not yet large enough to be spatially resolvable. The SED and visibility obtained at minimum light were shown to be well fitted with such models. The presence of a newly formed dust cloud as hot as 1200 K with a radius of 4 – 5 is inferred, together with an optically thin dust shell with and K. Furthermore, the SED and visibility obtained near maximum light were shown to be fitted also using a model with a newly formed dust cloud out of the line of sight. However, we have also discussed that the discrepancy found for the minimum light data may be attributed to the unusual extinction curve of the obscuring dust cloud. Observations during the very bottom of a deep minimum, when the contribution of the central star is truly negligible, are crucial for investigating the dust shell and dust clouds.
Acknowledgements.
We have used, and acknowledge with thanks, data from the AAVSO International Database, based on observations submitted to the AAVSO by variable star observers worldwide. N.R.I. acknowledges the support of the Long-Term Cooperation program of the Alexander von Humboldt Foundation.References
- (1) Asplund, M., Gustafsson, B., Kiselman, D., Eriksson, K. 1997, A&A, 318, 521
- (2) Asplund, M., Gustafsson, B., Lambert, D. L., Rao, N. K. 2000, A&A, 353, 287
- (3) Bohren, C. F., Huffman, D. R. 1983, Absorption and Scattering of Light by Small Particles, Wiley, New York
- (4) Bussoletti, E., Colangeli, L., Borghesi, A., Orofino, V. 1987, A&AS, 70, 257
- (5) Clayton, G. C. 1996, PASP, 108, 225
- (6) Clayton, G.C., Ayres, T.R. 2001, ApJ, in press, available at http://xxx.lanl.gov/abs/astro-ph/0106529
- (7) Clayton, G. C., Bjorkman, K. S., Nordsieck, K. H., Zellner, N. E. B., Schulte-Ladbeck, R. E. 1997, ApJ, 476, 870
- (8) Colangeli, L., Mennella, V., Palumbo, P., Rotundi, A., Bussoletti, E. 1995, A&AS, 113, 561
- (9) Efimov, Y. S. 1990, SvA, 34, 247
- (10) Fadeyev, Y. A. 1986, in IAU Coll. 87, Hydrogen Deficient Stars and Related Objects, eds. K. Hunger, D. Schönberner, N. K. Rao, Reidel, Dordrecht, 441
- (11) Fadeyev, Y. A. 1988, MNRAS, 233, 65
-
(12)
Feast M. W. 1996, in Hydrogen-Deficient Stars,
ASP Conf. Series Vol. 96, eds. C. S. Jeffery, U. Heber, 3 - (13) Feast, M. W. 1997, MNRAS, 285, 339
- (14) Feast, M. W., Carter, B. S., Roberts, G., Marang, F., Catchpole, R. M. 1997, MNRAS, 285, 317
- (15) Forrest, W. J., Gillett, F. C., Stein, W. A. 1972, ApJ, 178, L129
- (16) Gillett, F. C., Backman, D. E., Beichman, C., Neugebauer, G. 1986, ApJ, 310, 842
- (17) Goncharova, R. I. 1992, I.B.V.S., 3699
- (18) Hecht, J. H., Holm, A. V., Donn, B., Wu, C.-C. 1984, ApJ, 280, 228
- (19) Holm, A. V., Wu, C.-C., Doherty, L. R. 1982, PASP, 94, 548
- (20) Le Bertre, T. 1997, A&A, 324, 1059
- (21) Labeyrie, A. 1970, A&A, 6, 85
- (22) Loreta, E. 1934, Astron. Nachr., 254, 151
- (23) Mattei, J. A. 2000, Observations from the AAVSO International Database, private communication
- (24) O’Keefe, J. A. 1939, ApJ, 90, 294
- (25) Payne-Gaposchkin, C. 1963, ApJ, 138, 320
- (26) Pugach, A. F. 1984, SvA, 28, 288
- (27) Rouleau, F., Martin, P. G. 1991, ApJ, 377, 526
- (28) Savage, B.D., Mathis, J.S. 1979, ARA&A 17, 73
- (29) Shenavrin, V. I., Taranova, O. G., Moroz, V. I., Grigor’ev A. V. 1979, SvA, 23, 567
- (30) Walker, H. J. 1994, CCP7 Newsletter, 21, 40
- (31) Walker, H. J., Heinrichsen, I., Richards, P. J., Klaas, U., Rasmussen, I. L. 1996, A&A, 315, L249