Detection of non-Gaussian Signatures in the VIRMOS-DESCART Lensing Survey††thanks: Based on observations obtained at the Canada-France-Hawaii Telescope (CFHT) which is operated by the National Research Council of Canada (NRCC), the Institut des Sciences de l’Univers (INSU) of the Centre National de la Recherche Scientifique (CNRS) and the University of Hawaii (UH).
We have detected non-Gaussian signatures in the VIRMOS-DESCART weak lensing survey from a measurement of the three-point shear correlation function, following the method developped by Bernardeau, van Waerbeke and Mellier (2002). We obtain a 2.4 signal over four independent angular bins, or equivalently, a 4.9- confidence level detection with respect to measurements errors on scale of about to arc-minutes. Both amplitude and shape are found to agree with theoretical expectations that have been investigated for three cosmological models. This supports the idea that the measure corresponds to a cosmological signal due to the gravitational instability dynamics. Its properties could be used to put constraints on the cosmological parameters, in particular on the density parameter of the Universe, but the error level as well as the cosmic variance are still too large to permit secure conclusions.
Key Words.:
cosmology, gravitational lensing, large scale structure1 Introduction
The large-scale structure of the Universe are expected to form from the gravitational growth of initial density perturbations obeying Gaussian statistics. As the Universe expands and the perturbations grow, non-Gaussian features are expected to emerge in the density field due to gravitational dynamics. These features can be characterized with perturbation theory calculations, which allow to compute for instance the skewness, third moment of the local density probability distribution function (Peebles 1980, Fry 1984, Bernardeau 1992). The reduced skewness of the density field has been found to be quite insensitive to the variance and the cosmological parameters, (Juszkiewicz et al. 1992, Bernardeau 1994). In contrast, weak lensing surveys are sensitive to since they trace the integrated mass along the line-of-sight which is roughly proportional to the density parameter of the Universe. Weak lensing by large scale structures has been measured by several teams as a coherent distortion field of distant galaxies over large angular distances (Bacon et al. 2000 and 2002; Hämmerle et al.; 2002; Hoekstra et al. 2002; Kaiser et al. 2000; Maoli et al. 2001; Réfrégier et al 2002; Rhodes et al. 2001; Van Waerbeke et al. 2000, 2001 and 2002; Wittman et al. 2000). The projected mass density reconstructed from the distortion field ( the convergence field) can be used for non-Gaussian signatures searches, as shown in Bernardeau, van Waerbeke & Mellier (1997, hereafter BvWM97). This work and further studies (Jain & Seljak 1997; van Waerbeke, Bernardeau & Mellier 1999) have shown that the non-Gaussian properties of the convergence field can be used as a probe of the cosmological density parameter, with a weak dependence on the cosmological constant , provided that the redshift distribution of the sources is known.
However, a straight application of these theoretical considerations to real data sets turned out to be arduous. The convergence field has to be recovered from a mass reconstruction process which uses a continuous shear field obtained from a smoothed map of the discrete galaxy ellipticities. Unfortunately, survey topologies are generally complex and are alterated by masked areas due to light scattering, bright stars, comet-like reflections, asteroid/airplane tracks, very bright galaxies, etc…. Since the mask sizes cover a range of scales from a few arc-seconds to two degrees and are strongly anisotropic (for instance bright stars preferentially saturate along CCD columns), results of mass reconstruction in such data sets are not yet reliable. An alternative approach is the aperture mass applied to cosmic shear (Schneider et al. 1998), which allows the measurement of the skewness from the distortion field directly, bypassing the mass reconstruction process. So far, our attempts for measuring the skewness of the aperture mass lead to very noisy and un-significant results. Recently, Bernardeau, van Waerbeke & Mellier (2002, hereafter BvWM02) have proposed a new method using some specific patterns in the shear three-point function. This method has also the advantage to bypass the mass reconstruction process. Despite the complicated shape of the three-point correlation pattern, BvWM02 uncovered a specific geometrical property and demonstrated it can be used for the measurement of non-Gaussian features. Their detection strategy based on this method has been found to be robust, usable in patchy catalogs, and quite insensitive to the topology of the survey. In the following we apply this method to the VIRMOS-DESCART weak lensing survey done at the Canada-France-Hawaii Telescope.
2 Optimized 3-point correlation function applied to VIRMOS-DESCART data
2.1 Method
Let us consider a triplet of galaxies at locations , and , and their shear estimates , and . BvWM02 introduced a 2D angular vector field (representing 2 components of the general shear 3-point correlation functions),
| (1) |
viewed as a function of for a fixed distance. At fixed separation , the components of are expected to scale like the square of the shear 2-point correlation function, . Its sensitivity to the cosmological density parameter () is expected to be similar to the convergence skewness (), with an additional dependence on the slope of the mass power spectrum. The way varies as a function of is in general complicated although asymptotic properties can be obtained analytically. However has been found to be rather uniform, and perpendicular to , over an elliptic area that covers the segment joining to . This central pattern turns out to be robust against different cosmologies and smoothing scales, with an amplitude which can be related to the cosmological parameters. The results obtained by BvWM02 in synthetic catalogs suggested that present-day cosmic shear surveys were already large for a secure detection.
We consider the geometrical average,
| (2) |
which corresponds to the average three-point function inside an elliptic area, , encompassing the points and (they are actually the foci of the ellipse). In this domain is expected to vary weakly and its average value is a vector quantity orthogonal to the direction111mathematically it means that the only non-zero component of is along , but has a negative value. that depends only on the - pair separation. An optimum selection of pair points, where close pairs and highly elliptical galaxies are rejected, turns out to provide an optimal information on non-Gaussian features in simulated catalogues. BvWM02 checked that different sources of noise produced by the intrinsic ellipticity distribution of galaxies, by realistic galaxy shape measurements and PSF corrections and by masking effects do not spoil the result. Final tests and validations were carried out with simulated catalogues containing as many galaxies as real data, with ellipticity distribution, PSF anisotropy and masking templates similar to the VIRMOS-DESCART sample. In all configurations the global signal to noise remains higher than 5 for scales between 30 arc-seconds to 5 arc-minutes.
2.2 The VIRMOS-DESCART sample
The VIRMOS-DESCART sample used in this work is part of the DESCART
cosmic shear programme222http://terapix.iap.fr/Descart which
uses the VIRMOS photometric/imaging
survey333http://www.astrsp-mrs.fr for wide field cosmic
shear. It covers 11.5 deg2 of CFH12K images spread over four
uncorrelated fields. All data were obtained in I-band up to a
limiting magnitude of (within 5 arc-second aperture,
5-), which is consistent with a mean source redshift of
of the VIRMOS-DESCART sample (van Waerbeke et al. 2002).
The data contain all observations used by van Waerbeke et al. (2001)
plus new fields obtained in September and November 2000. All the
images were processed as described in van Waerbeke et al (2001) at
the TERAPIX data center444http://terapix.iap.fr. From an
initial detection we build up a sample containing 1.6 millions
objects. After masking and all galaxy selection processes, it
reduces to 580,000 galaxies, covering an effective area of 8.5
deg2. Close-pairs with angular separation smaller than 10
arc-seconds can produce systematics and are rejected (see van
Waerbeke et al. 2000).
Following standard notation, the shear is defined as the mean source
ellipticities
| (3) |
where is the angle between the major axis of the source galaxy and the axis, and is determined by the major axis length and minor axis length . It is computed according to the rules and weighting schemes given in Pen, van Waerbeke & Mellier (2002) and the PSF anisotropy corrections used in van Waerbeke et al. (2002). In particular, we consider in this Letter the decomposition into and modes described in Pen et al. (2002) which is used for residual systematics checks for the 2-point statistics.
The statistical estimators for the binned two and three point functions are given by
| (4) | |||||
| (5) |
where is opposite to the component of the ellipticity of galaxy along the ()-direction. The summations are made for pairs or triplets such that is in the chosen bin. lies within the ellipse defined by and are weights associated to each galaxy according to the scheme discussed in BvWM02.
2.3 The VIRMOS-DESCART 2 and 3-point correlation functions
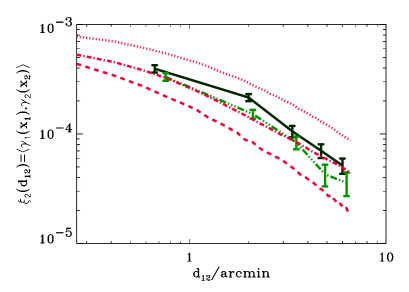
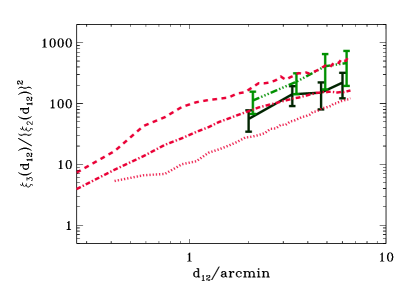
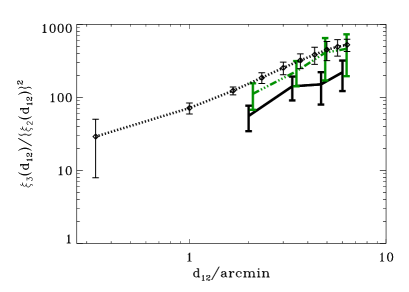
Figure 1 shows the estimated 2-point (top) and reduced
3-point (bottom) correlation functions ( in units of
). Measurements have been made in regularly spaced bins of
width 400 pixels (e.g. 1.3 arcmin). For comparison, the thick dotted
lines shows the corresponding quantity for an open CDM model, the thick
dashed line for a CDM and the dot-dasled line for a
CDM model. The source redshift is one, very close to our
mean source redshift of . In this plot the error bars are the
measurement errors and do not include the cosmic variance (see BvWM02).
The dot-dot-dashed line represents the signal corrected from the
residual systematics (the -mode contribution to the two-point
correlation function subtracted from the mode contribution as
discussed in Pen et al. 2002), while the solid line shows the total
() measured signal. The closeness of the two curves reveals the
small amount of residual systematics still present in the 2-point
correlation function.
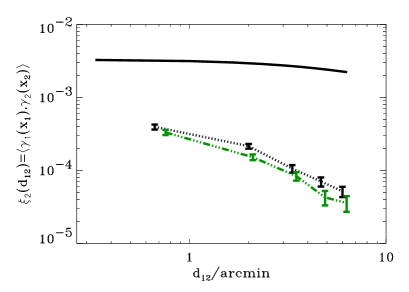
A quality assessment of the 3-point function
measurements can be done by studying the effect of PSF correction. It
is inferred from the star shapes (they ought to be round) following
the standard procedure described initially in Kaiser, Squires &
Broadhurst (1995). It can be thought as a star shear field that has to
be subtracted off the measured galaxy shapes. One can then measure the
2- and 3-point correlation functions of the star field and compare
them to the PSF corrected data set. This is presented on Figure
2. The solid line in the top and bottom plots
respectively show the star two and three point functions, which are
compared to the same quantities measured on the corrected galaxies
(dashed lines and dashed-dot line for the corrected -mode 2-point
function). The star two-point correlation function is significantly
larger than the galaxy signal, but this is known not to be a problem
for the two-point function: Erben et al. (2001) and Bacon et al.
(2001) have shown that the PSF correction can account for star
anisotropies as large as (the stars r.m.s. anisotropy is
in our data) to a precision better than than one percent. This is
also demonstrated in BvWM02 using cosmic shear simulated data. The
small amplitude of the -mode is another proof of the robustness of the
correction.
 |
 |
 |
 |
BvWM02 have also shown that the correction scheme works for the shear three-point function. We see that the situation for the three-point function (Figure 2, bottom panel) is far more interesting than the two-point function: the correction is smaller (that is in principle more robust), and the angular dependence of the star three point function is totally different from the galaxy three-point function. If our three-point function signal were dominated by systematics it would likely not fit the expected signal as we can see from Figure 1, but would be more similar to Figure 2, bottom panel (solid line). Finally we have checked that cuts in magnitudes do not significantly change the results. Therefore, they are not produced by one single class of objects of the sample. We have thus some evidences that what is observed is genuinely cosmological.
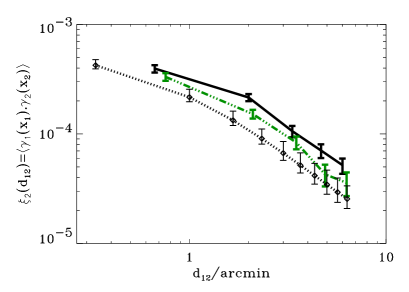
Another issue, not taken into account in the error bars, is the so-called cosmic variance, that is the amount by which such a signal can vary in surveys of finite size. The complete theory of cosmic variance for such a survey is yet to be done and is likely complex (given the topology). Figure 3 shows the cosmic variance obtained from a set of 7 ray-tracing realizations of the open CDM model (Jain et al. 2000). Note that the error-bars in the different bins are correlated. A rough examination of the situation shows that while the cosmic variance dominates the error budget for the two-point function, observational errors and cosmic variance are of similar amplitude for the three-point function. From the examination of Fig. 1 CDM is clearly in better agreement with the data than the other two models, while CDM is marginally acceptable.
 |
 |
3 Discussion
The result shown on Figure 1 is the first detection of non-Gaussian features in a cosmic shear survey. The signal is detected with a 2.4- confidence level on 4 independent bins which gives a 4.9- global confidence level. Such a result opens the route to break the degeneracy between and in a way which is independent on assumptions beyond the solely hypothesis that large-scale structures grows from gravitational instability of an initial Gaussian field. We note that the amplitude of the reduced 3-point correlation function exhibits an angular dependence which is in agreement with theoretical expectations. It supports the interpretation of these results as genuine effects of the gravitational dynamics.
The signal is however still too noisy to provide reliable information on cosmological parameters. Moreover, several obstacles have yet to be overcome. It is first important to understand to which level the measurements are contaminated by systematics. This can be done through consistency checks yet to be invented (a statistic which cancels the signal in a non-trivial way, like the degrees rotation test for the aperture mass will have to be found for the three-point function). We have already checked with the anisotropy of the stars that our signal is unlikely to be dominated by systematics since it would otherwise exhibits a totally different angular dependence. In the next stages, the scientific interpretation of the three-point function measurements will require a significant improvement over several issues:
-The knowledge of the redshift distribution of the sources is crucial for the third order statistics (see BvWM97);
-The source clustering effect might bias the measurement is a significant way (Bernardeau 1998, Hamana et al. 2002) if the width of the source distribution is too large;
-Intrinsic alignment of galaxies have a completely unknown effect on the non-Gaussian properties of the shear field.
Resolving these issues will require progress from both the theoretical/simulation side and from the observations, which are already on their way.
Acknowledgements.
We thank the VIRMOS and Terapix teams who got and processed the VIRMOS-DESCART data, B. Jain and M. White for the use of their ray-tracing simulations as well as T. Hamana for useful comments. This work was supported by the TMR Network “Gravitational Lensing: New Constraints on Cosmology and the Distribution of Dark Matter” of the EC under contract No. ERBFMRX-CT97-0172. FB thanks IAP for hospitality.References
- (1) Bacon, D., Réfrégier, A., Ellis, R.S. 2000, MNRAS , 318, 625.
- (2) Bacon, D., Massey, R., Réfrégier, A., Ellis, R.S. 2002, preprint astro-ph/0203134.
- (3) Bacon, D., Réfrégier, A., D., Clowe, D., Ellis, R.S. 2001, MNRAS , 325 , 1065.
- (4) Bernardeau, F. 1992, ApJ, 392, 1.
- (5) Bernardeau, F. 1994, A&A, 433, 1.
- (6) Bernardeau, F. 1998, A&A, 338, 375.
- (7) Bernardeau, F., van Waerbeke, L., Mellier, Y. 1997, A&A, 322, 1 (BvWM97).
- (8) Bernardeau, F., van Waerbeke, L., Mellier, Y. 2002, preprint astro-ph/0201029 (BvWM02).
- (9) Bouchet, F.R., Juszkiewicz, R., Colombi, S., Pellat, R. 1992, ApJL, 394, L5.
- (10) Erben T., van Waerbeke, L., Bertin, E., Mellier, Y., Schneider, P. 2001, A&A, 366 , 717.
- (11) Hamana, T., Colombi, S., Thion, A., Devriendt, J., Mellier, Y., Bernardeau, F. 2002, MNRAS , 330, 365.
- (12) Hämmerle, H., Miralles, J.-M., Schneider, P., Erben, T., Fosbury, R.A.E., Freudling, W., Pirzkal; N., Jain, B., White, S.D.M. 2002, A&A, 385, 743.
- (13) Hoekstra, H., Yee, H., Gladders, M.D., Barrientos, F., Hall, P.B., Infante, L. 2002, preprint astro-ph/0202285
- (14) Jain, B., Seljak, U. 1997, ApJ, 484, 560.
- (15) Jain, B., Seljak, U., White, S.D.M. 2000, ApJ, 530, 547.
- (16) Kaiser, N., Wilson, G., Luppino, G. 2000, preprint astro-ph/0003338.
- (17) Kaiser, N., Squires, G., Broadhusrt, T. 1995, ApJ , 449 , 460.
- (18) Maoli, R., van Waerbeke, L., Mellier, Y., et al. 2001, A&A , 368, 766.
- (19) Peebles, P.J.E., The Large-Scale Structure of the Universe, Princeton University Press, 1980.
- (20) Pen, U.L., van Waerbeke, L., Mellier, Y. 2002, ApJ, 567, 31.
- (21) Rhodes, J., Réfrégier, A., Groth, E.J. 2001, ApJ , 536, 79.
- (22) Réfrégier, A., Rhodes, J., Groth, E.J. 2002, preprint astro-ph/0203131.
- (23) Schneider, P., van Waerbeke, L., Jain, B., Kruse, G. 1998, MNRAS, 296,873.
- (24) van Waerbeke, L., Bernardeau, F., Mellier, Y. 1999, A&A, 342, 15.
- (25) van Waerbeke, L., Mellier, Y., Erben, T. et al. 2000, A&A , 358, 30.
- (26) van Waerbeke, L., Mellier, Y., Radovich, M. et al. 2001, A&A, 374, 751.
- (27) van Waerbeke, L., Mellier, Pelloó, R., Pen, U.-L., McCracken, H.J., Jain, B. 2002, preprint astro-ph/0202503.
- (28) Wittman, D., Tyson, J.A., Kirkman, D., Dell’Antonio, I., Bernstein, G. 2000, Nature , 405, 143.