An AGN Identification for 3EG J2006-2321
Abstract
We present a multiwavelength analysis of the high-energy gamma-ray source 3EG J2006-2321 (, ). The flux of this source above 100 MeV is shown to be variable on time scales of days and months. Optical observations and careful examination of archived radio data indicate that its most probable identification is with PMN J2005–2310, a flat-spectrum radio quasar with a 5-GHz flux density of 260 mJy. Study of the optical counterpart indicates a redshift of 0.833 and variable linear polarization. No X-ray source has been detected near the position of PMN J2005–2310, but an X-ray upper limit is derived from ROSAT data. This upper limit provides for a spectral energy distribution with global characteristics similar to those of known gamma-ray blazars. Taken together, these data indicate that 3EG J2006–2321, listed as unidentified in the 3rd EGRET Catalog, is a member of the blazar class of AGN. The 5-GHz radio flux density of this blazar is the lowest of the 68 EGRET-detected AGN. The fact that EGRET has detected such a source has implications for unidentified EGRET sources, particularly those at high latitudes (), many of which may be blazars.
1 Introduction
Since the earliest days of gamma-ray astronomy, one of the foremost questions in the field has been the identity of discrete sources. In 1972-1973, SAS-2 was the first mission to detect radiation from the Vela and Crab pulsars (Fichtel et al. 1975). Launched in 1975, COS-B built on the success of SAS-2 by detecting 25 point sources. However, only four of those were identified (Swanenburg et al. 1981). As instruments became more sophisticated, the number of identified and unidentified sources has increased. The present list (Hartman et al. 1999, hereafter H99) is comprised of the 271 sources detected by the Energetic Gamma-ray Experiment Telescope (EGRET) on the late Compton Gamma-ray Observatory (CGRO) that display significant flux above 100 MeV. Of these, 169 remain unidentified. The 102 identified sources include a probable association with the radio galaxy Cen A, a solar flare, and the LMC. The remaining sources are pulsars (5), AGNs with low-confidence (27), and AGNs with high-confidence (66). The AGNs are blazars, typically flat-spectrum radio quasars (FSRQs) or BL Lac objects. There is statistical evidence that supernova remnants (Sturner & Dermer 1995; Esposito et al. 1996), OB associations (Kaaret & Cottam 1996; Romero, Benaglia, & Torres 1999), and objects born in the Gould Belt (Gehrels et al. 2000) are also gamma-ray emitters, but no single source type has been conclusively associated with any of these classes.
Due to the relatively poor angular resolution of even the best gamma-ray telescopes, efforts to identify sources depend on factors other than spatial coincidence. Pulsars are typically found in the Galactic plane while most blazars are found at high latitude where the diffuse Galactic emission does not overwhelm the source photons. Additionally, variability over hours and days offers evidence against identification as a pulsar (Ramanamurthy et al. 1995) while blazars are known to have strongly variable gamma-ray flux (e.g. Mattox et al. 1997a). But latitude and variability studies cannot be used alone to identify individual gamma-ray sources with high confidence as pulsars or blazars; for pulsars, a clear pulse profile must be detected, while for blazars, multiwavelength studies are necessary as these sources have a distinct broad-band signature. They are variable at many frequencies, feature flat radio spectra, show variable polarization at radio and optical frequencies, display power-law spectra at X-ray and gamma-ray energies, and have moderate to large redshifts.
Recently there have been a number of papers published that describe efforts to identify individual gamma-ray sources using multiwavelength analyses (e.g., Mukherjee et al. 2000; Halpern et al. 2001; Mirabel & Halpern 2001; Reimer et al. 2001a). In the present paper a multiwavelength study of 3EG J2006–2321 is presented, and the data indicate that this source, listed as unidentified in H99, is a blazar. In §§2-5 the relevant data are presented; this is followed in §6 by a short summary of the multifrequency data. The weak flux density of the radio counterpart and its relevance to other high-latitude unidentified EGRET sources is discussed in §7. In §8 conclusions and suggestions for future work are summarized.
2 Gamma-ray Observations
The average flux displayed by 3EG J2006–2321 from 1991 April through 1995 September (the time span covered by H99) is photons cm-2 s-1 in the energy range MeV, making it a relatively faint EGRET source. The position of 3EG J2006–2321 is , and the mean radius of the 95% confidence contour is about . The source is well-isolated; its closest gamma-ray neighbor is more than away and its high Galactic latitude ensures that the Galactic diffuse radiation does not interfere with the source photons. The EGRET spectrum (from 30 MeV to 30 GeV) is consistent with a power-law photon index .

A light curve of this source from CGRO Phase 1 through Cycle 4 is shown in Figure 1. The first detection by any telescope of 3EG J2006–2321 occured during EGRET Viewing Period (VP) 5.0 (1991 July 12-26) when it was detected with a flux of photons cm-2 s-1 at a significance of 4.4. During this time the source was 286 from the instrument axis, and there is no evidence that the source was variable on a -day time scale during this observation. Three weeks later 3EG J2006–2321 was 13∘6 from the EGRET axis and was not detected. From 1991 October 31-November 7 (EGRET VP 13.1) the source was again 136 off-axis and was detected with a flux of photons cm-2 s-1 at the 4.8 level. Although 3EG J2006–2321 was within 20∘ of the instrument axis during six subsequent VP’s, it was never again detected by EGRET.
There is evidence that this source is variable over time scales of weeks. McLaughlin et al. (1996) describe a statistic, called the variability index . This statistic is used to calculate the probability that a given light curve is consistent with an intrinsically nonvariable source and is defined as follows. The for the light curve is
| (1) |
where is the number of observations, is the detected flux during the ith observation, is the mean flux for the viewing period, and is the 1 flux uncertainty of the ith observation. If is the probability of obtaining a value of equal to or greater than the empirical from an intrinsically nonvariable source, then . Roughly speaking, if then the source in question is not considered to be variable; if then the source may be variable. The variability index for the long-term light curve in Figure 1 is 2.9, corresponding to a probability of that these data are produced by an intrinsically nonvariable source.
During VP 13.1, the source was variable on a day time scale. The gamma-ray observations of 3EG J2006–2321 during this VP are discussed in detail in Wallace et al. (2000); the relevant information will be summarized here. A light curve is shown in the inset of Figure 1. The first two days are broken down into four 12-hour periods; the remaining points represent full days. The peak flux, centered in MJD 48560.25, is photons cm-2 s-1; this 12-hour detection has a significance of 5.4. The ratio of peak to average flux for the VP is 5:1, and the ratio of peak flux to the overall EGRET mean flux for 3EG J2006–2321 is nearly 24:1. It is very unlikely that the source is not variable on this short time scale. Applying a test to the light curve yields a variability index of 3.2, corresponding to a probability of 0.0006 that these data are produced by an intrinsically nonvariable source.
3 Radio Observations
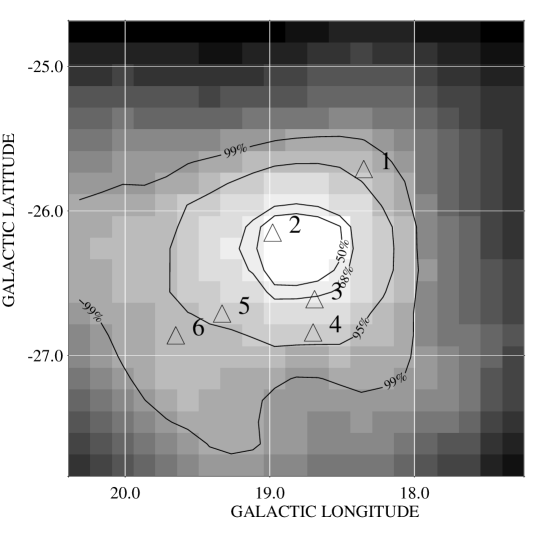
To find a radio counterpart to 3EG J2006–2321, we first search its error circle for 5-GHz sources since gamma-ray blazars typically have significant flux densities at this frequency (Mattox et al. 1997b). At southern declinations, the Parkes-MIT-NRAO (PMN) survey (Griffith & Wright 1993) is the deepest at 5 GHz; we therefore look to these sources. We expect that if 3EG J2006–2321 is indeed a blazar, it, like other EGRET blazars, will be related to a flat-spectrum radio source, with (where ). The NED database lists six 5-GHz sources within the EGRET 99% error contour; these sources are listed in Table 1 with their 5-GHz flux densities, angular separations from the gamma-ray position, and radio spectral indexes. Figure 2 indicates their positions on a map of the gamma-ray intensity of 3EG J2006–2321. These radio candidates are discussed below in order of increasing right ascension.
1. PMN J2003–2333. This source has a 5-GHz flux density () of 43 mJy, the weakest of all the candidate sources, and it is from the EGRET position, between the 95% and 99% confidence contours. The nearest source to it in the NRAO/VLA Sky Survey (NVSS; Condon et al. 1998) has a 1.4-GHz flux density of 15.3 mJy, which, if identified with the PMN source would give it a rising radio spectrum with an index of 0.83. However, the beam size of the Parkes telescope is , and there are at least four NVSS sources within of the PMN position having a combined flux density of 45 mJy at 1.4 GHz. Given the weakness of all of these sources, and the possibility of source confusion at 5 GHz, we do not consider this to be a promising candidate.
2. PMN J2005–2310. This source is the brightest of the six, with a 5-GHz flux density of 260 mJy. It is located well within the 50% confidence contour, at from the EGRET position. It appears in the NVSS with a 1.4-GHz flux density of 302 mJy. We calculate from these data. If we include the 365 MHz flux density of 260 mJy from the Texas survey (Douglas et al. 1996) we find that the radio spectrum is flatter, with .
3. PMN J2007–2335. This source has a 5-GHz flux density of 141 mJy and is located near the 68% confidence contour, at from the EGRET position. The nearest NVSS source has a flux density of 318 mJy, giving it a spectral index of –0.65 between 1.4 and 4.85 (5) GHz, below but near the threshold of -0.5 for flat sources. Its lower-energy radio flux is relatively high; at 365 MHz it has a flux density of 2.98 Jy. If this point is taken into account, its spectral index falls to –1.2. There is also the possibility of some confusion with another NVSS source away that has a flux density of 177.5 mJy. However, in light of its relative brightness and near-flat spectrum, we do not yet exclude it from our analysis.
4. PMN J2008–2338. This source has a 5-GHz flux density of 82 mJy and is from the EGRET position, just inside the 95% confidence contour. It has a 1.4-GHz counterpart with flux density 275 mJy, giving it a steep spectrum with an index of –0.97. It has a 993-mJy counterpart at 365 MHz; this does not appreciably change . Only one EGRET blazar listed in H99, 3EG J1937-1529, has a comparable radio spectral index (-0.96). Therefore the steepness of the radio spectrum is not unheard of among EGRET blazars, but it is rare. The combination of the steep radio spectrum, weak , and large separation from the gamma-ray position leads us to exclude this source from consideration.
5. PMN J2008–2305. This source has a 5-GHz flux density of 47 mJy and is from the EGRET position, just inside the 95% confidence contour. It has a 1.4-GHz counterpart with flux density 41 mJy, giving it a flat spectrum with an index of +0.05. There are no known counterparts at other frequencies.
6. PMN J2009–2250. This source has a 5-GHz flux density of 49 mJy and is from the EGRET position, between the 95% and 99% confidence contours. It has a 1.4-GHz counterpart with flux density 97 mJy, giving it a spectral index of –0.55, below but near the flat-spectrum threshold. If its 370-mJy counterpart at 365 MHz is taken into account, the spectral index falls to -0.78.
After excluding the two weak steep-spectrum sources, we are left with PMN J2005–2310, PMN J2007–2335, PMN J2008–2305, and PMN J2009–2250 as candidates for association with 3EG J2006–2310. For gamma-ray blazars, the 5-GHz flux density has been found to correlate linearly with peak gamma-ray flux at the 99.998% confidence level (Mattox et al. 1997b). (It should be noted that this correlation is not well-understood and it serves only as a coarse guide. See §8.) There are only ten EGRET blazars with peak flux above photons cm-2 s-1, and they all have Jy. We therefore expect to find a relatively bright 5-GHz counterpart to 3EG J2006–2321 with its peak flux of photons cm-2 s-1. However, the brightest of these candidates, PMN J2005–2310, has mJy. Two of the other candidates are far dimmer still; the flux densities of PMN J2008–2305 and PMN J2009–2250 are times weaker than that of PMN J2005–2310. Therefore if we are to identify 3EG J2006–2321 with any of the four remaining radio sources, we see that PMN J2005–2310 is the most compelling candidate, followed by PMN J2007–2335. Another point in favor of these two sources is that their angular separations from the EGRET position are smaller than for the weaker sources. We therefore regard PMN J2008–2305 and PMN J2009–2250 as highly improbable candidates and restrict ourselves to considering only PMN J2005–2310 and PMN J2007–2335.
4 Optical Observations
4.1 PMN J2007–2335
On 2001 June 29, six 300-s exposures of the field containing PMN J2007–2335 were taken with a CCD on the 1.3m telescope of the MDM Observatory. The combined -band image reveals a normal-looking galaxy at the position of the NVSS source, (J2000) , with . It is highly unlikely that such a galaxy is the source of the high-energy gamma rays; therefore PMN J2007–2335 is rejected as the counterpart of 3EG J2006–2321, leaving only 3EG J2006–2321 as a viable candidate.
4.2 PMN J2005-2310
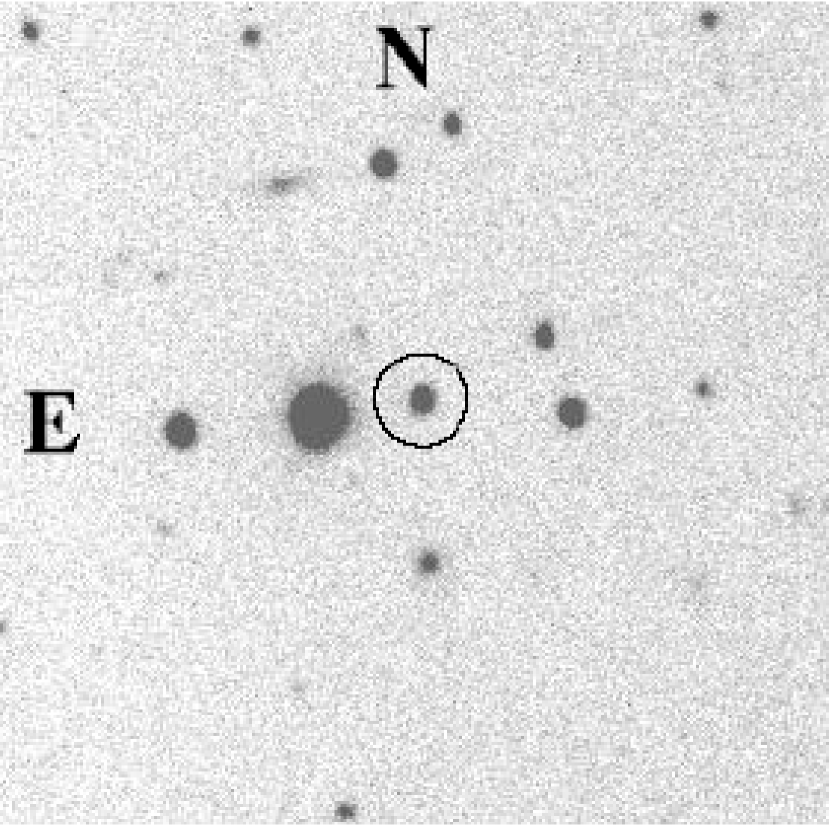
Three CCD images of 200-s exposure in the band centered on the position of PMN J2005–2310 were taken with the MDM Observatory 2.4m telescope on 2000 July 24. The central of the combined image is shown in Figure 3. A point-like optical counterpart with was found at (J2000) , within of the NVSS position of PMN J2005–2310, consistent with their combined astrometric uncertainty. An object at this position and comparable brightness can be seen on various Digitized Sky Survey plates. Galactic extinction is moderate at these latitudes; the absorption in the band is mag (Schlegel et al., 1998), giving the source an intrinsic .
An optical spectrum of this object was obtained with the Goldcam spectrometer on the 2.1m telescope of the Kitt Peak National Observatory (KPNO) on 2000 June 3. A single 3000-s exposure using grating 240 and a slit width of yielded a resolution of Å. The target was acquired by blind offset from a bright star to the east (see Figure 3), and the slit was oriented at the parallactic angle, in this case N-S, which is essential at such a southerly declination in order to obtain accurate spectrophotometry. The fully reduced spectrum is shown in Figure 4. It features a single broad emission line at 5129 Å which, from the absence of other emission lines over the observed spectral range, we identify as Mg II 2798 at . The Mg II line has the unique property that there is a range in redshift over which it is the only prominent quasar emission line that falls in the region observed by the typical optical spectrograph in first order, which covers at most a factor of 2 in wavelength. Reliable redshifts are often achieved using Mg II only. The neighboring broad emission lines are [C III] 1909 and H 4340, which at would be redshifted to 3499Å and 7955Å, respectively, both outside of our observed spectral range. A narrow forbidden line that is sometimes seen in quasars is [O II] 3727, and there is a marginal detection of this line at 6832Å in our spectrum of PMN J2005–2310. The full width at half maximum of the broad Mg II line is 3400 km s-1, and its rest-frame equivalent width is 15.7 Å, larger than that of BL Lac objects, but typical of FSRQs that have been identified with EGRET sources. The continuum flux is consistent with the magnitude measured from the CCD image obtained 52 days later.

Strong and variable optical polarization is a characteristic blazar signature (e.g., Pesce et al., 1997), so optical polarimetry has been performed for PMN J2005–2310. The source was observed with the IAGPOL imaging polarimeter (Magalhães et al., 1996) at the 61 cm IAG-USP telescope at the Laboratório Nacional de Astrofísca (LNA) on 2000 August 5 and on 2001 June 15. The polarimeter is a modification of the observatory’s direct CCD camera to allow for high-precision imaging polarimetry. The first element in the beam is a 51mm diameter rotatable, achromatic half–wave retarder followed by a Savart plate built by Opto Eletrônica, São Paulo. One polarization modulation cycle is covered for every rotation of the waveplate. The simultaneous observations of the two beams allows observing under non-photometric conditions at the same time that the sky polarization is practically cancelled (Magalhães et al., 1996). Further details are given by Kay et al. (1999).
The log of observations is presented in Table 2. CCD exposures were taken through the filter with the waveplate rotated through 16 positions (2000 Aug 5) and 12 positions (2001 June 15) apart. The exposure time at each position was 300 s. The instrumental Stokes parameters and were then obtained, as well as the theoretical (i.e., photon noise) and measurement errors. The latter are estimated from the residuals of the observations at each waveplate position angle () with regards to the expected cos () curve and are quoted in Table 2; they are consistent with the photon noise errors (Magalhães, Benedetti & Roland, 1984).
Due to the relative faintness (for the telescope) of PMN J2005–2310, care was taken to ensure that the estimates of sky values per pixel were robust. We found that the mode option in the IRAF photometry package gave consistent results for different annuli around the object. The instrumental and values were then converted to the equatorial system from data of two polarized standard stars (Turnshek et al., 1990) obtained in each night. The instrumental polarization was measured to be less than 0.03% from observations of unpolarized stars in the same night. We have hence applied no such correction to our data.
Table 2 shows that on 2000 August 5, PMN J2005–2310 was significantly polarized while that was not the case on 2001 June 15. We conclude that PMN J2005–2310 has a highly variable optical polarization, a characteristic blazar signature, lending further credence to the association of 3EG J2006–2321 with PMN J2005–2310.
The imaging polarimetry includes data on targets angularly close to PMN J2005–2310, thereby providing the means to estimate the interstellar (IS) polarization towards that general direction. We used a package, pccdpack, specially written for the analysis of field stars (Pereyra, 2000). A sample of 25 field stars in the 2000 images and 23 field stars in the 2001 images provided the weighted average polarization values quoted in Table 2. The combined, weighted average for the IS polarization is (1.470.01)% @ 21.1. This IS polarization estimate of about 1.5% is entirely consistent with the expected maximum percent IS polarization (Serkowski et al., 1975) and AV=0.5 mag. Incidentally, this equatorial position angle towards the direction of PMN J2005-2310 corresponds to a Galactic position angle , i.e., parallel to the Galactic plane, confirming that we are measuring an IS component with the field stars. The weighted IS polarization is much smaller than the 2000 August observed polarization of PMN J2005–2310 and hardly effects it; the intrinsic polarization of the blazar on that date becomes (13.52.3)% @ 61.
5 X-ray Observations
The region surrounding 3EG J2006–2321 has had little exposure to X-ray instruments. The sole data come from the ROSAT All-Sky Survey (Voges et al. 1999; Voges et al. 2000) during 1990 October 6-26; in these data (both the Bright and Faint Source Catalogs) there is no source within of the position of PMN J2005–2310. This places an upper limit on the X-ray flux of the source in question. A typical dim source in this region has a PSPC count rate of counts s-1. Assuming a power-law spectrum with photon index with and Galactic cm-2, this corresponds to an unabsorbed flux between 0.1 keV and 2.0 keV of ergs cm-2 s-1, which we adopt as an upper limit for PMN J2005–2310.

6 Summary of Multifrequency Data
As 3EG J2006-2321 is faint, well off the Galactic plane, and has no conspicuous objects of astronomical interest (e.g., SNR’s, OB associations, X-ray sources) within its error circle, it has had relatively little previous exposure to telescopes in any frequency range. However, from the analysis of archived data in the radio, X-ray, and gamma-ray regions, and from the results of optical spectroscopy and polarimetry, it is evident that the source is a member of the blazar class of AGN. Its gamma-ray flux is variable on time scales of days and months. Its radio counterpart is a flat-spectrum radio quasar (FSRQ) with a large redshift and strong, variable optical polarization. Its X-ray upper limit makes its spectral energy distribution (SED, Figure 5) consistent with a bimodal shape, similar to SED’s of known gamma-ray blazars (e.g., von Montigny et al. 1995). Assuming a cosmology with and and using the latest value of the Hubble constant km/s/Mpc (Freedman et al. 2001), the peak gamma-ray isotropic luminosity between 100 MeV and 10 GeV for 3EG J2006–2321 is ergs s-1, within the range of other flaring gamma-ray AGN (e.g., McGlynn et al. 1997; Mattox et al. 1997a, 2001a). Although there is evidence that the comological constant is nonzero (Perlmutter et al. 1999), is assumed here only to normalize comparisons with previous calculations.
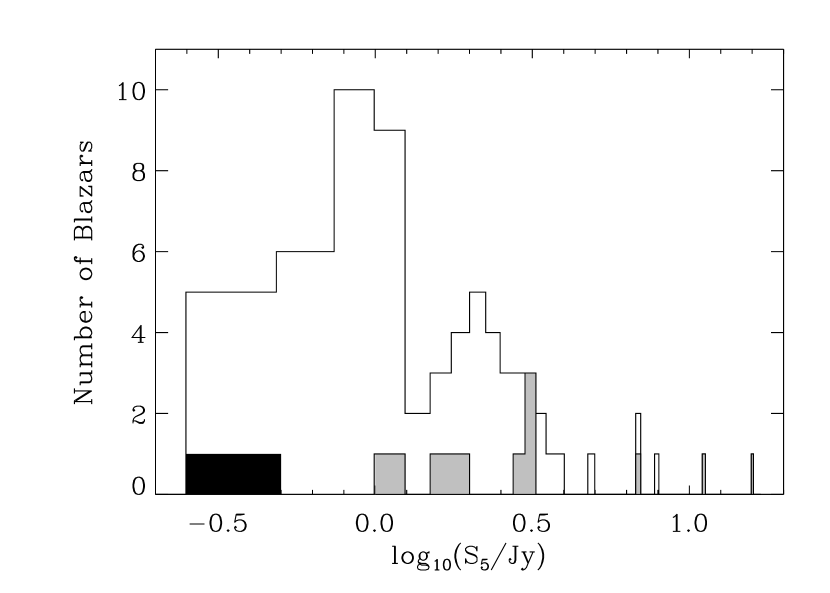
7 On the Low Flux Density of PMN J2005–2310 and Implications for High-latitude Unidentified Sources
It may be argued that the present source is unusual among gamma-ray blazars as its 5-GHz flux density is weaker than that of any other EGRET AGN and much weaker than any other blazar with comparable peak gamma-ray flux. [The EGRET blazars with the lowest 5-GHz flux densities on record are 3EG J0743+5447 (272 mJy) and 3EG J2158–3023 (407 mJy). The weakest among EGRET blazars with peak high-energy gamma-ray flux photons cm-2 s-1 is 1080 mJy, from PKS 1406–076, associated with 3EG J1409–0745.] However, of PMN J2005–2310 is not anomalous among radio counterparts of gamma-ray blazars; it is merely low. Figure 6 shows the distribution of 5-GHz flux densities of EGRET blazars; PMN J2005–2310 is shown in black, other sources with peak gamma-ray flux photons cm-2 s-1 are gray. It can be seen that while the radio flux density of the present source is weak, it conforms to the prevailing distributions and does not alter them in any significant way. Additionally, Mattox et al. (1997b), as was mentioned in §3, have shown that for confirmed EGRET blazars, the 5-GHz flux density and the peak gamma-ray flux are correlated. Mirabel et al. (2000) indicate that this correlation is not linear, but that there is a trend toward low MeV] with increasing peak gamma-ray flux, which suggests that the identifications of Mattox et al. (2001b) are incomplete, and that low-flux radio sources should be counterparts of unidentified EGRET sources. The present source is in accordance with this trend; it has the weakest 5-GHz flux density of any EGRET blazar, but has displayed the seventh-highest peak gamma-ray flux value. We conclude that, ultimately, 3EG J2006–2321 is not due any special attention for the weakness of its radio counterpart.
There are, however, implications of EGRET’s ability to detect such a source. Attention was first drawn to 3EG J2006–2321 when the EGRET database was systematically searched for sources exhibiting variability on short ( day) time scales (Wallace et al. 2000). All the 3EG sources were examined across all VP’s from 1991 April to 1995 September, and 3EG J2006–2321 was the only source to show new and compelling evidence of such variability. All other instances of strong short-term variability uncovered by this search had already been noted by investigators, connected with previously-known AGN 111The gamma-ray variability of 3EG J0433+2910 led to its identification as a BL Lac object (Lundgren et al. 1995; Wallace et al. 2001) but its flux variation was not on a short time scale., and duly reported (e.g., Mukherjee et al. 1996; Mattox et al. 1997a; McGlynn et al. 1997). The point to make about 3EG J2006–2321 is not that its 5-GHz flux is so low, but that its gamma-ray variability was strong enough for it to be picked out by EGRET. There are probably other blazars with mJy near EGRET’s threshold of detection, but no other happened to flare so dramatically while in the EGRET field of view. (Calculating the probability of detecting a flare from such a near-threshold EGRET blazar is not practical. Even if one assumed that all unidentified sources are AGN whose variations were not detected in Wallace et al. (2000) and that the population of known EGRET blazars is a good model, the uncertainties inherent in such a calculation would render the result meaningless.) Although a strongly variable flux from a gamma-ray source indicates a probable blazar identification, the reverse not true; that is, not all blazars are indicated in the EGRET data by strongly variable flux (McLaughlin et al. 1996). This point is especially relevant for high-latitude sources, since they received, on average, less exposure to EGRET than sources near the Galactic plane (H99), and are less likely to be observed to be variable. We emphasize that the EGRET data do not rule out the possibility that many unidentified sources with are blazars similar to 3EG J2006–2321, with mJy.
Of course, there are other possibilities. There is evidence that a population of dim unidentified sources at low and middle latitudes is associated with the Gould Belt (Gehrels et al. 2000), which reaches a maximum of 30∘ above the Galactic center. There may be some “stragglers” from the Belt at latitudes higher than this, but even if this is the case the number of such sources must be small. Galaxy clusters may be responsible for a very small number of unidentified EGRET sources at high latitudes (Colafrancesco et al. 2001) but any high-energy gamma-ray emission from such clusters probably falls below EGRET’s sensitivity (Reimer & Sreekumar 2001b). It is also possible that the Galactic halo houses some of the persistent EGRET sources (Grenier et al. 2001), but to date this is only a conjecture. It remains that the only identified gamma-ray sources above 30 degrees Galactic latitude are blazars with flat-spectrum radio counterparts, and we suggest that there are others among the 30 unidentified sources with .
The present case brings to mind weaknesses in standard identification methods that prevent these blazars from being identified. These weaknesses cannot be easily overcome, as they are manifestations of insufficient data and theory; however, it is important to be reminded of them. It is common practice (Thompson et al. 1995; H99) to use 5-GHz sources in the selection of radio counterparts. Specifically, radio sources that are loud ( Jy) and flat () at this frequency have been considered to be top candidates for association with EGRET AGN. There are two weaknesses to this approach worth mentioning here. First, in general it does not easily work for dim ( mJy) radio sources, because the sky density of such sources is high and source confusion becomes a problem, especially for weak EGRET sources with large error circles. In the present work we were forced to look at weak 5-GHz sources that were not considered in the original identification process; because of the low number of 5-GHz candidates we are able to determine the appropriate counterpart. Also, as Bloom & Dale (2001) have noted, the use of this frequency to establish the loud, flat-spectrum nature of radio counterparts to gamma-ray AGN has no truly compelling physical justification but is a necessity; there are no complete radio surveys at higher frequencies with sensitivity below Jy. Indeed, 3EG J0743+5447 ( mJy) is representative of a small group of EGRET blazars that are fairly dim and fairly flat at 5 GHz but have been found to have brighter and flatter spectra extending beyond 200 GHz (Bloom et al. 1997); 3EG J2006–2321 may be similar.
Other, more sophisticated means of identifying EGRET sources with flat-spectrum radio sources have been tried. In the most recent of these, Mattox, Hartman, & Reimer (2001b) searched for potential radio counterparts to all sources listed in H99, allowing for sources with arbitrarily low . Their approach is a quantitative one; for a given radio source and a given EGRET source the probability of association is calculated, taking into account certain properties of the radio source. Among these properties are the 5-GHz flux density, the spectral index (when available) near 5 GHz, the angular separation from the EGRET position, and the sky density of sources at least as bright and flat as the one in question. The researchers list 46 blazar identifications with a “high probability” of being correct, and 37 additional radio associations that are considered to be “plausible”. The former list includes no unidentified sources and the latter includes 15 unidentified sources, none of which are in the region . This does not mean that there are no blazars among this group; by their generic calculation 3EG J2006–2321 does not meet the criteria for either list.222However, 3EG J2006–2321 is included on the “plausible” list in light of its gamma-ray variability, which is not factored into their standard calculation. A radio source must have a probability of association with the gamma-ray source to be included among the plausible associations. The probability of association of PMN J2005–2310 with 3EG J2006–2321 was calculated to be 0.015, and the four “high-probability” blazars with Jy have more than 10 times the probability of being associated with their radio counterparts than does 3EG J2006–2321 with PMN J2005–2310. As mentioned above, high-latitude sources are the most likely to be indentifiable as blazars; it is worth noting that if any of these 30 sources are blazars, and it seems likely that some should be, the method of Mattox et al. (2001b) is not helpful for indicating them. Stated another way, although this method may not prove that a particular blazar is the true identification with high confidence, that does not mean that such an identification is false with high confidence.
The question should be asked: is it possible to make associations of non-variable EGRET sources with weak 5-GHz radio counterparts? If so, new search methods must be used. High-latitude sources are the most likely to be identified as blazars and have the easiest error circles to search because in the region the sky densities of gamma-ray sources and potential radio counterparts are low, and because in this region the diffuse Galactic gamma radiation does not wash out source photons. Careful searches for blazars within high-latitude EGRET error circles may be helpful for pointing out likely identifications, and cases in which no blazar can be found within the error circle would be interesting. Such work has already begun; Bloom & Dale (2001) have searched the error circles of some high-latitude unidentified sources and are in the process of monitoring optical counterparts of relevant flat-spectrum radio sources. Their candidate radio counterparts have 5-GHz flux densities between 33 mJy and 440 mJy. Optical spectroscopy is planned for some of these sources. Similar work on other sources is encouraged. The present work should embolden such investigations as it provides additional evidence that EGRET has detected blazars with radio properties similar to those for which they are searching.
8 Conclusion
From analysis of archived radio, X-ray, and gamma-ray data and our own optical spectroscopy and polarimetry, we conclude that 3EG J2006-2321 is a member of the blazar class of AGN. This identification is interesting because it is a reminder that EGRET is capable of detecting blazars with on the order of a fourth of a Jansky. The remaining EGRET unidentified sources most likely to be identified as blazars are in the region . Further searches for possible radio and optical counterparts within the error circles of the 30 unidentified sources in this region are encouraged.
While the present analysis is sufficient to identify 3EG J2006–2321, little more can be said about the source, and no conclusions are reached regarding beaming and radiation mechanisms of gamma-ray-bright AGN. Complete and simultaneous multiwavelength observations are needed to constrain blazar models. The Gamma-ray Large Area Space Telescope (GLAST), scheduled for launch in 2006, is expected to uncover thousands of gamma-ray blazars and other high-energy sources; however, in order to realize a full return of GLAST science, these sources must be observed not just in gamma rays, but across the electromagnetic spectrum.
| Object | Date | Exp | P | ||
|---|---|---|---|---|---|
| (UT) | (min) | % | % | (deg) | |
| PMN J2005–2310 | 2000 Aug 5 | 13.8 | 2.3 | 58 | |
| 2001 Jun 15 | 4.8 | 3.4 | 35 | ||
| Field Stars | 2000 Aug 5 | 1.465 | 0.013 | 20.4 | |
| 2001 Jun 15 | 1.492 | 0.016 | 22.1 |
References
- Bloom, S. D. & Dale, D. A. (2001) Bloom, S. D. & Dale, D. A. 2001, in AIP Conf. Proc. 587, Gamma 2001, eds. S. Ritz, N. Gehrels, & C. R. Schrader (Melville, NY: AIP), 329
- Colafrancesco et al. (2001) Colafrancesco, S. 2001, in AIP Conf. Proc. 587, Gamma 2001, eds. S. Ritz, N. Gehrels, & C. R. Schrader (Melville, NY: AIP), 427
- Condon, J. J. et al. (1998) Condon, J. J., Cotton, W. D., Greisen, E. W., Yin, Q. F., Perley, R. A., Taylor, G. B., & Broderick, J. J. 1998, AJ, 115, 1693
- Douglas, J. N. et al. (1996) Douglas, J. N., Bash, F. N., Bozyan, F. A., Torrence, G. W., & Wolfe, C. 1996, AJ, 111, 1945
- Esposito et al. (1996) Esposito, J. A., Hunter, S. D., Kanbach, G., & Sreekumar 1996, ApJ, 461, 820
- Fichtel, C. E. et al. (1975) Fichtel, C. E., Hartman, R. C., Kniffen, D. A., Thompson, D. J., Ogelman, H., Ozel, M. E., Turner, T., & Bignami, G. F. 1975, ApJ, 198, 163
- Freedman, W. L. et al. (2001) Freedman, W. L. et al. 2001, ApJ, 553, 47
- Gehrels et al. (2000) Gehrels, N., Macomb, D. J., Bertsch, D. L., Thompson, D. J., & Hartman, R. C. 2000, Nature, 404, 363
- Grenier, I. et al. (2001) Grenier, I. et al. 2001, in AIP Conf. Proc. 587, Gamma 2001, eds. S. Ritz, N. Gehrels, & C. R. Schrader (Melville, NY: AIP), 649
- Griffith, M. R. & Wright, A. E. (1993) Griffith, M. R. & Wright, A. E. 1993, AJ, 105, 1666
- Halpern et al. (2001) Halpern, J. P., Camilo, F., Gotthelf, E. V., Helfand, D. J., Kramer, M., Lyne, A. G., Leighly, K. M., & Eracleous, M. 2001, ApJ, 552, L125
- Hartman et al. (1999) Hartman, R. C. et al. 1999, ApJS, 123, 79
- Kaaret, P. & Cottam, J. (1995) Kaaret, P. & Cottam, J. 1995, ApJ, 462L, 35
- Kay et al. (1999) Kay, L.E., Magalhães, A. M., Elizalde, F., & Rodrigues, C.V. 1999, ApJ, 518, 210
- Lundgren et al. (1995) Lundgren, S. C. et al. 1995, IAU Circular 6258
- Magalhães, Benedetti & Roland (1984) Magalhães, A. M., Benedetti, E., & Roland, E. 1984, PASP, 96, 384
- Magalhães et al. (1996) Magalhães, A. M., Rodrigues, C. V., Margoniner, V. E., & Pereyra, A. 1996, ASP Conf. Ser. 97 (W. G. Roberge and D. C. B. Whittet eds.), p. 118
- Mattox et al. (1997a) Mattox, J. R., Wagner, S. J., Malkan, M., McGlynn, T. A., Schachter, J. F., Grove, J. E., Johnson, W. N., & Kurfess, J. D. 1997a, ApJ, 476, 692
- Mattox et al. (1997b) Mattox, J. R., Schachter, J. Molnar, L., Hartman, R. C., & Patnaik, A. R. 1997b, ApJ, 481, 95
- Mattox et al. (2001a) Mattox, J. R., Hallum, J. C., Marscher, A. P., Jorstad, S. G., Waltman, E. B., Teräsranta, H., Aller, H. D., & Aller, M. F. 2001a, ApJ, 549, 906
- Mattox et al. (2001b) Mattox, J. R., Hartman, R. C., & Reimer, O. 2001b, ApJS, 135, 155
- Mirabel et al. (2000) Mirabel, N., Halpern. J. P., Eracleous, M., & Becker, R. H. 2000, ApJ, 541, 180
- Mirabel & Halpern (2001) Mirabel, N. & Halpern, J. P. 2001, ApJ, 547, L137
- McGlynn et al. (1997) McGlynn, T. A. et al. 1997, ApJ, 481, 625
- McLaughlin et al. (1996) McLaughlin, M. A., Mattox, J. R., Cordes, J. M., & Thompson, D. J. 1996, ApJ, 473, 763
- Mukherjee et al. (1996) Mukherjee, R. et al. 1996, ApJ, 470, 831
- Mukherjee et al. (2001) Mukherjee, R., Gotthelf, E. V., Halpern, J. P., & Tavani, M. 2000, ApJ, 542, 740
- Pereyra (2000) Pereyra, A. 2000, PhD Thesis, IAG-USP
- Perlmutter et al. (1999) Perlmutter, S. et al. 1999, ApJ, 517, 565
- e.g., Pesce et al. (1997) Pesce, J. E. et al. 1997, ApJ, 486, 770
- Ramanamurthy et al. (1997) Ramanamurthy, P. V. et al. 1995, ApJ, 450, 791
- Reimer et al. (2001a) Reimer, O., Brazier, K. T. S., Carramiñana, A., Kanbach, G., Nolan, P. L., and Thompson, D. J. 2001a, MNRAS 324, 772
- Reimer et al. (2001b) Reimer, O. & Sreekumar, P. 2001b, in AIP Conf. Proc. 587, Gamma 2001, eds. S. Ritz, N. Gehrels, & C. R. Schrader (Melville, NY: AIP), 422
- Romero et al. (1999) Romero, G. E., Benaglia, P., & Torres, D. F. 1999, A&A, 348, 868
- Schlegel et al. (1998) Schlegel, D. J., Finkbeiner, D. P., & Davis, M. 1998, ApJ, 500, 525
- Serkowski et al. (1975) Serkowski, K., Mathewson, D.S. & Ford, V.L., ApJ, 196, 261
- Sturner & Dermer (1995) Sturner, S. J. & Dermer, C. D. 1995, A&A, 293L, 17
- Voges et al. (1999) Voges, W. et al. 1999, A&A, 349, 389
- Voges et al. (2000) Voges, W. et al. 2000, IAU Circular 7432
- von Montigny et al. (1995) von Montigny et al. 1995, ApJ, 440, 525
- Thompson et al. (1995) Thompson, D. J. et al. 1995, ApJS, 86, 629
- Turnshek et al. (1990) Turnshek, D. A., Bohlin, R. C., Williamson II, R. L., Lupie, O. L., Koornneef, J., & Morgan, D. H. 1990, AJ, 99, 1243
- Wallace et al. (2000) Wallace, P. M., Griffis, N. J., Bertsch, D. L., Hartman, R. C., Thompson, D. J., Kniffen, D. A., & Bloom, S. D. 2000, ApJ, 540, 184
- Wallace et al. (2001) Wallace, P. M., Eracleous, M., Foreman, J. V., Halpern, J. P., Reimer, O., & Thompson, D. J. 2001, in AIP Conf. Proc. 587, Gamma 2001, eds. S. Ritz, N. Gehrels, & C. R. Schrader (Melville, NY: AIP), 319