Detection of a high frequency break in the X-ray power spectrum of Ark 564
We present a power spectrum analysis of the long ASCA observation of Ark 564 in June/July 2001. The observed power spectrum covers a frequency range of decades. We detect a high frequency break at Hz. The power spectrum has an rms of and a slope of and below and above the break frequency. When combined with the results from a long RXTE observation (Pounds et al. 2001), the observed power spectra of Ark 564 and Cyg X-1 (in the low/hard state) are almost identical, showing a similar shape and rms amplitude. However, the ratio of the high frequency breaks is very small (), implying that these characteristic frequencies are not indicative of the black hole mass. This result supports the idea of a small black hole mass/high accretion rate in Ark 564 .
Key Words.:
Galaxies: active — Galaxies: Seyfert — Galaxies: individual: Ark 564 — X-rays: galaxies1 Introduction
Narrow-line Seyfert 1 (NLS1) galaxies are a peculiar group of active galactic nuclei (AGN) characterized by their distinct optical line properties (Osterbrock & Pogge 1985). In hard X-ray studies NLS1 galaxies comprise less than 10% of the Seyfert galaxies, however, from the ROSAT All-Sky Survey it became clear that about half of the AGN in soft X-ray selected samples are NLS1 galaxies (Grupe 1996, Hasinger 1997). Boller et al. (1996) found from ROSAT observations that the soft X-ray spectra of NLS1 galaxies are systematically steeper than those of broad line Seyfert 1 galaxies. They further discovered that NLS1 galaxies frequently show rapid short time scale X-ray variability which can be interpreted as evidence for a small black hole masses in these objects.
Ark 564 is the X-ray brightest NLS1 galaxy with a 210 keV flux of erg cm-2 s-1(Vaughan et al. 1999) and shows large amplitude variations on short time scales (Leighly 1999). Therefore it is the best candidate to study its X-ray variability in order to obtain important clues about the size of the black hole mass and the accretion rate in NLS1 galaxies. Recently, Ark 564 was observed by RXTE once every days from January 1999 to September 2000 covering months of data. Its keV power spectral density (PSD) function showed a cut–off at a frequency which corresponds to a time scale of days (Pounds et al. 2001). Ark 564 was also observed for a period of days in June/July 2000 by ASCA . This observation was part of a multi-wavelength AGN Watch monitoring campaign (Turner et al. 2001). The flux variations that Ark 564 exhibited during this observation have already been studied by Edelson et al. (2001) who found that the variability amplitude is almost independent of energy band and the power spectrum is harder in the hardest energy bands. There were no delays between the variations in the different bands and no signs of non-linear behaviour in the light curves. Gliozzi et al. (2001) also found no sign of non-linear behaviour and no statistically significant indication of non-stationarity in the light curves. Furthermore, using nonlinear techniques they were able to demonstrate that the source behaves differently in the high and low flux states.
In this work we present a timing analysis of the June-July ASCA observation of Ark 564 based on power spectral analysis techniques. In the following section we present the data and the results from the PSD analysis while in Section 3 we discuss our conclusions.
2 Data Analysis
ASCA observed Ark 564 from 2000 June 01 11:51:27 to 2000 July 05 23:57:54 (UT). We extracted the X-ray data from the public archive at ISAS and applied standard criteria for the data analysis in order to create light curves for all four instruments. Details of the data reduction process are given in Brinkmann et al. (2001).
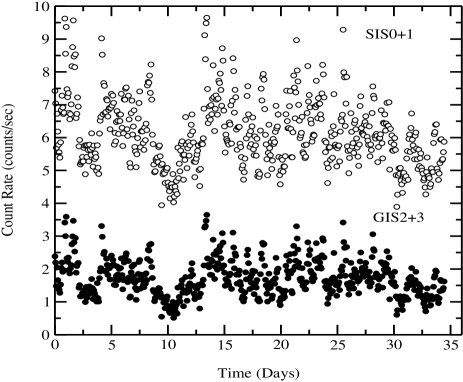
Light curves were extracted in the energy bands 0.7–5 keV, 0.7–2 keV (soft band), 2–5 keV (medium band) and 5–10 keV (hard band) for both instruments. In all cases we combined the data from the SIS and GIS detector pairs. Figure 1 shows the SIS0+1 and GIS2+3 0.7–5 keV light curves in 5400 s bins ( the ASCA orbital period). Clearly, the source is significantly variable. The root mean square variability amplitude (corrected for the experimental noise) is and for the soft, medium and hard band light curves, respectively.
2.1 Power Spectrum Analysis
We used the 0.7–5 keV GIS and SIS light curves (which have the highest signal to noise ratio) to estimate the overall X-ray PSD of Ark 564 . First, we used the 16 sec binned SIS and GIS light curves to compute the high frequency part of the PSD (i.e. the PSD at frequencies Hz). There are 476 and 531 segments in the SIS and GIS light curves, respectively, with no gaps in them. Their duration is between and 3500 sec. For each part we computed the periodogram and normalised it to the square of the mean count rate. Then, we combined all the periodograms in one file, we sorted them in order of increasing frequency, we computed their logarithm and grouped them into bins of size following the method of Papadakis & Lawrence (1993). To compute the PSD at low frequencies (i.e. Hz) we used the 5400 sec binned light curves. The use of the approximate ASCA orbital period as the bin size results in an evenly sampled light curve with very few missing points (10 and 8 out of 552 in the GIS and SIS light curves, respectively). We accounted for them using linear interpolation between the bins adjacent to the gaps. We computed the periodograms, and averaged their logarithm using a bin size of 20.
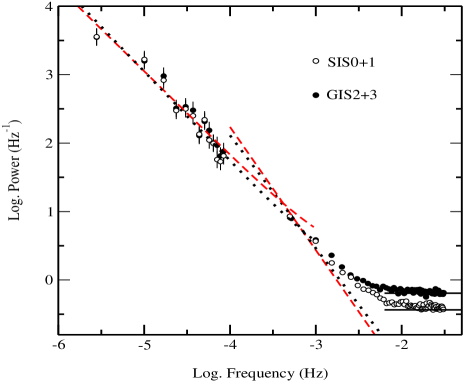
The low and high frequency PSDs of the SIS and GIS light curves are shown in Figure 2. The SIS and GIS power spectra look similar. Using standard statistics we fitted a power law model of the form , separately to the high and low frequency part of the PSDs (we denote with and the slope of the low and high frequency parts respectively). The constant represents the contribution of the experimental Poisson noise process to the observed PSD. It can be estimated using the average error of the points in each light curve (e.g. Papadakis & Lawrence 1995) and, as a result, was kept fixed at its expected value (shown with solid lines in Figure 2 for the high frequency power spectra) during the model fitting procedure. The best fitting results are listed in Table 1 and the best fitting models are plotted in Figure 2 (dotted and dashed lines for the SIS and GIS power spectra, respectively). All errors quoted in this paper correspond to the confidence region and were computed following the method of Lampton et al. (1976).
The best fitting slope values of the SIS and GIS power spectra are consistent within their errors ( and ). Therefore, despite the slight difference in the responses of the detectors on board ASCA , the power spectra of the GIS and SIS light curves are indeed similar. The weighted mean and values are and , respectively. Their difference, , shows that the low and high frequency parts of the power spectra have significantly different slopes. As Figure 2 shows, the slope of the PSD changes at Hz. Above that frequency, the slope is significantly steeper than the slope at lower frequencies.
| /dof | /dof | |||
|---|---|---|---|---|
| SIS0+1 | 15.6/11 | 78/57 | ||
| GIS2+3 | 13.2/11 | 106/59 |
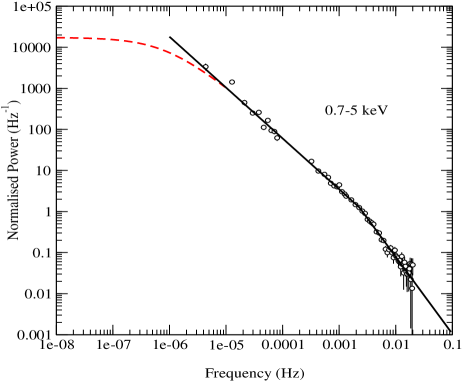
Since the SIS and GIS power spectra are similar, we combined them to produce the final, 0.7–5 keV PSD of Ark 564 . The resulting power spectrum (with the Poisson noise subtracted) is shown in Figure 3. We have grouped the combined GIS and SIS periodograms into bins of size 200, 600 and 1000 for the high frequency part of the spectrum (the bin size is increased towards the higher frequencies in order to increase the signal to noise) and into bins of size 50 for the low frequency part. A simple power law model cannot fit the PSD well ( for 58 dof). For that reason, we used a “broken power law” model. According to this model, the low frequency part of the PSD is fit to a function of the form and, above a “break frequency” , the PSD is fitted to a power law with a different index, . The fit results are listed in Table 2; the best fit model is plotted in Figure 3 (solid line). Compared to the simple power law model, a broken power law provides a significantly better fit to the data. The PSD of Ark 564 has a slope at frequencies up to Hz above which the PSD steepens to a slope of .
Finally, we investigated whether the PSD parameters depend on energy. We used the 0.7–2 keV, 2–5 keV and 5-10 keV light curves to compute the power spectra in the three bands. A power law model cannot fit the soft and medium band PSDs ( and 157 for 66 and 53 dof, respectively). The broken power law model gives a significantly better fit to these power spectra. The hard band PSD cannot be computed for frequencies higher than a few Hz due to the low signal to noise of the -sec hard band light curves; therefore the simple power law model gives already an acceptable fit to the PSD in this case. The best fitting results for the power law (for the hard band PSD) and broken power law models (for the soft and medium band PSDs) are listed in Table 2. The model parameters of the soft and medium energy PSDs are consistent within the errors, except from . Our results show that the low frequency PSDs become significantly harder with increasing energy. This is in agreement with the results of Edelson et al. (2001).
| Energy | /dof | |||
| Hz) | ||||
| 0.7–5 keV | 72.6/56 | |||
| 0.7–2 keV | 84.1/64 | |||
| 2–5 keV | 84.1/51 | |||
| 5–10 keV | – | – | 52.9/31 |
3 Discussion
Using the ASCA June-July 2001 observation of Ark 564 we have estimated its power spectrum over a frequency range of decades. We have detected a high frequency break at Hz.
In Figure 3, together with the keV PSD, we have also plotted the best fitting “cut-off power law” model from Pounds et al. (2001). The observed PSD of Ark 564 extends over decades in frequency. It is clear from this Figure that the PSD starts to flatten below Hz, showing a second, low frequency break. MCG 6-30-15 also shows two break frequencies in its PSD (Nowak & Chiang 2000), however, the evidence for the low frequency break is not significant in that case (Uttley et al. 2001). Therefore, Ark 564 is probably the only Seyfert galaxy for which we are certain that the observed PSD has a shape that is almost identical to the shape of the Cyg X-1 PSD in the low/hard state. In both cases, the PSD slope is flat below a characteristic low frequency. Above this frequency the PSD steepens to and then becomes above a second break frequency. Apart from the PSD shape, the rms amplitudes at frequencies higher than the low frequency cut off are also very similar. These results show that Ark 564 corresponds to the low/hard (instead of the high/soft) state of the Galactic black hole candidates (GBHC).
However, despite this similarity, Ark 564 is not simply a “larger” version of GBHCs. The two break frequencies in Cyg X-1 are located between and Hz (e.g. Nowak et al. 1999, Negoro et al. 2001). The ratio between the characteristic frequencies in Ark 564 and Cyg X-1 is therefore and , if we consider the low and high frequency breaks, respectively. Although there is an uncertainty associated with these ratios (for example, we do not know whether the break frequencies in AGN are constant or change with time) this cannot probably explain the two orders of magnitude difference between the ratios. Perhaps then the break frequencies do not scale proportionally with the black hole mass. For example, if the high frequency break in Cyg X-1 corresponds to the Keplerian orbital period at around the central object (Nowak et al. 1999; is the Schwarzschild radius) and the high frequency break in Ark 564 corresponds to the same time scale but at a radius , then the ratio of the characteristic time scales will not be equal to the mass ratio but to the mass ratio .
On the other hand, if the low frequency breaks scale with mass, then the central black hole mass of Ark 564 should be M⊙, assuming that the black hole in Cyg X-1 is M⊙ (Herrero et al. 1995). If that is the case, taking into account the luminosity of Ark 564 , Pounds et al. (2001) concluded that the source is accreting at a substantial fraction of the Eddington limit. The orbital period at for a M⊙ black hole is sec, which is an order of magnitude larger than the time scale which corresponds to the high frequency break in the PSD of Ark 564 . Either the mass of the black hole in Ark 564 is smaller than M⊙ (in which case the accretion rate is larger than the Eddington limit), or due to the large accretion rate, the characteristic time scales are smaller. When the accretion rate approaches the Eddington limit advective energy transport dominates over radiative cooling and the disk becomes moderately geometrically thick, a so called “slim disk” (Abramowicz et al. 1988). In this case, a substantial amount of radiation can be produced from inside the last stable orbit, i.e. (Mineshige et al. 2000). The free-fall time scale at distance is given by M sec (Rees 1984), where M8 is the mass in units of M⊙ and is the gravitational radius. For M and , we get sec which is comparable to that we find for Ark 564 . The sound crossing time scale is another possible candidate that could correspond to . In the thin disk case this time scale is very long even in the innermost parts of the disk. However, when the accretion rate is comparable to the Eddington rate and the disk is dominated by radiation pressure, the group velocity of sound waves (responsible for transmitting density fluctuation information) becomes very large (e.g. Krolik et al. 1991). Consequently, the sound crossing time scale at say will be decreased substantially and could be of the order of .
We conclude that, the similarity of the PSD and time lags in Ark 564 implies that X-rays in this source are produced by a mechanism similar to the X-ray emission mechanism in Cyg X-1 in its low/hard state. On the other hand, the comparison between the characteristic time scales in the two systems suggests that at least one physical parameter is different in them, probably the accretion rate, with Ark 564 having a substantially higher accretion rate than Cyg X-1 in its low/hard state.
Acknowledgements.
Part of this work was done in the TMR research network ’Accretion onto black holes, compact stars and protostars’ funded by the European Commission under contract number ERBFMRX-CT98-0195.References
- (1) Abramowicz, M.A., Czerny, B., Lasota, J.P., Szuszkiewicz, E. 1988, ApJ, 332, 646
- (2) Boller, T., Brandt, W.N., Fink, H. 1996, A&A, 305, 53
- (3) Brinkmann, W., Papadakis, I.E., Negoro, H., Detsis, E., Papamastorakis, I., Gliozzi, M., Scheingraber, H. 2001, in Proc. Maxi Workshop on AGN variability, in press
- (4) Gliozzi, M., Brinkmann, W., Räth C., Papadakis, I.E., Negoro, H., Scheingraber, H. 2001, A&A, submitted
- (5) Edelson, R., Turner, T.J., Pounds, K., Vaughan, S., Markowitz, A., Marshall, H., Dobbie, P., Warwick, R. 2001, ApJ, in press
- (6) Grupe, D. 1996, PhD thesis, Univ. Göttingen
- (7) Hasinger, G. 1997, in Imaging and Spectroscopy of Cosmic Hot Plasmas, ed. F. Makino, & K. Mitsuda (UAP, Tokyo), 263
- (8) Herrero, A., Kudritzki, R.P., Gabler, R., Vilchez, J.M., Gabler, A. 1995, A&A, 297, 556
- (9) Krolik, J.H., Horne, K., Kallman, T.R., Malkan, M.A., Edelson, R.A., Kriss, G. A. 1991, ApJ, 371, 541
- (10) Lampton, M., Margon, B., Bowyer, S. 1976, ApJ, 208, 177
- (11) Leighly, K.M. 1999, ApJS, 125, 297
- (12) Mineshige, S., Kawaguchi, T., Takeuchi, M., Hayashida, K. 2000, PASJ, 52, 499
- (13) Negoro, H., Kitamoto, S., Mineshige, S. 2001, ApJ, 554, 528
- (14) Nowak, M.A., Vaughan, B.A., Wilms, J., Dove, J.B., Begelman, M. 1999, ApJ, 510, 874
- (15) Nowak, M.A., Chiang, J. 2000, ApJ, 531, L13
- (16) Osterbrock, D.E., Pogge, R.W. 1985, ApJ, 297, 166
- (17) Papadakis, I.E, Lawrence, A. 1993, MNRAS, 261, 612
- (18) Papadakis, I.E., Lawrence, A. 1995, MNRAS, 272, 161
- (19) Pounds, K., Edelson, R., Markowitz, A., Vaughan, S. 2001, ApJ 550, L15
- (20) Rees, M.J. 1984, ARA&A, 22, 471
- (21) Turner, T.J., Romano, P., George, I.M., Edelson, R., Collier, S.J., Mathur, S., Peterson, B.M. 2001, ApJ, 561, 131
- (22) Uttley, P., McHardy, I.M., Papadakis, I.E. 2001, MNRAS, submitted
- (23) Vaughan, S., Reeves, J., Warwick, R., Edelson, R. 1999, MNRAS 309, 113