email: rmennick@stars.cfm.udec.cl 22institutetext: Observatorio Astronomico Nacional, Instituto de Astronomia, UNAM, 22860 Ensenada, Mexico 33institutetext: Astrophysical Institute Potsdam, An der Sternwarte 16, 14482 Potsdam, Germany 44institutetext: Universitats-Sternwarte, Geismarlandstr. 11, 37083, Gottingen, Germany 55institutetext: Braeside Observatory, PO Box 906, Flagstaff, AZ 86002, USA
On the secondary star of the cataclysmic variable 1RXS J094432.1+035738
We present and -band photometry and optical near-infrared spectroscopy of the cataclysmic variable 1RXS J094432.1+035738. We detected features of a cool secondary star, which can be modeled with a red dwarf of spectral type M2 V at a distance of 433 100 pc.
Key Words.:
Stars: individual: 1RXS J094432.1+035738, binaries: novae, cataclysmic variables, Stars: fundamental parameters, Stars: evolution, binaries: general1 Introduction
The optical counterpart of the ROSAT source 1RXS J094432.1+035738 was identified as a cataclysmic variable (CV) in the course of follow-up observations of CV candidates from the Hamburg Quasar Survey (Jiang et al. 2000). These authors presented a spectrum showing Balmer and He I emission, typical of a cataclysmic variable star (Warner 1995). Two outbursts have been observed and recorded by observers in January 2001 and June 2001 (http://www.kusastro.kyoto-u.ac.jp/vsnet/), suggesting a dwarf nova nature for the variable. While writing this paper, we were informed that Thorstensen & Fenton found an orbital period of 0.1492 0.0004 d for this object (vsnet-alert 5988, Thorstensen, private communication). Here we present a detailed analysis of the spectrum of this target, including the first detection of the secondary star, the analysis of the radial velocity of the H emission line and a refinement of the orbital period.
2 Observations and data reduction
2.1 Optical photometry
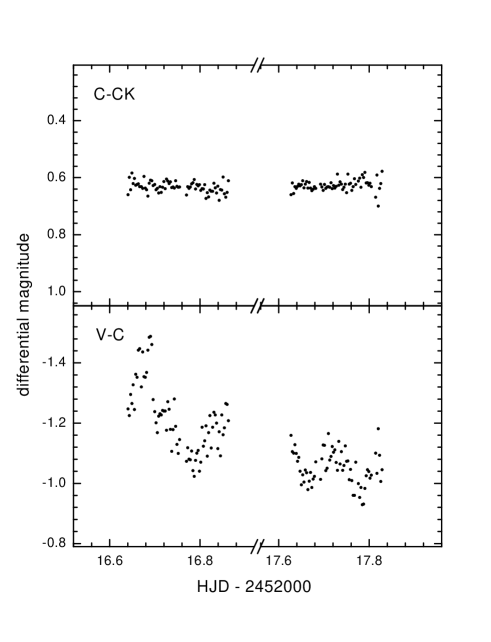
We obtained differential photometry of 1RXS J094432.1+035738 at Braeside Observatory, Arizona, using a 41 cm reflector equipped with a SITe 512 CCD camera, during the nights of March 11 and 12, 2000 (UT). We also obtained -band time-resolved photometry during two nights in April 17-18, 2001 (UT) at the 1.5m telescope of the Observatorio Astronomico Nacional de San Pedro Martir (OAN SPM), Baja California, Mexico. This telescope was equipped with a pixel SITe CCD. The images were corrected for bias and flat field. For the observations of April, 2001, aperture differential photometry was carried out using the comparison star located at = 09:44:27.25 and = 03:58:09.9 and the check star located at = 09:44:26.45 and = 03:57:42.7. An estimate of the uncertainty of the CCD photometry was obtained from the standard deviation of the differential light curve between comparison and check star, viz. 0.02 mag. Since comparison and check star are slightly fainter than the variable, the photometric error in this case is dominated by the fainter star (i.e. the check star) and the above figure is an upper limit for the uncertainty of the variable minus comparison light curve (e.g. Howell et al. 1988). We did not obtain an absolute calibration for our photometric dataset obtained at San Pedro Martir. However, for the observations carried out at Braeside Observatory, we obtained magnitudes of 1RXS J094432.1+035738 relative to the comparison star GSC0023900958.
2.2 Spectrophotometric observations
The spectrophotometric observations were conducted at the 2.12 m telescope of the Observatorio Astronomico Nacional, San Pedro Martir, Mexico, during April 12, 2000 (UT), and at the 1.54 Danish Telescope of La Silla European Southern Observatory, on May 29/30, 2000 (UT). Standard IRAF tasks were used for flat field correction, bias subtraction, cosmic ray removal, extraction and wavelength-flux calibration.
We used the Boller & Chivens spectrograph installed in the Cassegrain focus of the 2.12 m telescope at OAN SPM. The 300 lines/mm grating was used to cover a wavelength range from 3700 to 7600 Å. The TEK pixel CCD with a m pixel size was attached to the spectrograph.
The Danish Faint Object Spectrograph and Camera (DFOSC) was used with grisms 5 and 7 at the Danish telescope in Chile, yielding a combined wavelength range of 3500–9500 Å. A slit width of 1.5 arcseconds was chosen in order to match the typical point spread function at the focal plane of the telescope. This resulted in spectral resolutions of 4 Å (grism 7) and 7.5 Å (grism 5). The journal of observations is given in Table 1.
In general, the wavelength calibration functions were constructed with 40 He-Ne lines and had typical of 0.1 Å (5 km s-1 at H).
Spectrophotometric standard stars (Feige 34 and HZ 44 in OAN SPM and LTT 3864 and LTT 7987 in La Silla, Hamuy et al. (1992), Hamuy et al. (1994)) were observed in order to perform flux calibration. To minimize slit losses and improve flux calibration, a wide slit was used for standards stars (5″) while the slit for all objects was aligned along the paralactic angle. The atmospheric absorption bands were removed from the spectra using the ”telluric” IRAF task. For that we used a template obtained by normalizing the standard star spectrum to the continuum, and interpolating the resulting spectrum between the hydrogen absorption lines intrinsic to the early spectral type.
| Tel. | Grating | Res. (Å) | HJD | N |
|---|---|---|---|---|
| 2.12m/SPM | 300 l/mm | 8.0 | 45.6676-7395 | 11 |
| 1.54m/ESO | #5 | 7.5 | 94.5003-5759 | 6 |
| 1.54m/ESO | #7 | 4.0 | 95.4913-5675 | 17 |
| Line | EW | flux |
|---|---|---|
| H10 | N/A | 2.1 |
| H9/He I 3828 | -9 | 2.2 |
| H8 | -20 | 2.4 |
| H 3963 | -37 | 2.7 |
| He I 4023 | -5 | 1.1 |
| H | -65 | 2.8 |
| H | -70 | 3.0 |
| He I 4388 | -4 | 0.9 |
| He I 4471 | -15 | 1.4 |
| He II 4685 / He I 4713 | -11 | 1.0 |
| H | -72 | 3.1 |
| He I 4920 | -8 | 1.0 |
| He I 5015 | -4 | 1.0 |
| He I 5875 | -14 | 1.5 |
| H | -65 | 3.1 |
| He I 6678 | -8 | 1.2 |
| He I 7065 | -8 | 1.1 |
| H I 8863 | -5 | N/A |
| H I 9014 | -9 | N/A |
| H I 9229 | -13 | N/A |
3 Results
3.1 Photometry
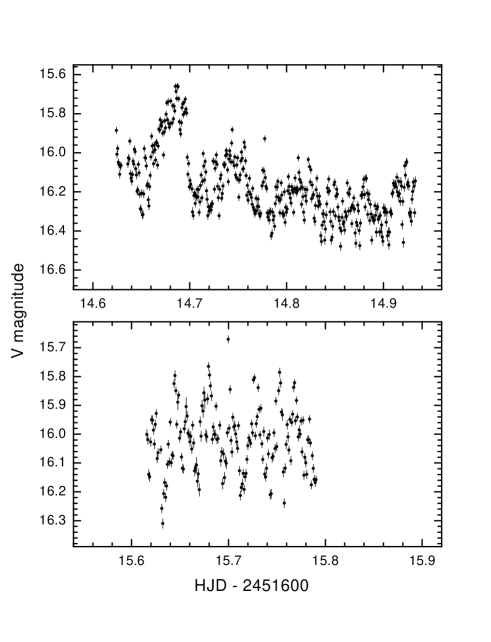
Figs. 1 and 2 show the light curves of 1RXS J094432.1+035738. From these figures, the remarkable variability of this star is evident. The upper panel of Fig. 1 reveals non-coherent variability with amplitude 0.4 mag and peak-to-peak time scales of 1 hour, whereas the following night a complex behaviour is seen; a long-term oscillation with a time scale of 1.7 hours over a long-term fading and flickering in time scales longer than 10 minutes. Regarding the data taken in San Pedro Martir Observatory (Fig. 2), discarding the data previous to the maximum at 2 452 016.6905, and shifting the remaining data to a common nightly mean, we find a good model with a sinusoid with a period of 0.111 0.005 days (2.66 0.12 h). A frequency analysis of the whole dataset did not yield any conclusive periodicity.
3.2 Spectrum description and radial velocities
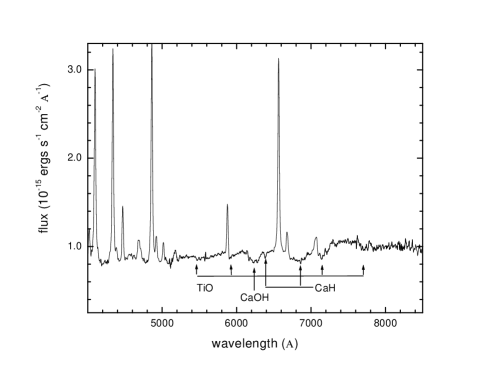
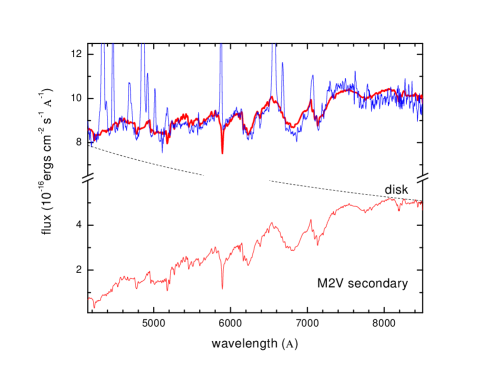
Our averaged spectrum shown in Fig. 3 reveals a rather flat continuum reaching a maximum around 7500 Å and decreasing to longer wavelengths. Balmer, Paschen (not shown in Fig. 3 since the flux calibration at these wavelengths is not reliable) and He I emission lines are also present. At our resolution, these lines are single peaked and the Balmer decrement rather flat. From the spectrum we derived spectrophotometric magnitudes of V = 16.7 0.1 for April 2000 and V = 16.4 0.1 for May 2000, including correction factors by slit looses derived for the finite slit width. The above figures indicate that the object was observed in quiescence in both observing sessions. Contrasting with the spectrum shown by Jiang et al. (2000), we observe the TiO absorption bands typical of M type stars.
We give in Table 1 the fluxes and equivalent widths for the main emission lines detected in the averaged spectrum. Typical errors are of the order of 10%. The average of the full width at half intensity for hydrogen lines is 1580 235 km s-1 and for neutral helium lines is 1340 270 km s-1. The mean H equivalent width was -59 3 Å on April 2000, and -50 4 Å on May 2000. The corresponding figures for He I 5875 were -15 1 Å and -14 2 Å, respectively. We compared the observed Balmer decrements with theoretical results by Williams (1991), who modeled optically thin gas in the emission lines in accretion disks. He computed H strengths and Balmer decrements for a grid of temperatures, inclinations and mid-plane accretion disk density ( in units of nucleons per cm3). We find that the observed ) = 1.35 and ) = 0.86 nicely fit the results for the T = 15.000 , = 12.5 model.
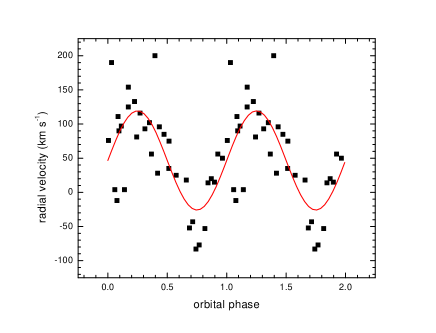
We measured the radial velocities of the H emission line in the single spectra by fitting the profile with a Gauss function. We observe a radial velocity maximum at HJD 2 451 645.6872 (April 12, 2000) followed by a smooth velocity decrease. On the other hand, on May 23, 2000, we observe a velocity minimum at HJD 2 451 695.4992 followed by a maximum at HJD 2 451 695.5586. A pdm periodogram for our radial velocity dataset indicates several possible solutions. Our velocities are not distributed in time in such way as to decide about these possible aliases. However, the data provided by Thorstensen & Fenton (private comunication) is well distributed in time to determine the daily cycle count. We therefore assumed the Thorstensen & Fenton period (0.1492 0.0004 d) and tried to refine it by doing a pdm analysis inside the period error window provided by these authors. The result indicates two solutions with similar statistical significance, viz. 0.14892 0.00013 d and 0.14936 0.00013 d. The period error above corresponds to the half width at half maximum of the main peak in the power window. In both cases, the H radial velocity curve can be described by a sine law with half-amplitude around 75 km s-1 (Fig. 5). The fact that is moderately high, and the light curve does shows variations, but no eclipses, point to a medium inclination in the range of 30–60 degrees.
3.3 Modeling the spectral energy distribution: the secondary star revealed
The existence of the TiO band at 5450 Å sets a
low limit for the spectral type of the secondary star of M 0.5, whereas
the absence of the TiO band at 8400 Å sets an upper limit of M 5 (e.g.
Reid & Hawley 2000). In order to better constrain the spectral type of
the secondary star, we fitted the continuum with a composite spectrum
consisting of the contributions of a power-law continuum and a late type
template spectrum:
(2)
where S is the observed spectrum, T the red dwarf template spectrum, the wavelength in angstroms and a,b,c parameters to be found. Of course, a and b are constrained to the positive domain. The data sampling for fitting was selected avoiding emission lines. A sequence of template spectral types between M0V and M4V were obtained from Pickles (1998), which are available on-line at the CDS (Centre de Donn es astronomiques de Strasbourg) database (http://cdsweb.u-strasbg.fr). We run a Levenberg-Marquardt non-linear least squares fitter getting the a,b,c parameters and the for every template. Our results indicated that the best fit is reached with a template of spectral type M2V and a power law with slope c = -0.61(2). The template with a spectral type of M0V gives larger by a factor 2.2, whereas the templates with spectral types M1V, M3V and M4V give larger than the M2V template by 5%, 25% and 30%, respectively. For the M2V model, shown in Fig. 5, the disk contributes 64% and the secondary star 36% to the total light at 6700 Å.
3.4 Distance estimates
From the inferred Johnson-V magnitude of the secondary star, viz. 18.04, we estimate a distance of 425 pc, assuming = 9.9 for the M2V secondary and an uncertainty in the spectral class of subtypes. An independent estimate can be obtained using the (outburst peak) vs. relationship calibrated by Warner (1995, his equation 3.4). Assuming a magnitude at maximum of = 13.1, based on the reports, we obtain a distance of = 454 pc. Finally, using the Beuermann & Weichhold (1999) method to derive CV distances, which is based on the flux deficiency at wavelengths 7500 and 7165 Å, i.e. independent of any disk contamination, we find distances of 399 96 pc, 431 104 pc, and 427 103 pc for M1V, M2V and M2.5V type secondaries, yielding a mean of 419 pc. In the above calculation we assumed a radius for the secondary star of 0.36 0.09 solar radii, accordingly to the orbital period of 3.58 h (Smith & Dhillon 1998, Eq. 11). The average of the three above estimates is = 433 pc with a likely uncertainty of 100 pc.
3.5 X-ray data
Covered in the ROSAT survey for 243 s with a mean count-rate of 0.089 counts/s, the hardness ratio suggests a hard spectrum, possibly absorbed. Using a thermal bremsstrahlung model with a fixed temperature of 20 keV, we derive an unabsorbed X-ray luminosity of 8.8 (/100pc)2 erg s-1 in the 0.1-2.4 keV ROSAT range. Using our distance estimate above, this figure corresponds to 1.65 1031 erg s-1, a typical value for dwarf nova in quiescence (Cordova & Mason 1984).
4 Discussion: on the nature of 1RXS J094432.1+035738
The orbital period found by Thorstensen & Fenton (private comunication) is quite short for a dwarf nova above the period gap (Shafter 1992). However, the low He II 4686/H emission line ratio, along with the absence of cyclotron harmonics in the spectrum, probably rule-out the hypothesis of a AM Her type system, which is also consistent with the available X-ray data. On the other hand, the presence of outbursts and the general spectrum appearance, suggests a dwarf nova type object. The short-term photometric variability observed in Fig. 1 is reminiscent of rotational modulations seen in intermediate polars, but the changing nature of this feature, and their non-coherent nature, makes this interpretation doubtful. The outburst amplitude, 3.5 mag, implies a recurrence time of around 30 days, accordingly to the Kukarkin-Parenago relationship (e.g. Warner 1995, Eq. 3.1). The above figure suggests that many outbursts might have been missed by observers in previous campaigns (the two reported outburst are separated by 6 months). We argue that 1RXS J094432.1+035738 is very likely a U Geminorum type dwarf nova, although an intermediate polar nature cannot be discarded.
Acknowledgements.
We acknowledge the referee, Dr. Klaus Beuermann, for useful comments that helped to improve a first version of this paper. We also acknowledge Dr. John Thorstensen for his cooperation in discussing the orbital period of this object. This work was supported by Grant Fondecyt 1000324 and DI UdeC 99.11.28-1.References
- (1) Beuermann, K., Weichhold, M., 1999, in in ASP conference series No. 157, Annapolis Workshop on Magnetic Cataclysmic Variables, ed. C. Hellier & K. Mukai (San Francisco: ASP), p. 283.
- (2) Cordova, F.A., Mason, K.O., 1984, MNRAS 206, 879.
- Downes et al. (2001) Downes, R. A., Webbink, R. F., Shara, M. M., Ritter, H., Kolb, U., & Duerbeck, H. W. 2001, PASP, 113, 764.
- Hamuy et al. (1992) Hamuy, M. et al., 1992, PASP 104, 533.
- Hamuy et al. (1994) Hamuy, M. et al., 1994, PASP 106, 566.
- Howell, Warnock, & Mitchell (1988) Howell, S. B., Warnock, A. I., & Mitchell, K. J. 1988, AJ, 95, 247.
- Jiang et al. (2000) Jiang, X. J., Engels, D., Wei, J. Y., Tesch, F., & Hu, J. Y. 2000, A&A, 362, 263.
- Pickles (1998) Pickles, A. J. 1998, PASP 110, 863.
- (9) Reid, N., Hawley, S., 2000, New light on dark stars, Springer-Praxis Books in Astrophysics and Astronomy.
- (10) Shafter, A.W., 1992, ApJ, 394, 268.
- (11) Thorstensen, J.R., Fenton, W.H., 2001, in ASP conference series, The Physics of Cataclysmic Variable Stars, in press.
- (12) Vennes, S., Ferrario, L., Wickramasinghe, D., 1999, in ASP conference series No. 157, Annapolis Workshop on Magnetic Cataclysmic Variables, ed. C. Hellier & K. Mukai (San Francisco: ASP), p. 143.
- (13) Warner B., 1995, Cataclysmic Variable Stars, Cambridge University Press.
- (14) Williams G., 1991, AJ, 101, 1929