UV Imaging Polarimetry of the peculiar Seyfert 2 galaxy Mrk 477
Abstract
We present the results of UV imaging polarimetry of the Seyfert 2 galaxy Mrk 477 taken by the Faint Object Camera onboard the Hubble Space Telescope (HST). From a previous HST UV image (Å), Mrk 477 has been known to have a pointlike bright UV hotspot in the central region, peculiar among nearby Seyfert 2 galaxies. There are also claims of UV/optical variability, unusual for a Seyfert 2 galaxy. Our data show that there is an off-nuclear scattering region ( pc) NE from the hotspot. The data, after the subtraction of the instrumental effect due to this bright hotspot region, might indicate that the scattered light is also detected in the central radius region and is extended to a very wide angle. The hotspot location is consistent with the symmetry center of the PA pattern, which represents the location of the hidden nucleus, but our data do not provide a strong upper limit to the distance between the symmetry center and the hotspot. We have obtained high spatial resolution color map of the continuum which shows that the nuclear spiral arm of scale ( 300pc) is significantly bluer than the off-nuclear mirror and the hotspot region. The nature of the hotspot is briefly discussed.
1 Introduction
Mrk 477 is classified as a Seyfert 2 galaxy since its permitted emission lines are narrow in the optical spectrum. However, it has some unusual properties among this class of objects. Seyfert 2 galaxies generally do not show variability in the UV/optical, but for this object, some variations have been reported. De Robertis (1987) first reported that the Fe lines ([Fe VII] 6087 and [Fe X] 6375) are variable, and the optical continuum seems to have increased by a factor of 2 between the 1980 and 1985 observations. Although Veilleux (1988) pointed out that the reported variation in the FeX line is due to the afterglow in the detector and the FeVII line variation is questionable due to the presence of a sky line, Kinney et al. (1991) also reported that the UV/optical continuum increased by a factor of 2 over a year period, based on the mismatch of the flux at Å from the IUE data taken in 1984 (partly in 1983) and the optical spectra taken in 1989 (confirmed in 1990).
Kinney et al. also suggested that its nuclear ionizing source does not need to be blocked from direct view based on a photon budget argument. This is strange in the sense that, if we are seeing the nucleus directly, we should see broad permitted lines also directly, since the nuclear continuum source is generally thought to be more compact than the broad-line region. But in the Mrk 477 spectrum, we do not see the broad lines in total flux (see discussion of upper limit in §4). This might lead us to consider an actual lack of a broad-line region in this object. However, optical spectropolarimetry has shown the presence of broad lines in the polarized flux spectrum (Tran, Miller, & Kay 1992; Tran 1995), suggesting that the broad-line region does exist but is hidden from direct view and seen only through scattered light. This is in accordance with the general idea for Seyfert 2 galaxies that the continuum source and broad-line region seen in Seyfert 1 galaxies exist also in Seyfert 2 galaxies but are hidden from direct view (Antonucci & Miller 1985). This idea is consistent with the fact that nearby Seyfert 2 galaxies generally do not show an unresolved bright nuclear source in their HST UV/optical image (Nelson et al. 1996; Malkan, Gorjian, & Tam 1998). However, the HST UV image (at Å; Heckman et al. 1997) has shown that Mrk477 has a fairly bright UV pointlike source in its central region, which is again peculiar. On the other hand, the HST/GHRS UV spectroscopy has shown that there is strong starburst activity in a rather compact nuclear region (a few hundred pc scale; Heckman et al. 1997).
In order to reveal the detailed nuclear structure of this peculiar Seyfert 2 galaxy, we have conducted HST imaging polarimetry of Mrk 477. Our data have spatially resolved the nuclear polarization structure. We describe our observations in §2 and the results in §3. The implication of the results are discussed in §4 and our conclusions are summarized in §5. We adopt km sec-1 Mpc-1 throughout this paper. Mrk 477 is at , so the distance is 180 Mpc and one arcsec corresponds to 800 pc. The Galactic reddening for this object is low, (NED; Schlegel et al. 1998). For the Galactic reddening correction, we adopt the reddening curve of Cardelli et al. (1989) with .
2 Observation
Mrk 477 was observed on August 28 and 30, 1997 by the Faint Object Camera (FOC) onboard the HST. The filters F275W (Å) and F342W (Å) were used with three polarizers POL0, POL60, and POL120. All data were taken in the normal pixel mode, where the pixel size is and the field of view is . The data are summarized in Table 1. These were taken after the installation of COSTAR.
The FOC has a complicated nonlinearity, which depends on the flux distribution of the object in the frame. It has a 10% level nonlinear response for a count rate of 0.15 cts sec-1 pixel-1 (normal pixel mode) for a uniform illumination. For a point source, the 10% nonlinearity occurs for a peak count rate of 1.0 cts sec-1 pixel-1. The central region of Mrk 477 consists of a bright pointlike source surrounded by a fainter extended structure. Therefore, at the center of our image, the instrument behavior will be at least between these two cases and likely to be closer to a point source case.
In the F342W images, the recorded peak count rate at the central pointlike source was cts sec-1 pixel-1. This is a little larger than the 10% nonlinearity level for a point source case. In the extended structure surrounding the pointlike source, the region with a count rate larger than the 10% nonlinearity level for a uniform illumination case (0.15 cts sec-1 pixel-1) is of the size pixel (). To compare this size with the wing of the point spread function (PSF; see section 3), we find that in the images of the PSFs scaled to have peak counts of 1.4, the region with counts larger than 0.15 is of the size pixel. Thus, our images suffer from a small nonlinearity. We have applied a flat-field linearity correction (task FFLINCOR in IRAF) on the raw images. The largest correction at the peak location was about 30%, and less than 10% outside the radius region. The nonlinearity would affect the polarization measurement at least at the central scale region, as we will discuss in §3.
For the F275W images, the recorded peak count rates were cts sec-1 pixel-1. The count rates were larger than 0.15 only for the central pixel region, which is also essentially the region of the pointlike source, and the peak count rate was well below the point source 10% nonlinearity level. Therefore, nonlinearity is expected to be small in these images. The flat-field linearity correction was also applied to the F275W raw images. The correction was less than 10% even in the peak region. However, the polarization measurement of the pointlike source might be somewhat uncertain also in the F275W image, as discussed in §3.
After this nonlinearity correction, the data were processed in the standard manner to correct for geometric distortion and flat-field response. The reseau marks were removed using neighboring pixels. Each set of the two exposures through each polarizer with F275W (see Table 1) was checked for the telescope pointing by taking a cross-correlation between the central 300 pixel 300 pixel regions of the two images. Only the set of POL120 images were displaced slightly from each other, so we shifted one of the set accordingly. After this, each set for F275W were coadded, resulting in six images (two filters and three polarizers).
The three images with three polarizers, as well as the images through different filters, are expected to be shifted relative to one another. The six images were registered using several pointlike sources in the outer region of the images. The accuracy of this registration is estimated to be 0.4 pixel, or , from the standard deviation of these pointlike sources in the registered images. Then the background was subtracted using the outermost region of the images.
Each polarizer’s throughput has a slightly different wavelength dependence (especially POL60 in shorter wavelengths), so we need to scale each polarizer’s image accordingly. We have determined these scaling factors by implementing synthetic photometry on the UV/optical spectrum of Mrk 477, constructed from the FOS UV spectrum ( aperture; Cohen et al. 2002) and the ground-based optical spectrum ( slit; Kay 1994), using the throughput for each combination of three polarizers and two filters. Then, each set of the three images with three polarizers are combined to produce the Stokes images.
Using the same spectrum, we also estimated the narrow emission line contamination to be % in the F342W filter and % in the F275W filter. For small spatial bins, the line contamination could be different from this estimation. Since the narrow lines are unpolarized, the line contamination simply dilutes . It essentially will not affect the and (unnormalized Stokes parameters), though the spatial variation of the effective transmittance would slightly affect them: the resulting uncertainty in is estimated to be less than % in the F275W filter, and much smaller in the F342W filter where the polarizer transmittances are much similar to one another.
3 Results
3.1 Overall description
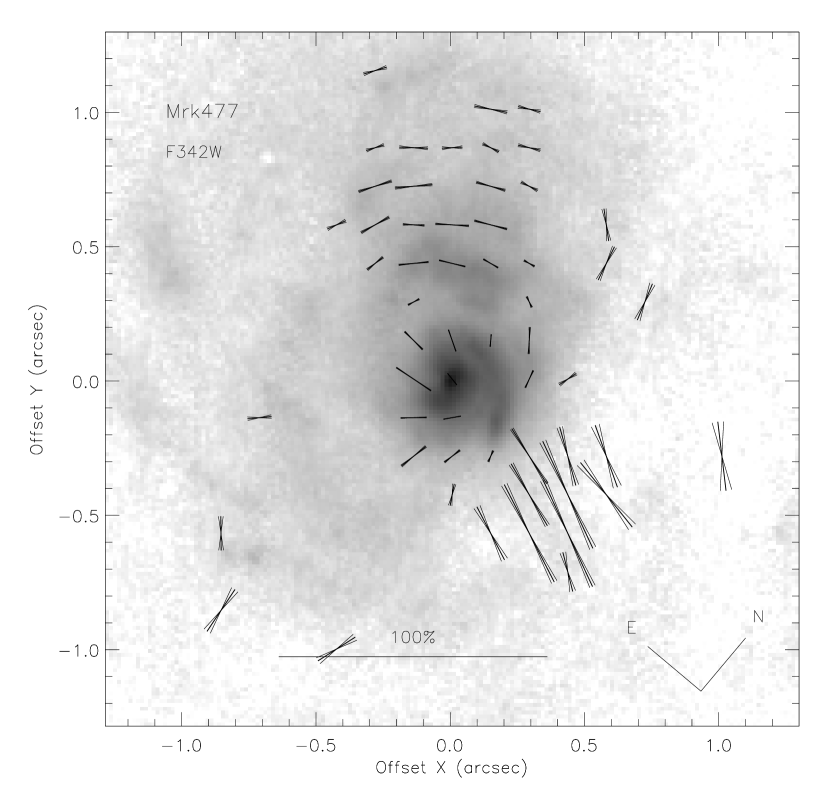
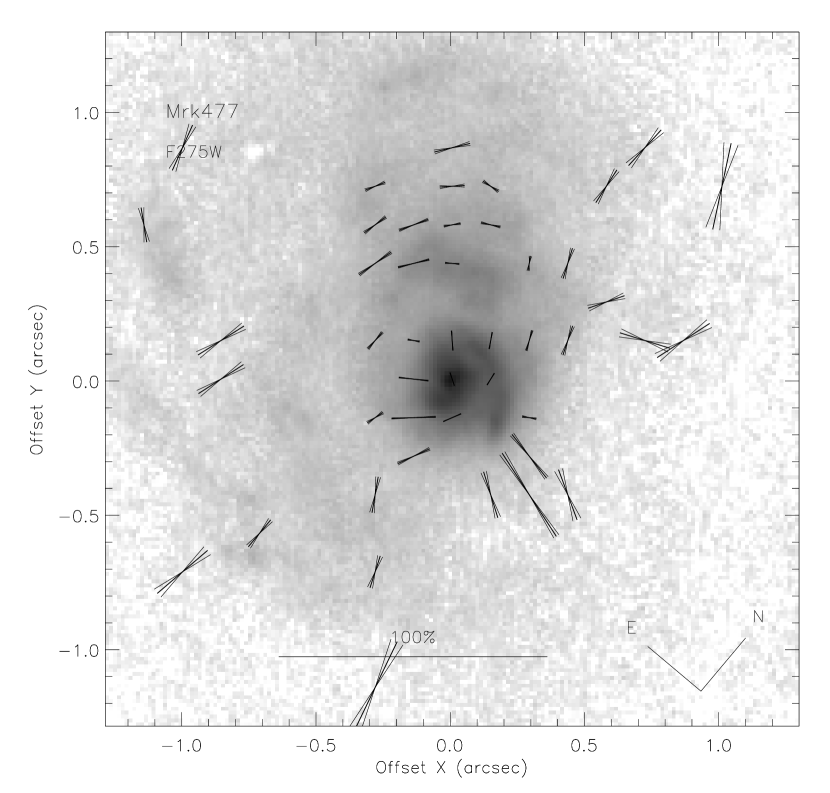
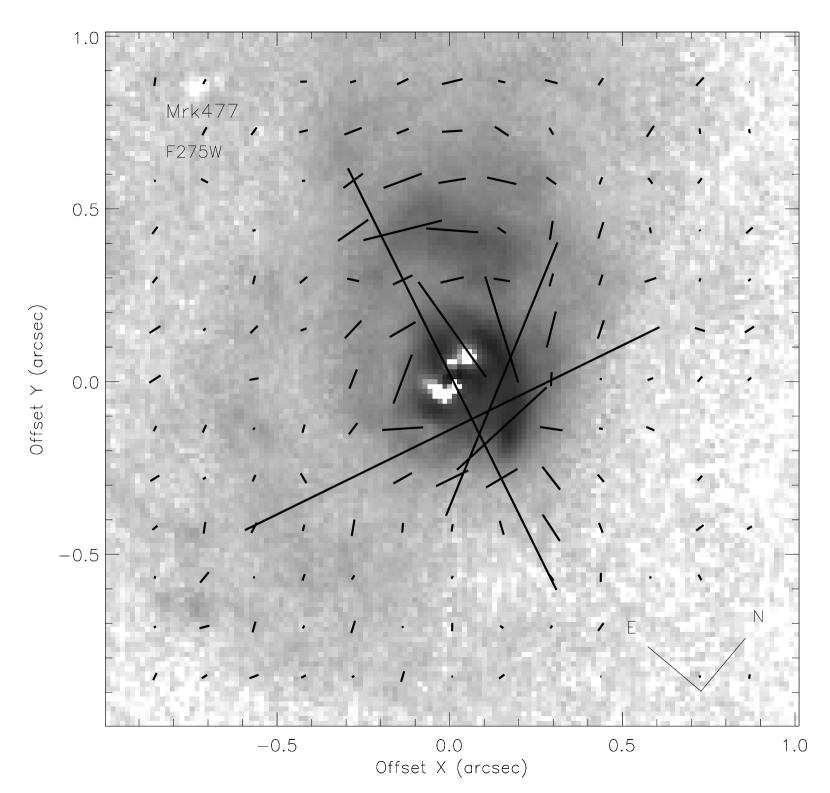
Figures 1 and 2 show the near-UV (F342W) and UV (F275W) polarization images of the central region of Mrk 477. The polarization has been calculated with 10 pixel () 10 pixel bins, and the regions with statistical S/N in larger than 3 are shown with the lines at each point proportional to . The position angle (PA) of polarization is approximately centrosymmetric in the region ( pc) NE from the bright pointlike source (note that the north is not to the top), indicating that this region is scattering the light from a compact source. We call this region the NE mirror hereafter in this paper.
However, in other regions, the polarization pattern is very unusual. At about west from the hotspot, there is a region with a “radial” pattern of large polarization degrees. We call this a large-P radial feature, for convenience in this paper. This is primarily due to the radial-shape counts in the POL120 polarizer images at this position (counts at this position are elongated along the radial direction with respect to the brightest center) where the count rate is % of the peak count rate. A similar but weaker feature is also seen in the POL60 images. This feature is seen in both of the F342W and F275W (but weaker) filter images, so it is not considered to be due to incidental high background counts at this position.
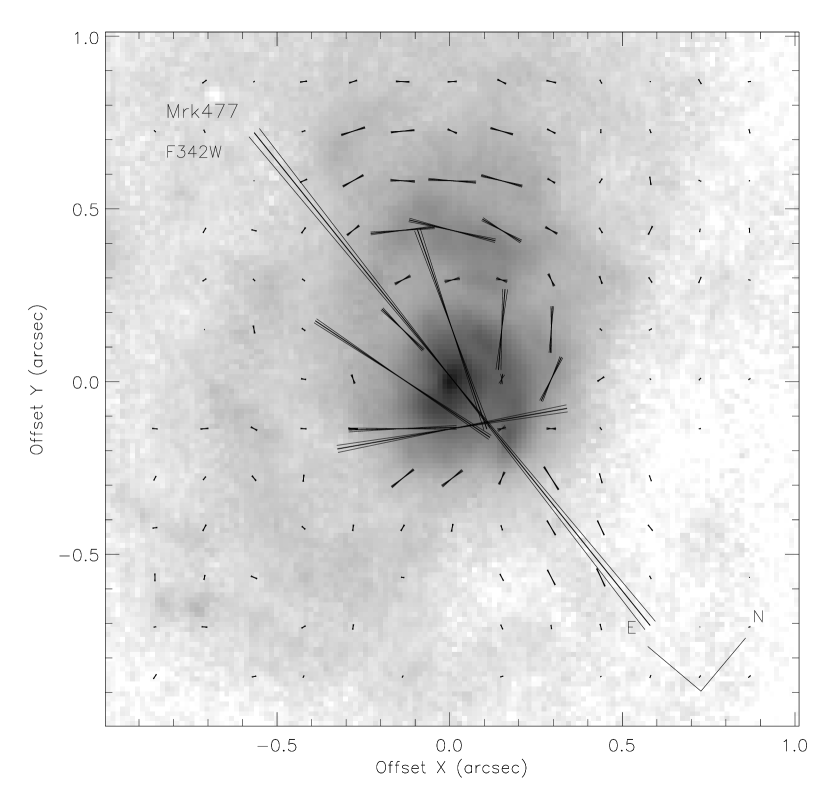
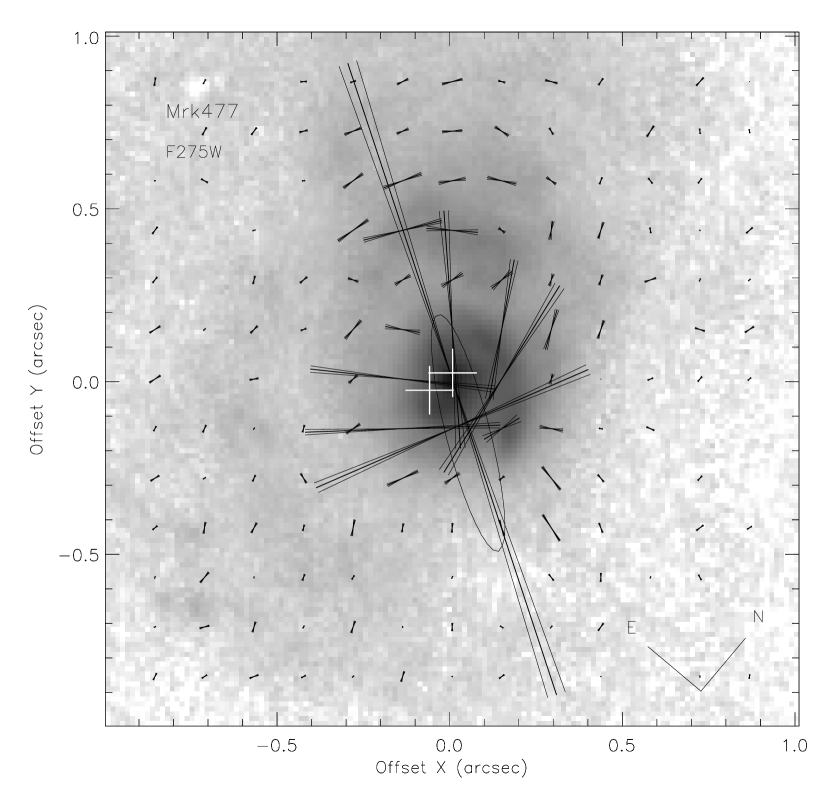
The central scale region consists of a few distinct features, as discussed by Heckman et al. (1997) : (1) a bright pointlike source, which we call here a hotspot, (2) scale fuzz (or broken ring feature as Heckman et al. called it) elongated roughly north-south around the hotspot, (3) a fainter spiral arm of scale. This central region also has a somewhat radial-like PA pattern. We show slightly zoomed polarization maps in Figures 3 and 4, where the polarized flux in each bin is drawn and the regions of statistical S/N in down to 1 are included to show the detailed polarization measurement at this central region. In the following, we infer that the radial-like PA pattern in the central region is primarily due to an instrumental effect from the compact bright hotspot + fuzz feature, and also infer that the large-P radial feature is probably due to the same effect.
3.2 Instrumental polarization pattern
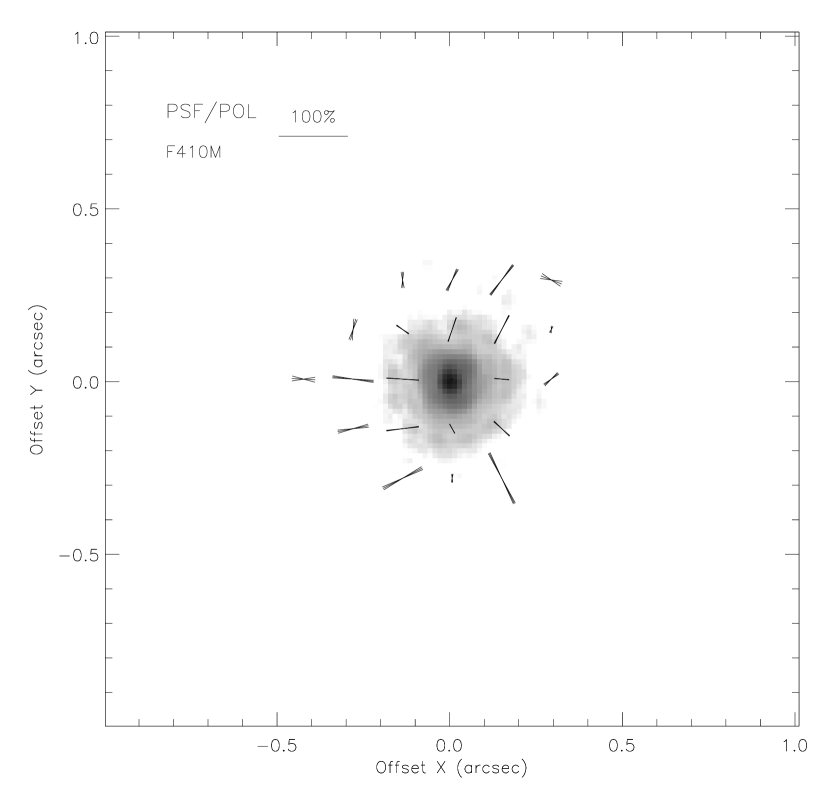
The FOC polarimetry is implemented by taking images through three different polarizers, called POL0, POL60, and POL120, which have axes of three different directions with respect to the detector, 0°(or 180°), 60°(or 240°), and 120°(or 300°) counter-clockwise from the image -direction. Figures 14 are all preserved to have the detector coordinate direction (so the north is not to the top). The images through the three polarizers are known to have different point spread functions (PSFs), which results in yielding “instrumental polarization” when the polarization of a compact source is measured with small apertures (Hodge 1995). In fact, this difference in the PSFs would also yield some instrumental features when polarization is calculated at the regions around a bright source. This instrumental effect has not been discussed in the literature111M. Ouchi, M. Kishimoto, & R. Antonucci have noticed this effect in the HST/FOC data of 3C109 (PID 6927) and the calibration data (PID 6197), based on a suggestion by R. Jedrzejewski.. In order to assess this effect rather quantitatively, we have constructed high S/N PSFs for each polarizer using the data from the calibration observation of an unpolarized globular cluster NGC 5272 (PID 5522; see Hodge 1996). We have added up the images of a few of the brightest stars from the data sets taken in two different epochs (1994 Aug 4 and 1995 May 23).
The PSFs through POL60 and POL120 were found to be slightly elongated along the polarizer axis (for images of one star, see Fig.1 in Hodge 1995), though for POL60 the structure in the wing appears to be more complicated. This essentially seems to result in having an instrumental radial PA pattern in the PSF wings. This is shown in Figures 5 and 6 with the “instrumental polarization” and “instrumental polarized flux”, respectively, when the polarizations are calculated at the PSF wings (this is an artifact that emerges from calculation, and not the physical polarization). The instrumental polarized flux is very small compared to the total flux of the source. Figure 6 shows this ratio when binned with 10 pixels (). The ratio is at about the % level at the bins adjacent to the peak bin. When the source is more extended and the intensity gradient is much smaller, this instrumental effect will be more smeared and become smaller.
For Mrk 477, however, the intensity gradient around the hotspot + fuzz seems to be large enough that we see this effect. The PA pattern seen in the central region (Figs. 1 and 2) actually resembles the PA pattern in the PSF wings (Fig. 5). Note that they are all in the same detector coordinate directions and with the same size bins, so we can directly compare them. These features in the PSF wings would depend on the telescope focus/breathing, but the overall correspondence suggests that our assessment of the PSF effect is at least approximately correct.
In Figure 5, we see a radial polarization feature with a large in the lower-right direction from the center. This is essentially due to the PSF wing through the POL120 polarizer. This feature seems to be similar to the large-P radial feature seen in our Mrk 477 images, though not at the same distance from the central source but almost in the same direction. This could suggest that the large-P feature seen in the Mrk 477 images would possibly be from the POL120 PSF wing of the bright hotspot+fuzz with much larger counts. The feature in our Mrk 477 images emerged even more clearly, perhaps because it landed accidentally in the low count region which is still rather close to the bright central region (see the overall diffuse structure in Fig.1 4). The feature in the Mrk 477 images has a large but a small polarized flux (see Figs. 3 and 4), and this is consistent with the small polarized flux at the lower-right feature seen in the PSF data (Fig.6).
One data set of FOC imaging polarimetry which might have been affected by this instrumental effect is the one for NGC 1068 (Capetti et al. 1995; Kishimoto 1999), which has a fairly bright and rather compact source at the central region. In the detailed re-analysis of this data set by Kishimoto (1999), the regions with a large intensity gradient have been masked out, so that the analysis is not affected by this effect. In the FOC imaging polarimetry data of Mrk 3 (Kishimoto et al. 2002), the images consist of multiple resolved clumps with much lower counts compared to the peak in the Mrk 477 image, and the images are not dominated by a single compact region. Therefore the data set of Mrk 3 is essentially not affected by the instrumental effect discussed above.
3.3 Subtraction of the instrumental effect
In addition to the rough similarity between the observed PA pattern around the hotspot and that in the PSF wings, there appear to be some possible systematic differences. Therefore, we have attempted to subtract the instrumental effect of the bright compact components, i.e. hotspot + fuzz, using these PSF images. These two components are compact and bright enough to have a steep intensity gradient which produces the instrumental polarization discussed above. The hotspot + fuzz can be approximately modeled by a PSF + an elliptical gaussian with its major axis at 25° clockwise from the image direction (Fig.1; PA 15° in the sky coordinates; see next section for the hotspot size): we have subtracted out each polarizer’s PSF from each polarizer’s image of Mrk 477 by estimating the counts in the hotspot using synthetic aperture measurement, and this left roughly an elliptical gaussian distribution for the fuzz. We measured the FWHM of the elliptical gaussian in its major and minor axis and subtracted in quadrature the FWHM of each PSF, which resulted in 10 and 5 pixels, respectively. Then this elliptical gaussian shape is convolved with the PSF through each polarizer, and added with the PSF for the hotspot. The intensity ratio of these two components can be roughly determined from the counts ratio in the image in each of the F342W and F275W images (the intensity ratio of the hotspot to the fuzz was found to be approximately 1/3 and 1/4 in F342W and F275W, respectively). Finally, we have subtracted this two central features from each polarizer image of Mrk 477, and reconstructed the polarization map.
The polarization images after this subtraction process are shown in Figures 7 and 8. The radial PA pattern seems to be almost gone, except for the large-P feature at the lower-right side of the image, and the PA pattern now appears rather centrosymmetric around the hotspot. Our modeling of the central intensity distribution is very rough, but these results are not so sensitive to the adopted parameters. We have confirmed this by changing the parameters in a reasonable range. For given PSFs, the distribution of the instrumental polarized flux is roughly determined by the approximate size and flux of the compact sources, and not by the detailed shape of the sources.
However, we do not intend to claim that this is a definite subtraction result. One large uncertainty in the subtraction is that the PSF wing features would depend on the telescope focus/breathing at the time of the observation. Therefore we also tried to use other PSF data from the polarization calibration data (PID 6197, taken on 1996 July 12, with the F342W filter). We have obtained a very similar PA pattern from the NE to SW. The features at the east to south side of the hotspot, however, were rather hard to subtract out with this different set of PSFs. Also, in the subtraction with the previous set of PSFs (Figs 7 and 8), there might be over/under subtraction of the instrumental polarized flux in this east to south region, since the polarization pattern after the subtraction is different in the different filter image. Thus the polarization at this side is particularly uncertain in our analysis.
We note that in this process we essentially have subtracted unpolarized components for the hotspot + fuzz. The polarization of this central region seems to be rather low, as discussed in the next section.
3.4 Polarization of the hotspot and NE mirror
We estimate the size of the hotspot in our image to be FWHM 2.8 pixel (, 30pc) in the F342W image (from POL0 and POL120 images; the core of the POL60 PSF is slightly degraded), from the images with the fuzz feature roughly subtracted using an elliptical gaussian (see previous section). This is almost consistent with the PSF size through polarizer with the F342W filter, which is of FWHM 2.6 pixel (note that we have primarily used the F410M filter PSF of much larger counts, which has FWHM of 2.8 pixel).
As mentioned above, in the subtraction process we essentially subtracted unpolarized components for the hotspot and fuzz, and we have roughly fitted these unpolarized components in all the three polarizer images assuming low polarization for the hotspot and fuzz. We now turn our attention to the polarization of the hotspot. The formal measurement with a synthetic aperture of 10 pixel diameter () gives the polarization of the hotspot (plus some portion of the fuzz) = 5.5% at PA = 81° for F342W with statistical error of % and ° (total flux erg cm-2 sec-1 Å-1, corrected for the Galactic reddening), 5.4% at 61° for F275W with statistical error of % and ° ( erg cm-2 sec-1 Å-1). These polarization measurements are slightly larger than the uncertainty from the PSF differences : the same synthetic aperture polarimetry on the PSF shown in Figure 5 yields = 2.7%. The POL120 images of Mrk 477 has slightly larger count rate at the center than in the POL0 and POL60 images, so the PAs obtained above for the hotspot is approximately along the POL120 polarizer axis which is at PA = 70.05°(note that the image direction was at PA = ° at the time of the observation of Mrk 477). Therefore, we infer that the hotspot is probably polarized at least a few percent level at PA close to the POL120 axis. This would be consistent with the fact that the diagonal pattern noise which is often associated with large count rate portion is slightly seen only in the POL120 image.
One uncertainty is the effect of nonlinearity at the hotspot location on the polarization measurement. However, if the nonlinearity is mild (we expect this to be the case; see §2) and the object is not highly polarized, the nonlinear behavior of the detector would be almost the same for the three images with three polarizers except that the nonlinearity would make polarization detection smaller since the difference in the counts in the three polarizers would become slightly smaller. As described in §2, we have attempted to correct each image for nonlinearity by using FFLINCOR in IRAF. The measurement using the same synthetic aperture above on the data without this correction yielded slightly smaller as expected (% at PA=80° with F342W, % at PA=59° with F275W).
We can attempt to check the polarization measurement at the central region for the F342W filter based on two measurements : measurement at the NE mirror and the ground-based optical measurement, which are summarized in Table 2. For the error calculation, we assumed a 5% uncertainty in the background counts estimation and added this in quadrature to the statistical error. We have measured the polarization of the NE mirror with a synthetic aperture of centered at in Figure 3, which yielded the PA of the NE mirror to be 125° (Table 2). For the ground-based measurement, we have used the data of Kay (1994) taken with a slit and integrated over Å. The integrated PA is calculated to be 100° (Table 2) and this is also consistent with the the PA at longer wavelength : the PA in the optical wavelength is also about 100° (Kay 1994; Tran 1995). This difference between the PA of the NE mirror and that of the whole central region suggests that there is another polarized component in the region of hotspot + fuzz + arm. The polarization measured above in the F342W filter for the hotspot plus some portion of the fuzz is consistent with being this residual component. A large-aperture polarization measurement with the F342W filter is apparently consistent with the ground-based measurement, despite that the FOC measurement at this low polarization level could be affected by other systematic errors.
However, the pre-COSTAR FOS measurement, taken with a aperture with the minor axis at PA = ° (Cohen et al. 2002), integrated over Å, gives a different PA from that with a synthetic aperture measurement simulated on the FOC F275W filter data, as quoted in Table 2 (the quoted error for this large synthetic aperture FOC measurement is essentially from the background subtraction uncertainty). On the other hand, the PA at the NE mirror from the FOC F275W filter data is similar to the large-aperture FOS measurement (the synthetic aperture misses only a minor portion of the NE mirror). However, the polarized flux from the NE mirror seems to be significantly lower than that detected in the FOS aperture. This polarized flux difference suggests either that there would be significant polarized flux in the hotspot + fuzz + arm region at almost the same PA as that of the NE mirror or that the FOS measurement suffers from some systematic error or both of these. In the former case, there would be some systematic error in the central region of the FOC F275W filter measurement and some possible effect from nonlinearity.
The measured PA of the NE mirror with the synthetic aperture is different in the F275W and F342W filters. If we compare the PA distribution within the aperture, we find that the F342W PA is systematically rotated clockwise especially in the south-eastern portion of the NE mirror. This might be the effect of the instrumental polarized flux, since this portion is symmetrically opposite side of the large-P radial feature with respect to the central hotspot region. If this is the case, the true polarized flux from the NE mirror could be slightly larger than measured, since the radial polarized flux would cancel the centrosymmetric polarized flux. We estimate that the polarized flux might be larger than the value quoted in Table 2 by up to 30% in both of the filters, by measuring the instrumental radial polarized flux at the large-P radial feature and also by using the synthetic aperture symmetrically opposite to the aperture for the NE mirror. Even if we incorporate this possible effect, the above argument is not significantly affected.
3.5 Color of polarized flux and total flux
The polarized flux measurements in the two filters provide color information. The limited S/N in our images and the instrumental effect in the central region did not provide a reliable detailed map of the polarized flux color, but we can obtain the color integrated over the NE mirror region. From the large synthetic aperture data for the NE mirror (Table 2), the overall polarized flux color is calculated to be , where (corrected for Galactic reddening). There might be an additional uncertainty from the possible effect of the instrumental polarized flux, but the contamination in both of the two filters would tend to cancel out. This color is redder than the typical spectral index of Seyfert 1 galaxies measured in the two filters F275W and F342W, which is about (Kishimoto et al. 2002). Note that the color from these two filters would be slightly different from the color of the true polarized continuum or true Seyfert 1 continuum, since the two filters are on the so-called 3000Å bump. The value of as a typical Seyfert 1 color has been obtained specifically for the two filters (see Kishimoto et al. 2002 for details).
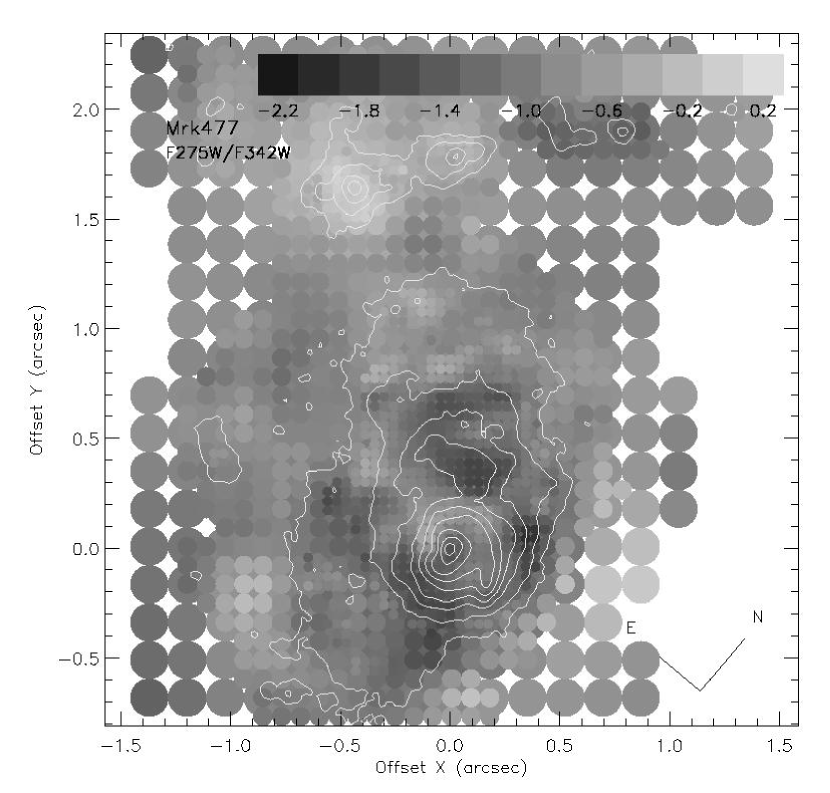
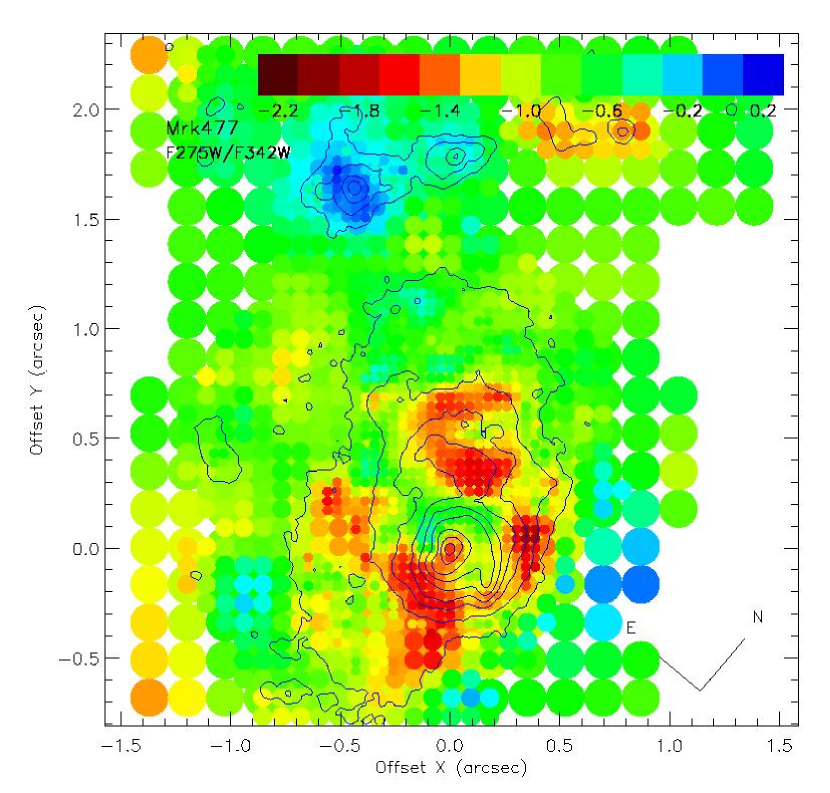
On the other hand, we can obtain a color map of total flux with much higher S/N, which is shown in Figure 9. The ratio of the total flux in the F275W filter to that in the F342W filter has been converted to the spectral index (corrected for the small Galactic reddening). The color map is a composite of three different bins with three different smoothing sizes. We have convolved each image with a gaussian of FWHM 24, 12, 6 pixels and generated the color map with 12, 6, 3 pixel bins, respectively, and stacked these three into one plot. For each bin case, the regions with the formal 1- uncertainty (calculated using the counts in the smoothed images) in the spectral index smaller than 0.5 are shown. The actual uncertainty is estimated to be less than 0.25, by binning the images with the smoothing FWHM size. For the error calculation, we have assumed a 5% uncertainty in the estimation of the background counts and added this in quadrature to the statistical error.
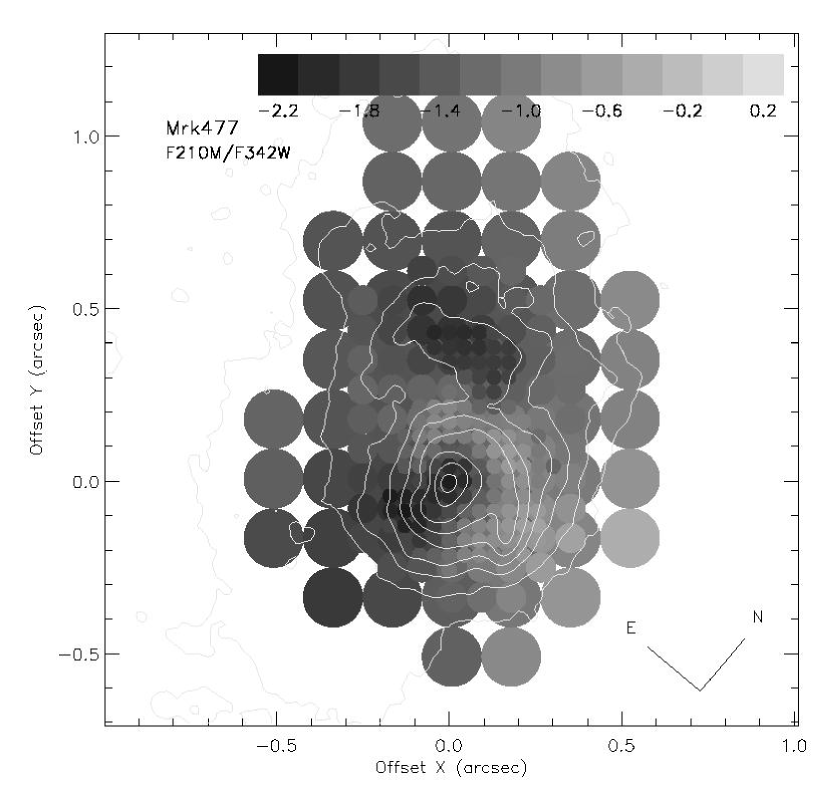
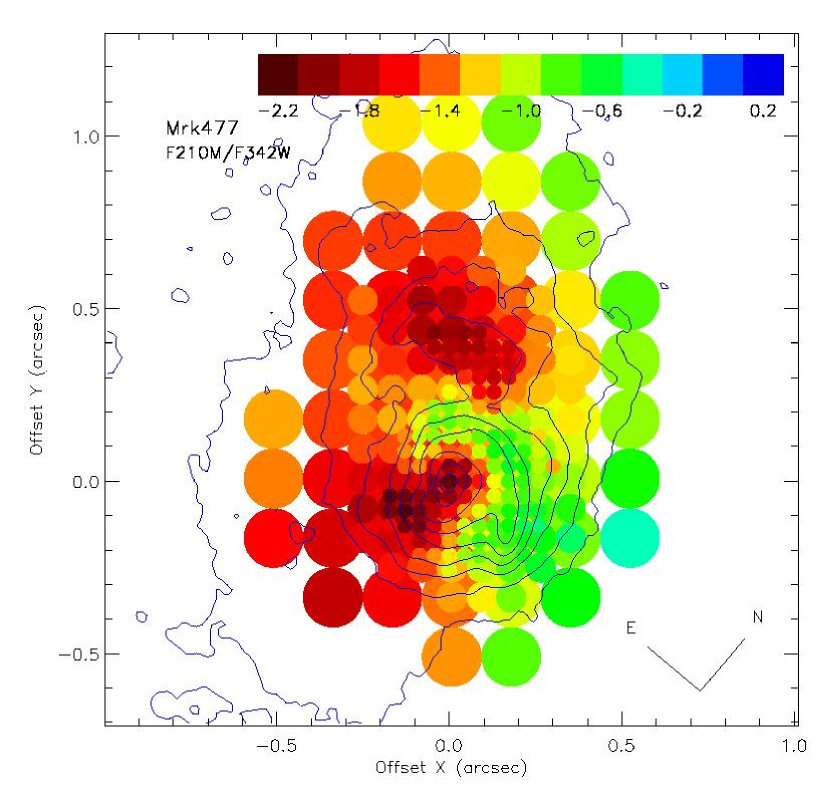
This total flux color map, however, would have some uncertainty from the emission line contamination as described in §2. Therefore we have constructed another total flux color map using our F342W image and the FOC/F210M image (Å, taken in July 1995, two years before our observation; Heckman et al. 1997), which is shown in Figure 10 (note the spatial scale difference in Figures 9 and 10). The bandpass of the F210M filter does not contain any strong emission lines, and the larger wavelength interval between the F210M and F342W filters results in a more accurate measurement of the shape of the continuum without a strong influence from the emission line contamination in the F342W filter (5% uncertainty in flux in each of the bands corresponds to in F275W/F342W, but in F210M/F342W).
In the several components in the central region (hotspot, fuzz, arm, NE mirror), the F210M/F342W color map shows that the arm has a bluer color (), while the color is redder in the NE mirror () and the hotspot and fuzz (), and the red region extends to the south of the hotspot+fuzz. For these components, roughly the same color distribution is also seen in the F275W/F342W color map, but this map has other structures, which might be from the emission line contamination. A knot structure seen outside these nuclear components about NE from the hotspot (see Fig.9), which would possibly be a star-forming region, have a bluer color ( in F275W/F342W) than that of the arm.
4 Discussion
4.1 The PA pattern in the inner region
The central region of our imaging polarimetry data is contaminated by the instrumental effect from the large intensity gradient around the point-like source, which we call a hotspot. We have attempted to subtract this effect using the PSFs through each polarizer. The data after the subtraction might suggest that in addition to the NE mirror region, the PA pattern in the nuclear vicinity of radius is also centrosymmetric. This PA pattern appears to be surrounding the hotspot region with a wide angle, as large as °.
The uncertainty from the subtraction process, however, is large, especially because the instrumental polarized flux in the PSF wing would depend on the telescope focus/breathing at the time of the observation. Also, since the instrumental PA pattern around a point source is roughly radial, an over-subtraction of this PA pattern from the surrounding region would result in a perpendicular, centrosymmetric (artificial) PA pattern, if this region is just unpolarized. The argument against this false artifact in our case of Mrk 477, although not a strong argument, would be that in the N and NE side of the hotspot the PA seems to rotate by the subtraction to become closer to centrosymmetric, and in the NW, W, and SW side, the pattern is already close to centrosymmetric before the subtraction (see F275 image, Fig.4).
This possible centrosymmetric PA pattern extending ° at the nuclear vicinity might be argued to suggest that the opening angle of the radiation from the hidden nucleus is also 180°. However, we definitely need more supporting evidence, such as an [OIII]/H ratio map, that the high ionization region is really extended to this wide angle. Note that in the radio map (Heckman et al. 1997), where three linearly aligned knots suggest a jet structure, the jet axis (PA 30°) is along the direction to the NE mirror and not perpendicular to the possible 180° opening, the axis of which is at PA 150°. Also the polarized light at the N, NW, and W side of the hotspot, cospatial with the spiral arm structure, might be simply due to the scattering of the bright hotspot (and fuzz) light (not the hidden nuclear light), with the possible high optical thickness at the spiral arm.
On the other hand, having all these uncertainties in mind, if the opening angle of nuclear ionizing radiation projected to the sky plane were indeed 180°, this would suggest that our line of sight is marginally inside the conical radiation, and our line of sight might be grazing the matter obscuring the nucleus. If the obscuring matter is in the torus-like geometry, our line of sight would be grazing the surface of the torus. However, if this is the case, the scattered light from the far side of the cone should also have a 180° opening angle (therefore, there should actually be no “opening angle”), though it is possibly weaker due to some absorption since it is on the far side. If the scatterers are dust grains, their forward scattering property would also contribute to the weakness of the scattered light on the far side. In our polarization image, the polarized flux at the far side is not clear.
4.2 The location of the hidden nucleus
The location of the nucleus can be determined as the symmetric center of the observed centrosymmetric PA pattern. This can be calculated by implementing a least-square fit of a simple centrosymmetric model to the observed PA distribution with given errors for each data point (see Kishimoto 1999 for the detailed method). The symmetric center is determined as a minimum point with an error circle defined by a certain confidence level.
The result is shown in Figure 4. We have used only the data in the NE mirror region (with statistical S/N in larger than 3), since the nuclear region is affected by the instrumental effect. For the error calculation, we assumed a 5% uncertainty in the background count estimation and added it to the statistical error in quadrature. Of the two plus signs in Figure 4, the one at the right side which is almost at the hotspot is from the F275W data, and the contour is its error circle of 99% confidence level. The reduced was 0.96 with d.o.f. = 7. However, with the F342W data, the reduced was found to be rather large, 1.7 with d.o.f. = 11, with the minimum point being SE of the hotspot (the other plus sign in Fig.4). If we include other systematic error, as described in Kishimoto (1999), the reduced can go down to or less than 1. In that case, the 99% confidence level error circle extends to almost the same size as that from the F275W data but to slightly different direction, and the hotspot is at the edge of the error circle. This systematic difference between the F275W and F342W data might be due to the instrumental polarized flux as discussed in the previous section. In terms of the relation of the hidden nucleus location to the hotspot, our data do not provide a strong upper limit on the distance between the nucleus and the hotspot. However, our data are apparently consistent with the two locations being coincident.
4.3 Hotspot nature
What is the nature of this hotspot radiation ? At least some portion is expected to be scattered light, since the radiation seems to be at least slightly polarized222There might be some contribution from the interstellar polarization intrinsic to Mrk 477, but this would probably be small. A rather conservative upper limit would be 3% using the relation (%) (Serkowski, Mathewson, & Ford 1975), based on the upper limit on the reddening of the hotspot (see footnote 3). The Galactic interstellar polarization is estimated to be very small from the polarization of nearby stars (%; Tran 1995).. The low polarization does not necessarily mean that the fraction of scattered light is low. There might be efficient geometrical cancellation of the polarization, or the scattered light might be of very small scattering angle. However, we argue below that scattered light does not seem to be the primary component.
If the hotspot is dominated by scattered light, its optical light should not exceed the total optical scattered light, for which we can set an upper limit from spectropolarimetry results. If the fraction of the scattered light is substantial, we should see, in the total flux spectrum, the wings of the broad H and H lines, which have been detected in the polarized flux (Tran 1995). However, using the spectropolarimetry data of Tran (1995; after the subtraction of an old stellar population), we found little or no evidence of the H wing, by overlaying various forbidden lines on to the H line. From this, we obtained a rather conservative upper limit on the fraction of the scattered light to be 10% (this corresponds to the intrinsic of the scattered light to be %, since the observed for the continuum is about 1%). For the H region, essentially the same limit was obtained from the red side of the H+[NII] lines (though in the blue side there seem to be some more residuals). This upper limit is calculated to be erg cm-2 sec-1 Å-1, by adopting the total flux of erg cm-2 sec-1 Å-1 at Å (excluding an old stellar population; Tran 1995, Heckman et al. 1997). Now, this upper limit should be compared with the optical flux of the hotspot, but unfortunately there is not an adequate HST optical continuum image: the existing archival F606W images taken by WFPC2 (on PC chip; 6000Å) are saturated at the hotspot, and also have a significant emission-line contribution of 50% (estimated using the spectrum of Tran 1995). We obtain a conservative lower limit of the optical hotspot continuum to be erg cm-2 sec-1 Å-1, by implementing a formal synthetic photometry with a 0.8 pixel radius aperture on the hotspot, corresponding to the 2.5 pixel radius aperture used below for the FOC images, and assuming a 50% emission line contribution. This would not be too constraining. However, we can compare the above upper limit on the total optical scattered light with the hotspot fluxes at other wavelengths.
Using our two broad-band images and the FOC/F210M image (Å; see previous section; Heckman et al. 1997), we have constructed the UV/optical spectra of the hotspot and surrounding regions, by implementing synthetic aperture photometry with several aperture sizes. This is shown in Figure 11. The fluxes have been corrected for Galactic reddening (see §1). The smallest aperture (2.5 pixel radius) is essentially for the hotspot. If the hotspot is dominated by scattered light, the above upper limit on the total scattered light, indicated with a cross, gives a rather blue color for the hotspot between 3400Å and 4800Å, where (or where ). The scattered light from the hotspot would be much less than this upper limit, since this is the upper limit for the sum of the scattered light. In our polarization image with the F342W filter, the polarized flux from the central bin is roughly comparable to that detected in the NE mirror. Based on this, if we assume that half of the total scattered light at 4800Å is from the hotspot, the limit of the color becomes (). Therefore, although we cannot exclude the possibility that the hotspot is dominated by scattered light, these colors seem to suggest the existence of another significant component in addition to the scattered light. Note that the observed optical polarized flux is not too blue, (or ; Tran 1995). The ratio of the polarized flux in the diameter aperture in our two images formally gives (), though this is subject to several uncertainties as discussed in §3.
We do not expect that the hotspot is a heavily absorbed Seyfert 1 nucleus, if the size of the nucleus is smaller than the broad-line region as usually thought. We clearly do not see any strong direct broad lines in the total flux, so the direct broad lines, if there are any, must be heavily absorbed. (For instance, conservatively, even if the unabsorbed direct broad components have peak flux only comparable to the narrow components, it would have to be suppressed at least by a factor of , based on the above upper limit on the broad line component; this absorption corresponds to roughly .) The direct Seyfert 1 continuum would be absorbed even more. This would be inconsistent with the UV spectrum of the hotspot shown in Figure 11 which is not too red, unless is extremely high (note that the intrinsic color of direct continuum should be no bluer than quasars, i.e. or [e.g. Neugebauer et al. 1987], and possibly redder than this)333An upper limit on the reddening of the hotspot can roughly be obtained based on the hotspot spectrum shown in Figure 11: even if the intrinsic (unabsorbed) spectral shape is as blue as 0 (e.g. Neugebauer et al. 1989 for quasars; Leitherer et al. 1999 for starbursts), the reddening is estimated to be 0.3, using Milky Way or SMC curves (Cardelli et al. 1989; Witt & Gordon 2000) with .. Thus, conversely, in order to have enough continuum light without having strong broad lines, we need another continuum source outside the broad-line region, or the nuclear continuum source has to be larger than the broad-line region.
Heckman et al. (1997) showed that the far-UV (Å) radiation from the central region is dominated by a starburst, based on the presence of stellar wind features observed in the HST/GHRS spectrum with a aperture. The radiation from this central region is essentially from the hotspot + fuzz + arm + NE mirror, but the hotspot is only a minor part of the radiation, as seen in Figure 11 : % at 2800Å and 3400Å, and less at 2180Å. Therefore, for the hotspot nature, this spectroscopic result does not provide a useful limit. As described in §3 and shown in Figure 10, the color in the spiral arm is bluer than in the hotspot or the NE mirror, so the spiral arm will be the primary flux contributor in the central few arcseconds at shorter wavelength. Therefore the stellar wind features may well be originating primarily from this nuclear spiral arm. Note that Heckman et al also states that the scattered light is a very minor part of the far-UV flux (less than 10%), while our data suggest that the flux from the NE mirror could be dominated by scattered light. These are not inconsistent, since the NE mirror flux is also a minor part of the whole integrated flux (% within the diameter in our two filters).
The variability of the UV/optical continuum reported for this galaxy might be due to the hotspot, if the hotspot is the region really close to the nucleus. Note, however, that at least at the time of our observation, the hotspot radiation was only 10% of the UV radiation in the central diameter region as described above. Therefore, it would have to be variable by an order of magnitude to cause the variability of a factor of in a large aperture, which is reported by De Robertis (1987) and Kinney et al. (1991), and this continuum brightening would have to occur without a significant increase of the broad lines. If this is the case, the hotspot might be some part of the continuum source itself, which, however, implies that the continuum source is extended over the broad-line region. The nature of the hotspot radiation would be of great interest in the future high spatial resolution spectroscopy such as by HST/STIS.
5 Conclusions
We have presented HST UV imaging polarimetry data of the Seyfert 2 galaxy Mrk 477. For this galaxy, there are claims of variability in the UV/optical, unusual for a Seyfert 2 galaxy. It has a UV bright pointlike hotspot in the central region, which is also peculiar among nearby Seyfert 2 galaxies. Our data identify an off-nuclear scattering region ( pc) NE from the hotspot. The data, after the subtraction of the instrumental effect from the bright hotspot region, might indicate that the scattered light is also detected in the nuclear vicinity ( radius) and is extended widely with a full opening angle of ° around the hotspot region. This could lead us to consider the possibility that our line of sight is grazing the matter obscuring the nucleus, which might be the cause of some of the peculiar properties of this galaxy. However, the uncertainty from the subtraction process is large and we need more evidence to support this claim.
The hotspot location is consistent with the symmetry center of the PA pattern, which represents the location of the hidden nucleus, but our data do not provide a strong upper limit on the distance between the hotspot and the symmetry center. The hotspot radiation seems to be slightly polarized, but it does not appear to be dominated by scattered light. Since we essentially do not see direct broad lines and the UV spectral shape of the hotspot is not too red, we do not expect the hotspot to be a heavily absorbed nucleus which is usually thought to be inside the broad-line region. There would be another continuum source outside the broad-line region, or the nuclear continuum source has to be larger than the broad-line region.
References
- Antonucci & Miller (1985) Antonucci, R., & Miller, J. S. 1985, ApJ, 297, 621
- Cardelli, Clayton, & Mathis (1989) Cardelli, J. A., Clayton, G. C., & Mathis, J. S. 1989, ApJ, 345, 245
- Cohen et al. (2001) Cohen et al. 2002, in preparation
- De Robertis (1987) De Robertis, M. M. 1987, ApJ, 316, 597
- Heckman et al. (1997) Heckman, T. et al. 1997, ApJ, 482, 114
- Hodge (1995) Hodge, P. E. 1995, FOC Instrument Science Report, 89
- Kay (1994) Kay, L. E. 1994, ApJ, 430, 196
- Kinney et al. (1991) Kinney, A. L., Antonucci, R. R. J., Ward, M. J., Wilson, A. S., & Whittle, M. 1991, ApJ, 377, 100
- Kishimoto (1999) Kishimoto, M. 1999, ApJ, 518, 676
- Kishimoto et al. (2001) Kishimoto, M., Kay, L. E., Antonucci, R., Hurt, T. W., Cohen, R. D., Krolik, J. H. 2002, ApJ, in press
- Leitherer et al. (1999) Leitherer, C. et al. 1999, ApJS, 123, 3
- Nelson et al. (1996) Nelson, C. H., MacKenty, J. W., Simkin, S. M., & Griffiths, R. E. 1996, ApJ, 466, 713
- Neugebauer et al. (1987) Neugebauer, G., Green, R. F., Matthews, K., Schmidt, M., Soifer, B. T., & Bennett, J. 1987, ApJS, 63, 615
- Malkan et al. (1998) Malkan, M. A., Gorjian, V., & Tam, R. 1998, ApJS, 117, 25
- Schlegel et al. (1998) Schlegel, D. J., Finkbeiner, D. P., & Davis, M. 1998, ApJ, 500, 525
- Serkowski, Mathewson, & Ford (1975) Serkowski, K., Mathewson, D. S., & Ford, V. L. 1975, ApJ, 196, 261
- Simmons & Stewart (1985) Simmons, J. F. L., & Stewart, B. G. 1985, å, 142, 100
- Tran (1995) Tran, H. D. 1995, ApJ, 440, 565
- Tran et al. (1992) Tran, H. D., Miller, J. S., & Kay, L. E. 1992, ApJ, 397, 452
- Veilleux (1988) Veilleux, S. 1988, AJ, 95, 1695
- Witt & Gordon (2000) Witt, A. N., & Gordon, K. D. 2000 ApJ, 528, 799


| Rootname | Obs Date | Filter | Exp Time (sec) | |
|---|---|---|---|---|
| x3md0201r, x3md0204r | Aug 28, 1997 | F275W+POL0 | ||
| x3md0207r, x3md020ar | Aug 28, 1997 | F275W+POL60 | ||
| x3md020dr, x3md020gr | Aug 28, 1997 | F275W+POL120 | ||
| x3md0301r | Aug 30, 1997 | F342W+POL0 | ||
| x3md0304r | Aug 30, 1997 | F342W+POL60 | ||
| x3md0307r | Aug 30, 1997 | F342W+POL120 | ||
| x2rn0401t | Jul 21, 1995 | F210M |
| 2800Å | 3400Å | ||||||||
|---|---|---|---|---|---|---|---|---|---|
| instrument/aperture | (%) | P.A.(deg) | (%) | P.A.(deg) | |||||
| FOC NE mirroraaSynthetic aperture of centered at in Fig.3. | |||||||||
| ground-based slitbbUsed the data of Kay (1994), integrated over Å. | 14.3 | ||||||||
| FOC diameter | |||||||||
| FOS ccUsed the data of Cohen et al. (2002), integrated over Å. The minor axis of the observing aperture was at PA=°. Pre-COSTAR data, while our FOC data is post-COSTAR. | |||||||||
| FOC ddSynthetic aperture simulating the FOS measurement, which includes the whole central region and misses only a minor portion of the NE mirror. | |||||||||
Note. — and are in units of erg cm-2 sec-1 Å-1, and corrected for the small Galactic reddening . For the error estimation, we assumed a 5% uncertainty in the background counts estimation and added it in quadrature to the statistical error. For the FOC data, the quoted values for 2800Å and 3400Å are in the F275W and F342W filters, respectively.