Spectroscopy of SN 1987A at 0.9–2.4 m: Days 1348-3158
Abstract
We present near-infrared spectroscopic observations of SN 1987A
covering the period 1358 to 3158 days post-explosion. This is the
first time that IR spectra of a supernova have been obtained to such
late epochs. The spectra comprise emission from both the ejecta and
the bright, ring-shaped circumstellar medium (CSM). The most prominent
CSM emission lines are recombination lines of H I and He I, and
forbidden lines of [S III] and [Fe II]. The ejecta spectra include
allowed lines of H I, He I and Na I and forbidden lines of [Si I],
[Fe I], [Fe II], and possibly [S I]. The intensity ratios and widths
of the H I ejecta lines are consistent with a low-temperature Case B
recombination spectrum arising from non-thermal ionisation/excitation
in an extended, adiabatically cooled H-envelope, as predicted by
several authors. The slow decline of the ejecta forbidden lines,
especially those of [Si I], indicates that pure non-thermal excitation
was taking place, driven increasingly by the decay of 44Ti. The
ejecta iron exhibits particularly high velocities (4000–4500 km/s),
supporting scenarios where fast radioactive nickel is created and
ejected just after the core-bounce. In addition, the ejecta lines
continue to exhibit blueshifts with values –200 km/s to
–800 km/s to at least day 2000. These blueshifts, which first
appeared around day 600, probably indicate that very dense
concentrations of dust persist in the ejecta, although an alternative
explanation of asymmetry in the excitation conditions is not ruled
out.
keywords:
Supernovae: individual (SN 1987A), dust infrared, circumstellar matter1 Introduction
The exceptionally close proximity of the type IIpec supernova SN 1987A
in the Large Magellanic Cloud has provided a unique opportunity to
observe a core-collapse supernova with all the resources of modern
observational astronomy and over a very long period of time.
Near-infrared (near-IR) spectroscopy has played a vital role in the
determination of the physical conditions in the debris and the
investigation of the element synthesis, providing a valuable
complement to optical spectra. In particular, in the nebular phase
(when the lines are mostly optically thin) the line profiles produced
in the high velocity, homologous expansion have enabled us to examine
the ejecta abundances and their spatial distribution. During
the first few years, all the major southern observatories obtained
near-IR spectra of SN 1987A. Observations at the Anglo-Australian
Telescope (AAT) covering the first 3 years post-explosion were
described in Meikle et al. (1989, 1993) (hereinafter Papers I, II).
In this paper we describe spectra obtained at the AAT for a further 8 epochs from 1990 November 2 (day 1348 = 3.7 years) to 1995 October 17 (day 3158 = 8.6 years). Epochs are with respect to the explosion date 1987 February 23. Our day 1348 spectrum was the last observation of SN 1987A obtained with the near-IR spectrometer FIGS (Bailey et al. 1988. Also see Papers I & II). All the subsequent spectra were obtained with the more sensitive spectrograph, IRIS (Allen et al. 1993), which allowed the acquisition of high resolution near-IR spectra to a later phase than was achieved at any other observatory. Preliminary reports of these data have been given in Fassia (1999) and Meikle (2001). The only other post-3 year IR spectra reported are those of Bautista et al. (1995) which reached day 1445, but at a lower resolution than those described here. In a future paper (Fassia et al., in preparation) we shall present -band spectra of SN 1987A taken with the MPE imaging spectrograph, 3D (Weitzel et al. 1996), at the AAT on 1997 Dec 16 (day 3949 = 10.8 years) and 1998 Dec 1 (day 4299 = 11.8 years). We also note that the earliest Hubble Space Telescope (HST) NICMOS spectrum of SN 1987A was taken on 1998 June 15 (day 4130 = 11.3 years), but has not yet been published.
2 Observations
The observations are summarised in Table 1. Some of the data
presented here were obtained in runs of several days. In the text and
diagrams these runs will usually be identified by the epoch of the
first day of each. For further details of the FIGS spectrometer, used
to obtain the day 1348 spectrum, see Bailey et al. (1988) and
Papers I & II. The IRIS spectrograph was based on a
pixel HgCdTe array. All the IRIS observations were taken at f/36,
yielding a plate scale of 0.79 arcsec/pixel. Spectra were acquired in
the echelle mode for epochs 1469–2112 days and in the -grism mode
for the subsequent epochs. In the echelle mode, 4 orders of
cross-dispersed spectra were provided, covering 0.9–1.5 m
( band) and 1.4–2.4 m ( band). The slit was usually
oriented at a P.A. of 90 deg. i.e. east-west. The slit length
was 13 arcsec (16 pixels) while in the dispersion direction, 2 pixels
corresponded to a spectral resolution of about 375
() (equivalent to 800 km/s). However, the
actual resolution was generally poorer than this (see below). To
enable sky-subtraction, the telescope was nodded along the slit by
5–8 arcsec (6–10 pixels). To improve the flux measurement precision
of both the ejecta and the bright ring, the slit width for the
observations was set at 5.8 arcsec. Similarly, the 1348 d FIGS
spectrum was obtained with a 5.9 arcsec aperture. Thus, the
resolution of the (point-source) ejecta spectra was effectively
determined by the seeing. For the CSM spectra, the finite extent of
the bright ring ( arcsec, Plait et al. 1995)
would have produced a slightly lower resolution. The echelle
resolutions listed in Table 1, column 4, were obtained directly from
the FWHM of the He I 1.083 m line. They were typically 200–400
(). As already mentioned, the resolution of the
ejecta spectra was probably slightly higher. For the
observations, we were unable to use the 5.8 arcsec slit since it
produced severe degradation of the S/N. We therefore used a slit width
of 1.4 arcsec in this band. The resolution was obtained from the
FWHM of the He I 2.058 m CSM line. Owing to the declining flux,
after day 2112, spectra were taken using the lower resolution
-grism mode. This covered 1.2–2.1 m in a single order. The
slit was usually oriented at a P.A. of 135 deg. in order to maximise
the spatial separation of the spectra of the supernova and Stars 2 and
3 (see below). The slit length was 24 arcsec (30 pixels), while in the
dispersion direction a 1.6 arcsec (2 pixel) wide slit was used,
yielding a spectral resolution of 120 ()
(equivalent to 2,500 km/s). The nod throw was 10–15 arcsec.
The day 1348 FIGS spectrum was reduced using FIGARO
(Shortridge 1995). Final fluxing was by comparison with contemporary
broad-band photometry obtained with the AAT IR photometer IRPS (cf. procedure described in Paper II), using the A7 dwarf BS 2015 as
the local standard. However, by this epoch, the narrow He I
1.083 m line from the bright ring had an intensity of about 20%
of the flux within the -photometry wavelength window. Moreover it
lay right at the blue edge of the -band filter, making it difficult
to judge the effect of the bright ring on the -magnitude. (The
spatial coverage of IRPS included the ring). Therefore, taking into
account other uncertainties, we judge the uncertainty in the fluxing
to be of order 25%. The wavelength scale was calibrated using
the narrow He I 1.083 m and Pa lines, adopting a redshift
of +289 km/s (Crotts & Heathcote 1991).
The IRIS data were also reduced using FIGARO. After
bias-subtraction and flat-field correction the image-pair obtained at
the two nod positions were subtracted to remove sky line emission. For
the echelle-mode data, different echelle orders were then traced and
corrected for echelle distortion. The positive and negative spectra
were extracted from the resulting frames using simple extraction. We
extracted over 4–6 pixel rows (3.2–4.8 arcsec), depending on the
seeing. This is discussed further below. Cosmic rays and residual
sky-lines were identified and removed by comparing repeat observations
of spectra obtained at different times during the night. Wavelength
calibration was by means of argon and xenon arc lamps and the
night-sky emission lines present in the supernova spectra. The
wavelength uncertainty in the echelle spectra ranges from
0.0014 m in the -band spectra to 0.0025 m in the
-band spectra. The wavelength uncertainty in the grism spectra is
0.009 m. To correct for the atmospheric and instrumental
transmission functions and to flux-calibrate the spectra, we used the
G dwarf spectrophotometric standard BS 1294 (Allen & Cragg 1983).
The adopted magnitudes were J=+5.20, H=+4.90, K=+4.84. (For the grism
spectrum on day 3158, we used the A4 giant HD 19904, adopting
H=+6.66). The spectral orders of the echelle spectra were then merged
to form single spectra. The final fluxing of the spectra is now
described.
Accurate flux calibration of the spectra was difficult and
became increasingly so with time. This was due to the combined
effects of the declining SN flux, variable seeing, variable
atmospheric transmission for both supernova and standard (the airmass
was inevitably quite high viz. 1.4–1.8), pointing errors of up
to 2 arcsec and, for the echelle spectra, the small number of
detector pixels (16) along the slit in a given order. Flux
measurement under poor seeing conditions was a particular problem for
the narrow slit spectra due to the greater (but uncertain) vignetting
effects. However, the most difficult problem of all in the flux
calibration procedure was contamination by light from the nearby
Star 3, and even from the slightly more distant Star 2. To make
matters worse, Star 3 is a variable Be star. Around day 1500 the IR
fluxes from Stars 2 and 3 were about 1.4 and 0.85,
respectively, of the SN flux, rising to about 4 and
1.5 by day 2112 (Walborn et al. 1993, Suntzeff private
communication. See also Turner et al. (1996)). Star 2 lies at
2.9 arcsec from the SN, at PA = while Star 3 lies at
1.6 arcsec distance at PA = (Walker & Suntzeff 1990).
Thus, for the typical E-W slit orientation used for echelle spectra,
the distances of Stars 2 and 3 from SN 1987A, along the slit, were
only 2.2 and 1.5 arcsec respectively. (We note that even
at our latest epoch, the intrinsic diameter of the ejecta source was
probably less than 0.1 arcsec (Jakobsen et al. 1994), and so was
effectively a point source whose observed extent was entirely
determined by the seeing.) Thus, under typical seeing conditions, the
Star 3 spectrum was spatially blended with the spectra of both the
ejecta and bright ring of SN 1987A, while under poor seeing conditions
even Star 2 could significantly contaminate the SN light. The grism
spectra of days 2952 and 3158 were taken with a slit PA of
135∘ yielding slightly larger displacements of the stars
along the slit. However, the much reduced flux from the supernova by
these epochs meant that contamination of the SN light by the nearby
stars was still a problem. The contamination from both stars took the
form of a continuum of uncertain flux, together with possible narrow H
and He emission lines from Star 3 (Walborn et al. 1993).
Assessment and removal of the contaminating light presented
a difficult challenge. Even with the wide slit, variations in the
seeing conditions and/or telescope pointing precision could make the
degree of contamination within the slit difficult to estimate. (A
further complicating factor was that Star 3 itself could vary by up to
a magnitude over a period of 800 days. However, the IR light curves
of the star provided by (Walborn et al. 1993) meant that this
variation could, in principle, be taken into account.) As already
described, we extracted the spectra from 4–6 pixel rows
(3.2–4.8 arcsec). Thus all the extracted spectra contained
contamination from Star 3 and sometimes Star 2.
We first consider the removal of the continuum contamination
from the ejecta spectra. We investigated several methods using
ground-based observations. However, internal consistency in the
results eluded us, probably due to uncertainties in the variable
factors already described. Therefore, we decided that the best
solution was to make use of the high spatial resolution optical
spectra provided by the HST. To determine the extent of the continuum
contamination, we inspected the relatively uncontaminated optical HST
spectra of the SN 1987A ejecta obtained on days 1862, 2210 (Wang et
al. 1996) and 2875 (Chugai et al. 1997 (C97)). The red end
(6000–8000 Å) of these spectra exhibits a weak, roughly flat
continuum of erg sec-1Å-1. C97 and
DeKool, Li & McCray (1998) (dKLM98) suggest that this is actually a
quasi-continuum produced by the down-conversion of UV photons
following absorption/emission by metals. We therefore assumed that
the ejecta continuum in the near-IR bands should also be roughly flat.
However, in the reduced IR spectra (before correction for stellar
contamination), the continuum was observed to rise towards shorter
wavelengths and so we attributed the rising portion to contamination
from Stars 2 & 3. To remove the contamination, we first modelled the
shape of the stellar continuum by fitting a blackbody of the
appropriate temperature to the Star 3 infrared photometry of Walborn
et al. (1993). Since Stars 2 & 3 are of a similar stellar type (B2)
the model continuum was used to represent the combined effects of
contamination from both stars. However, Star 3 was the dominant or
even sole contaminator in all cases. We then scaled the model
continuum and subtracted it from the reduced spectrum to try to
produce a flat continuum. For most of the wavelength range covered,
it was found that roughly flat continua could indeed be formed in this
way. However, within the 1.4 m–1.7 m range a
relatively abrupt decline, or “step” in the continuum persisted. We
believe this step to be due to a real physical decline in the
quasi-continuum of the ejecta, and is not due to the fact that the
, spectra were taken at different times and with different
instrument settings. Our reasons are, firstly, the spectra
covered wavelengths up to 1.5 m and the beginning of the “step”
is clearly present in these data alone. Secondly, the step can be
seen in the spectra taken at the AAT (Paper II) and at CTIO (Elias et
al. 1991) at 1000 days, and in the day 1445 spectrum of Bautista
et al. (1995).
To finally flux-calibrate the de-contaminated spectra we
proceeded as follows. First we edited out the narrow lines, producing
observed “pure-ejecta” spectra, . For the
low-resolution grism spectra, this could only be done very
approximately. However, the CSM line contribution to the flux in the
wavelength region covered by the grism (1.2–2.1 m) was probably
small. This can be deduced by considering the CSM line fluxes
(Table 3) at earlier epochs (days 1469–2112) when these lines were
more clearly resolved. Comparison with contemporary pure-ejecta
band magnitudes obtained at CTIO (Suntzeff private
communication) or with the empirical spectral model matches
(Figs. 3–5) (see below) indicates that the CSM contribution was
probably less than 20% of the total during this earlier phase, and
showed little sign of increasing with time. We believe it is highly
unlikely that a sudden rapid increase in the CSM contribution occurred
by day 3000.
We then scaled the individual regions of the spectra to match the contemporary CTIO photometry. To find the scaling factors, we determined the true ejecta spectrum, , using the relation
| (1) |
where is the ejecta magnitude provided by Suntzeff, and
is the filter transmission function. is the
magnitude zero point given by
where is the flux of Vega derived from the Kurucz
stellar atmosphere models (Kurucz 1993) using = 9,400 K and
log = 3.9. Adopting 0.0 as the magnitude of Vega (Elias
et al. 1982), was determined for each band and
epoch. The scaling factor, , was then obtained from
.
To check the flux calibration procedure described above, we
carried out the following test. The day 1734 spectra were
acquired under photometric conditions with good seeing, in a wide
(5.8 arcsec) slit. Therefore it was reasonable to assume that the
whole of the SN 1987A light and an uncertain amount of the Star 3
light were blended within the slit, and that the flux calibration via
the spectrophotometric standard was reliable. We then edited out all
the circumstellar lines from the reduced, standard-fluxed spectrum,
yielding an unvignetted ejecta spectrum, but still blended an unknown
(vignetted) fraction of the Star 3 continuum. We then scaled and
subtracted a blackbody representation of Star 3, with the scaling
adjusted so that, when multiplied by the CTIO filter function, the
resulting SN 1987A ejecta spectrum matched the CTIO photometry. We
found that the flux of the ejecta spectrum produced in this way
differed from that obtained by the “flat-continuum” procedure by
less than 5%. We concluded that the “flat-continuum” procedure was
reliable, and so we applied the method to all the spectra. The
factors by which the continuum-flattened spectra had to be scaled to
match the photometry ranged from 0.3 to 2.3,
indicating the severity of the effects discussed above. Including
uncertainties in the Star 3 subtraction, we estimate the final
absolute fluxing of the ejecta spectra to be accurate to better than
40%. The final spectra are shown in Figures 1–7.
We now turn briefly to the final fluxing of the CSM lines. We first consider the CSM spectra obtained in the higher resolution echelle mode. While uncertainties in the continuum was not a problem here, it was important to consider the effect of the extent of the ring (1.2 arcsec in the dispersion direction). The echelle spectra were obtained with a wide slit (5.8 arcsec). In addition, all spectra were extracted from a region of 3.2 arcsec. It is likely, therefore, that any vignetting of the CSM flux was small. Possible narrow line contamination from the Be Star 3 was checked by inspection of unpublished NICMOS observations of this star taken on day 4130 (P. Challis & P. Garnavich, private communication). This showed that the contribution to the narrow He I 1.083 m line was less than 12%. We concluded that narrow line contamination was negligible. Thus, the errors in the CSM line fluxes would be mostly of the same origin as those present in the post-flattened ejecta spectra (e.g. variable extinction). Consequently we corrected the CSM line fluxes using the same scaling factors, , as for the ejecta spectra. We judge the precision in the final CSM spectra to be better than 40%. Owing to S/N problems (see above), the echelle spectra were obtained with a narrow slit (1.4 arcsec). Together with the effect of the typical 1.0–1.5 arcsec seeing, and pointing errors, this meant that quite significant vignetting of the CSM light probably occurred in the observations. We judge that as much as half the CSM light could have been “lost” in this way. Thus, while we also applied the scaling factor to the CSM spectra, the effects of vignetting means that the CSM fluxes are very uncertain. For the last two epochs (days 2952 and 3158), not only was a narrow (1.6 arcsec) slit used, but the low resolution of the grism produced strong blending of the CSM and ejecta spectra. Consequently, no attempt has been made to extract CSM line fluxes for these last two epochs.
| Date | Epoch | Spectral | Spectral | Slit Width | Seeing |
|---|---|---|---|---|---|
| (days) | Range (Å) | Resn. () | (arcsec) | (arcsec) | |
| 02 Nov 1990 | 1348 | 10690-13400 | 220 | 5.9 | 1.5 |
| 03 Mar 1991 | 1469 | 8955-15120 | 385 | 5.8 | 1.0-3.0 |
| 06 May 1991 | 1533 | 14320-24450 | 350 | 1.4 | 1.0 |
| 23 Nov 1991 | 1734 | 14550-24670 | 350 | 1.4 | 1.0 |
| 24 Nov 1991 | 1735 | 9035-15110 | 270 | 5.8 | 1.0 |
| 19 Feb 1992 | 1822 | 14720-24500 | 350 | 1.4 | 1.5 |
| 20 Feb 1992 | 1823 | 9005-15050 | 270 | 5.8 | 1.0-3.0 |
| 05 Dec 1992 | 2112 | 9048-14326 | 185 | 5.8 | 1.0 |
| 05 Dec 1992 | 2112 | 14690-24320 | 350 | 1.4 | 1.0 |
| 25 Mar 1995 | 2952 | 12250-21134 | 120 | 1.6 | 1.3-2.5 |
| 17 Oct 1995 | 3158 | 12250-21110 | 120 | 1.6 | 1.2 |


3 Overview of the spectra
The spectra (Figs. 1–7) comprise broad resolved emission lines from the ejecta and narrow unresolved emission lines from the circumstellar ring, superimposed on a continuum. The continuum is roughly flat within most wavelength bands, but fades over the range 1.4–1.7 m by a factor of 10 on day 1533, and 2–4 on days 1734, 1822 and 2122. As already indicated, we attribute the continuum to a blend of weak lines produced by the down-conversion of UV photons following absorption/emission by metals.
3.1 Line identification and measurement
While it was straightforward to identify and measure the strongest or
most isolated lines (e.g. the He I 1.083 m CSM line), most of the
features comprised blends of lines from the ejecta and CSM and/or from
different species. Therefore, in order to identify and measure the
component lines, we proceeded as follows. Preliminary ejecta line
identification was performed by selecting plausible candidate species
from the line identifications of Paper II and from the theoretical
predictions of dKLM98 and Kozma & Fransson (1998a,b)
(KF98a,b). Likewise, we used the work of Lundqvist & Sonneborn (2001)
to provide suggestions for the CSM line identifications. Then, in
order to confirm the line identifications and to measure the
intensities, widths and wavelength shifts, we matched an empirical
spectral model to the data. In this model, the continuum was
represented by applying a smoothed spline fit to regions of the
observed spectra which were clear of discrete emission
features. Emission features were then superimposed on this continuum.
These were selected using the aforementioned identification sources.
Their profiles were represented using Gaussian profiles with the peak
value as one of the free parameters.
For the CSM lines, we assumed that the lines were redshifted
by +289 km/s (Heathcote et al. 1991), and that their widths were defined
by the prevailing spectral resolution. This resolution was measured
from the strong He I 1.083 m CSM line for the spectra, and
the He I 2.058 m CSM line for the spectra (cf.
Section 2). Within the [Fe II] multiplets (see below), the relative
line intensities were derived by assuming that the population
distribution within the upper term was determined by the Boltzmann
distribution at 3000 K. While the CSM temperature was probably
somewhat higher than this, it would have a negligible effect on the
distribution within the small energy range of a term. For the [S III]
CSM lines, direct measurement of the line intensities was judged to be
more reliable than use of the model matches.
The empirical model ejecta line intensities, wavelength
positions and widths were all allowed to vary under certain
constraints. For a particular species (e.g. [Fe II]),
individual linewidths and wavelength shifts were always set to be the
same in velocity space. For the [Si I] and [S I] multiplets (see
below), the components of each multiplet had the same upper level and
so the intensity ratios of a given multiplet were found simply from
the A-values and statistical weights alone. Given the uncertainty in
the excitation conditions, determination of some of the intensity
ratios within the [Fe I] and [Fe II] multiplets was less
straightforward since some lines arose from different upper levels.
In practice, to estimate the intensities of the other components we
simply used the same multiplet ratios as for the CSM, adopting
T=3000 K. While this may have produced inappropriate relative
intensities for some lines, it is likely that most of the weaker lines
made only a minor contribution to the spectrum. We also note that for
the most significant line ratio viz. /, the components (which are actually members of
different multiplets) arose from the same upper level, and so could be
estimated from the A-values and statistical weights alone. Matching
was guided primarily by the absolute intensity of the dominant
component in a given multiplet. For each observed spectrum, the
spectral model was varied until a visually satisfactory match to the
observed spectrum was achieved.
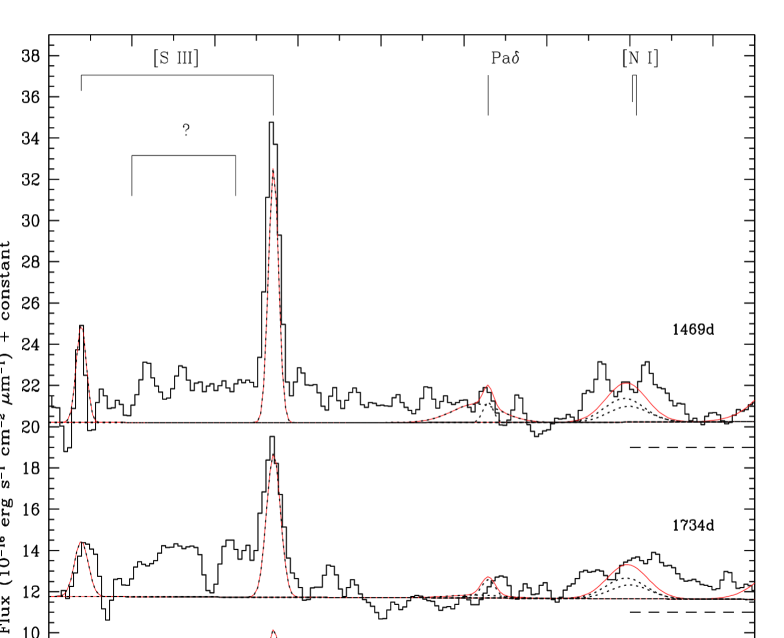
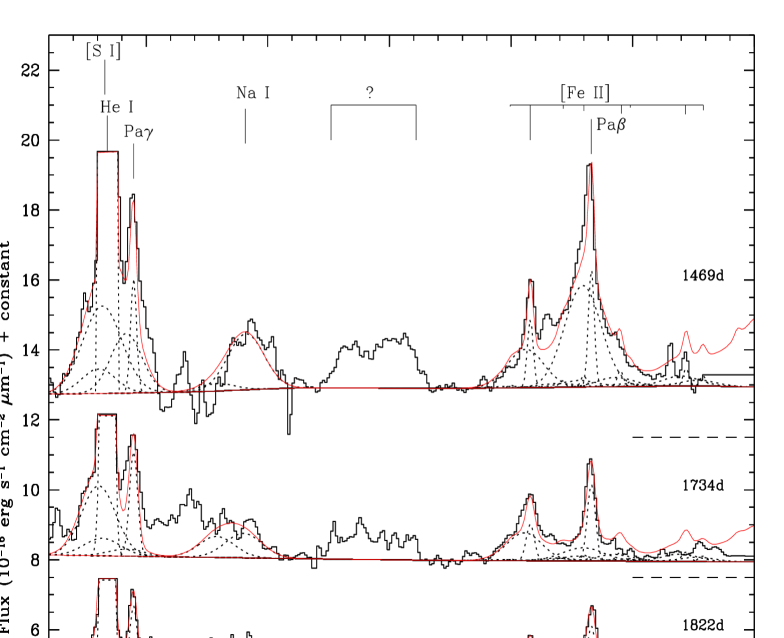
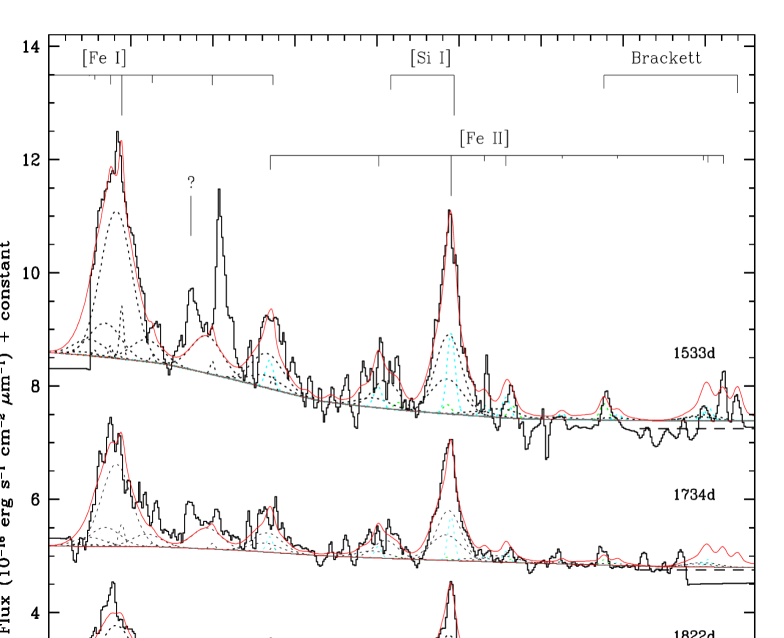
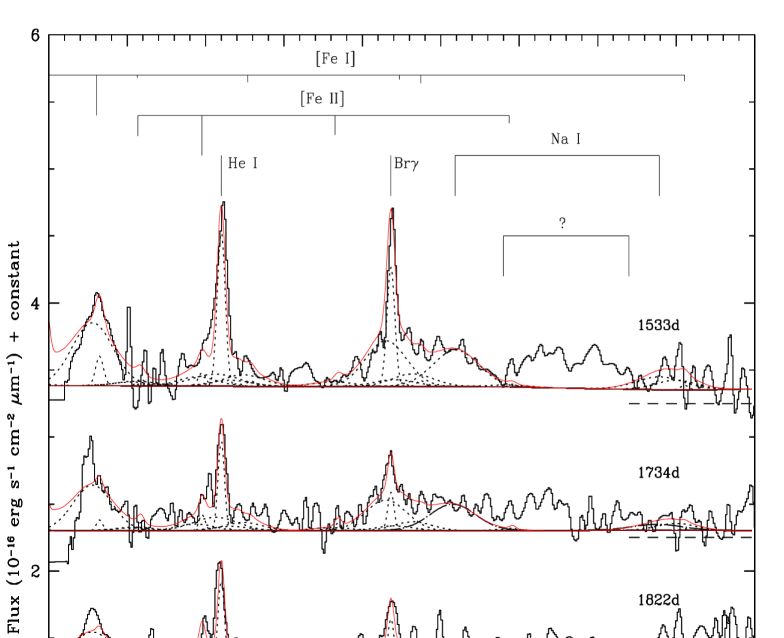
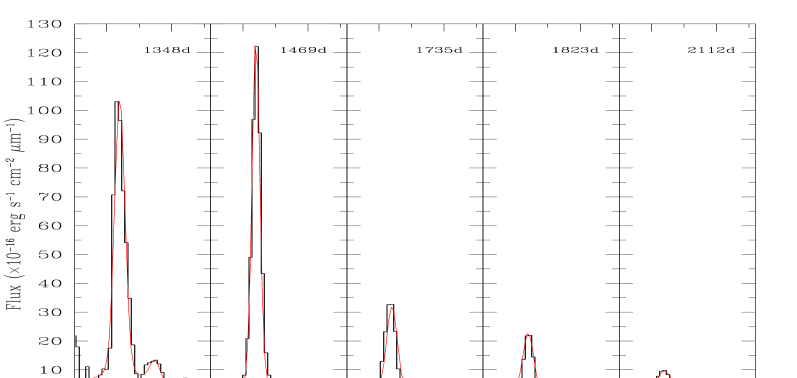
The model matches for epochs 1469 to 2112 are shown in Figures 2–5. Also shown (dotted lines) are the individual lines that make up each blend. It can be seen that some of the spectral features comprise quite complicated blends of ejecta and CSM lines. Details of the line parameters for the ejecta and CSM are given in Tables 2 and 3 respectively. In Table 2, Column 3 gives the displacement (in velocity space) of the line peak with respect to the wavelength of the identified line in the SN 1987A rest frame (redshift = +289 km/s). Column 4 gives the linewidths (FWHM), again in terms of equivalent velocity. The precision in the absolute intensities of the well-matched lines approaches that of the spectral fluxing precision (Section 2), with even higher accuracy for relative intensities within a single-band spectrum. However, in many cases the matching is more approximate with consequently poorer line intensity accuracy. This tends to be an increasing problem at later epochs. To assess the precision of a line intensity given in Table 1 or 2, the reader is advised to examine the quality of the model matches in the spectral plots (Figs. 2–5). Model matches were carried out only up to day 2112. The spectra for days 2952 and 3158 were judged to be of too low resolution and S/N to provide useful constraints on the model parameters. We therefore simply present these spectra, in Figure 6, compared with the final echelle spectrum taken on day 2112.
| Epoch | Line shift | Line width | Intensity | Identification | ||
| (days) | (m) | (km/s) | FWHM | (erg | (m) | |
| (km/s) | s-1cm-2) | |||||
| 1469 | 1.0805 | -400 | 4550 | 120 | [S I] 3p4 3P–3p4 1D(1F) | 1.0820 |
| 1734 | 1.0805 | -400 | 4550 | 350 | ||
| 1822 | 1.0805 | -400 | 4550 | 90 | ||
| 2112 | 1.0805 | -400 | 4550 | 25 | ||
| 1469 | 1.0820 | -550 | 5200 | 500 | He I 2s3S–2p3Po | 1.0830 |
| 1734 | 1.0820 | -550 | 5200 | 95 | ||
| 1822 | 1.0820 | -550 | 5200 | 160 | ||
| 2112 | 1.0820 | -550 | 5200 | 75 | ||
| 1469 | 1.0918 | -800 | 4150 | 270 | H I Pa | 1.0938 |
| 1734 | 1.0918 | -800 | 4700 | 35 | ||
| 1822 | 1.0918 | -800 | 4700 | 35 | ||
| 2112 | 1.0922 | -700 | 4700 | 35 | ||
| 1469 | 1.1290 | -400 | 4550 | 40 | [S I] 3p4 3P–3p4 1D(1F) | 1.1306 |
| 1734 | 1.1290 | -400 | 4550 | 110 | ||
| 1822 | 1.1290 | -400 | 4550 | 30 | ||
| 2112 | 1.1290 | -400 | 4550 | 8 | ||
| 1469 | 1.1415 | 60 | 4650 | 300 | Na I 3p2Po–4s2S (3) | 1.1397 |
| 1734 | 1.1415 | -200 | 4650 | 130 | ||
| 1822 | 1.1415 | -200 | 4650 | 210 | ||
| 2112 | 1.1415 | -200 | 4650 | 115 | ||
| 1469 | 1.2560 | -450 | 4200 | 210 | [Fe II] a6D9/2–a4D7/2 | 1.2567 |
| 1734 | 1.2555 | -570 | 4050 | 145 | ||
| 1822 | 1.2560 | -450 | 4200 | 115 | ||
| 2112 | 1.2560 | -450 | 4200 | 75 | ||
| 1469 | 1.2790 | -800 | 4400 | 550 | H I Pa | 1.2818 |
| 1734 | 1.2800 | -800 | 4700 | 80 | ||
| 1822 | 1.2790 | -800 | 4700 | 75 | ||
| 2112 | 1.2800 | -700 | 4700 | 80 | ||
| 1469 | 1.4410 | -700 | 4650 | 620 | [Fe I] a5D4–a5F5 | 1.4430 |
| 1734 | 1.4410 | -700 | 4400 | 330 | ||
| 1822 | 1.4410 | -700 | 4650 | 200 | ||
| 2112 | 1.4410 | -700 | 4400 | 250 | ||
| 1469 | 1.6051 | -600 | 3400 | 100 | [Si I] 3p3P1–3p1D2 (0.01F) | 1.6068 |
| 1734 | 1.6051 | -600 | 3200 | 60 | ||
| 1822 | 1.6051 | -600 | 3000 | 60 | ||
| 2112 | 1.6051 | -600 | 3000 | 20 | ||
| 1469 | 1.6437 | -600 | 3400 | 280 | [Si I] 3p3P2–3p1D2 (0.01F) | 1.6454 |
| 1734 | 1.6437 | -600 | 3200 | 165 | ||
| 1822 | 1.6437 | -600 | 3000 | 165 | ||
| 2112 | 1.6437 | -600 | 3000 | 55 | ||
| 1469 | 1.6426 | -450 | 4200 | 150 | [Fe II] a4F9/2–a4D7/2 | 1.6435 |
| 1734 | 1.6420 | -550 | 4050 | 100 | ||
| 1822 | 1.6426 | -450 | 4200 | 85 | ||
| 2112 | 1.6426 | -450 | 4200 | 55 |
NOTE: Uncertainties in Line shifts and Line widths are typically 200 km/s and 500 km/s respectively. The precision in the absolute intensities of the well-matched lines is about 35%, with higher accuracy for relative intensities within a single-band spectrum. However, where the matching is poorer the error in the line intensities is consequently larger. This tends to be an increasing problem at later epochs. To assess the precision of a line intensity given in the Table, the reader is advised to examine the quality of the model matches in the spectral plots (Figs. 2–5).
| Epoch | Line shift | Line width | Intensity | Identification | ||
| (days) | (m) | (km/s) | FWHM | (erg | (m) | |
| (km/s) | s-1cm-2) | |||||
| 1469 | 1.9777 | -700 | 4650 | 155 | [Fe I] a5F5–a3F4 | 1.9804 |
| 1734 | 1.9777 | -700 | 4400 | 110 | ||
| 1822 | 1.9777 | -700 | 4650 | 80 | ||
| 2112 | 1.9777 | -700 | 4400 | 25 | ||
| 1469 | 2.0446 | -450 | 4200 | 20 | [Fe II] a4P5/2–a2P3/2 | 2.0457 |
| 1734 | 2.0437 | -550 | 4050 | 15 | ||
| 1822 | 2.0446 | -450 | 4200 | 10 | ||
| 2112 | 2.0446 | -450 | 4200 | 6 | ||
| 1469 | 2.0561 | -550 | 5200 | 35 | He I 2s1S–2p1Po | 2.0580 |
| 1734 | 2.0561 | -550 | 4900 | 35 | ||
| 1822 | 2.0561 | -550 | 5200 | 35 | ||
| 2112 | 2.0561 | -550 | 5200 | 8 | ||
| 1469 | 2.1650 | -450 | 4250 | 110 | H I Br | 2.1661 |
| 1734 | 2.1650 | -450 | 4250 | 75 | ||
| 1822 | 2.1650 | -450 | 4250 | 35 | ||
| 2112 | 2.1650 | -450 | 4250 | 15 | ||
| 1469 | 2.2095 | 60 | 4650 | 100 | Na I 4s2S–4p2Po | 2.2070 |
| 1734 | 2.2075 | -200 | 4650 | 70 | ||
| 1822 | 2.2075 | -200 | 4650 | 50 | ||
| 2112 | 2.2075 | -200 | 4650 | 25 |
NOTE: Uncertainties in Line shifts and Line widths are typically 200 km/s and 500 km/s respectively. The precision in the absolute intensities of the well-matched lines is about 35%, with higher accuracy for relative intensities within a single-band spectrum. However, where the matching is poorer the error in the line intensities is consequently larger. This tends to be an increasing problem at later epochs. To assess the precision of a line intensity given in the Table, the reader is advised to examine the quality of the model matches in the spectral plots (Figs. 2–5).
| Epoch | Intensity | Identification | |
| (days) | (erg | (m) | |
| s-1cm-2) | |||
| 1469 | 120(s) | [S III] | 0.9069 |
| 1734 | 135(s) | ||
| 1469 | 490(s) | [S III] | 0.9532 |
| 1734 | 265(s) | ||
| 1348 | 3900 | He I 2s3S–2p3Po | 1.0830 |
| 1469 | 3600 | ||
| 1734 | 1200 | ||
| 1822 | 900 | ||
| 2112 | 530 | ||
| 1348 | 280 | H I Pa | 1.0938 |
| 1469 | 100 | ||
| 1734 | 124 | ||
| 1822 | 95 | ||
| 2112 | 60 | ||
| 1469 | 60 | [Fe II] a6D9/2–a4D7/2 | 1.2567 |
| 1734 | 45 | ||
| 1822 | 30 | ||
| 2112 | 20 | ||
| 1348 | 340 | H I Pa | 1.2818 |
| 1469 | 100 | ||
| 1734 | 90 | ||
| 1822 | 70 | ||
| 2112 | 65 | ||
| 1469 | 90 | [Fe II] a4F9/2–a4D7/2 | 1.6435 |
| 1734 | 40 | ||
| 1822 | 30 | ||
| 2112 | 15 | ||
| 1469 | 6 | [Fe II] a4P5/2–a2P3/2 | 2.0459 |
| 1734 | 6 | ||
| 1822 | 10 | ||
| 2112 | 4 | ||
| 1469 | 70 | He I 2s1S–2p1Po | 2.0581 |
| 1734 | 35 | ||
| 1822 | 30 | ||
| 2112 | 20 | ||
| 1469 | 55 | H I Br | 2.1661 |
| 1734 | 15 | ||
| 1822 | 20 | ||
| 2112 | 15 |
NOTE: The precision in the absolute intensities of the well-matched -band lines is about 35%, with higher accuracy for relative intensities within a single-band spectrum. However, where the matching is poorer the error in the line intensities is consequently larger. This tends to be an increasing problem at later epochs. To assess the precision of a line intensity given in the Table, the reader is advised to examine the quality of the model matches in the spectral plots (Figs. 2–5). Vignetting problems in the -band CSM spectra (see text) means that the error in intensities is considerably larger than in the -band (see text). (s) denotes that the fluxes were measured directly from the observations.
3.2 The ejecta lines
For the epochs covered by the echelle spectra (days 1469–2112), the most prominent ejecta emission features included H I (Pa, Pa, Br), He I 1.08, 2.06 m, Na I 1.14, 2.21, 2.34 m, [Si I] 1.61, 1.65 m, [Fe I] 1.44, 1.98 m and [Fe II] 1.26, 1.64, 2.05 m. [S I] 1.08, 1.13 m may also be present, but strong blending with other lines renders this identification less positive. There were also regions of emission for which we were unable to find plausible identifications. These were at 0.92–0.95, 1.03–1.05, 1.17–1.21 and 2.24–2.32 m. The 1.03–1.05 m feature may be caused partly by [N I] 1.04 m. However, the width and shape of the feature indicates that there must be contributions from other species. The 1.17–1.21 m feature is particularly interesting in that it has persisted from as early as day 112 (Paper I). In Papers I and II we attributed this feature to a blend of allowed lines of Mg I, Si I and K I. However, its relatively unchanging shape between days 112 and 1822 prompts us to question if it really is a blend of different species. We also note that the 2.24–2.32 m emission lies in the same wavelength region as an unidentified feature discussed in Paper II.
3.3 The CSM lines
The principal CSM features were due to H I (Pa, Pa, Br), He I 1.08, 2.06 m, [S III] 0.91, 0.95 m and [Fe II] 1.26, 1.646, 2.05 m. Of particular note is the very strong He I 1.083 m line which contributes 20% of the total (ejecta+CSM) band flux on day 1469 and 13-11% on days 1734-2112 (Figure 7). We believe that [S III] 0.907, 0.953 m lines have never before been reported in a supernova spectrum. Their presence in the spectra of days 1469 and 1734 is particularly convincing. The lines are less apparent in the day 1822 and 2112 spectra due to the fading flux and the poorer observing conditions at these epochs. We have also included narrow line profiles for the [Fe I] 1.443, 1.98 m (and the other lines of these multiplets). This line was not anticipated in the work of Lundqvist & Sonneborn (2001). However, the observed line profile shape on day 1533 in these wavelength regions led us to suspect that CSM [Fe I] emission may be making a small contribution to these features. At later epochs, the presence of [Fe I] emission from the CSM is much less convincing. Finally, we note the presence of an unidentified narrow feature at a wavelength of 1.485 m (after blueshifting by 289 km/s) on days 1533 and 1734.
4 Discussion
4.1 The Physical Framework
The CSM spectra will be discussed elsewhere. Here we confine our
discussion to the ejecta spectra. The framework for this section is
based upon theoretical descriptions of the physical conditions in the
ejecta and line strength predictions at very late times provided by
Kozma & Fransson (1992), Fransson & Kozma (1993), Fransson, Houck &
Kozma (1996) (FHK96), C97, dKLM98, and KF98a,b. While dKLM98 evolve
their model to only 1200 days (i.e. 150 days prior to the
beginning of our observations) their results are still relevant to the
earlier part of the era considered here. KF98a follow the temperature
and ionisation evolution of their model to 2000 days, covering a
significant portion of our era, but their line emission calculations
(KF98b) stop at 1200 days. C97 consider the much later epoch of
day 2875, which is near the end of our era.
During the era of the observations described here, the
SN 1987A ejecta spectrum is produced in a rather exotic manner. The
energy source of the nebula is the radioactive decay of a number of
species created in the explosion (Woosley, Pinto & Hartmann 1989;
Timmes et al. (1996)). These include 56Co, 57Co, 60Co,
44Ti and 22Na. All emit -rays. In addition,
56Co, 44Ti and 22Na emit energetic positrons and
60Co emits energetic electrons. By day 1348, the most
significant energy sources were 57Co and 44Ti, contributing
about one half and one quarter respectively of the deposited energy
(Li, McCray & Sunyaev 1993; Timmes et al. 1996). Around day 1565,
the dominant source of deposited energy became 44Ti and by about
day 2000 more than half the deposited 44Ti energy was in the form
of positrons. It is generally assumed that positrons are deposited
“on the spot”. Consequently, given the year lifetime of
44Ti, this means that once positron deposition is dominant, the
rate of energy deposition approaches a constant value of
erg/s per M⊙ of synthesised
44Ti (Woosley et al. 1989).
In order to reproduce the observed spectra and evolution of
SN 1987A at late times, C97, dKLM98 and KF98a,b begin with model
nebulae having a number of zones of differing chemical composition.
These zones are arranged so as to reflect the strong, deep macroscopic
mixing in SN 1987A for which there is a great deal of evidence (e.g. Arnett 1988, Pinto & Woosley 1988, Shigeyama, Nomoto &
Hashimoto 1988, Woosley 1988, Haas et al. 1990, Spyromilio,
Meikle & Allen 1990, Fassia & Meikle 1999). Light elements (H, He)
are mixed down to low velocities, and iron group elements are mixed up
to high velocities. C97, dKLM98 and KF98a,b introduce this mixing in
different ways. However, they all invoke a macroscopically mixed
“core” lying within 2000 km/s. (dKLM98 refer to the inwardly
mixed H/He zones as the “inner envelope”.) The core thus contains
zones that are H-rich, He-rich, intermediate-element-rich, and
iron-group-rich, with the nebula being bathed in the radioactive decay
energy. The core is generally of mass 4–6 M⊙. In addition,
C97 and KF98a,b include an outer H-envelope of mass 10 M⊙
extending out to a velocity of 6000–7000 km/s.
In general, the fraction of the radioactive decay energy that does not directly escape from the nebula is injected into the nebular material via Coulomb interaction with the positrons and Compton-scattered electrons. The energy of the resulting non-thermal high energy electrons then goes towards excitation, ionisation and heating of the nebula (KF98a). Three effects play important roles in the evolution of the temperature and ionisation at the very late times considered here. These are the ionisation/thermal “freeze-out” effect, adiabatic cooling, and the “IR-catastrophe”. The first two are important in the H/He envelope, while the third plays an important role in the metal-rich core.
4.1.1 Freeze-out
The ionisation freeze-out effect was suggested originally by Clayton et al. (1992) and by Fransson & Kozma (1993). These authors pointed out that as the SN evolves, there will eventually come a time when the recombination timescale exceeds the radioactive or expansion timescale, so that the rate of change in the level of ionisation slows significantly. Once this phase is reached, the bolometric luminosity exceeds that of the instantaneous radioactive decay deposition, since some of the luminosity results from recombination following ionisation at a significantly earlier epoch. In the model of KF98a,b the ionisation freeze-out phase begins at 800–900 days in most zones, but has a more pronounced effect on the luminosity in the H/He envelope. However, in their “inner-envelope” model, dKLM98 find that the freeze-out does not occur until much later than this. Instead, they identify a “thermal freeze-out” where the radiative cooling timescale exceeds that of the expansion timescale. In their model, this occurs before the ionisation freeze-out but, as with ionisation freeze-out, results in a luminosity exceeding that of the instantaneous radioactive decay deposition. There is general agreement that by day 1200, the ejecta are predominantly neutral, but with a fraction of singly-ionised species resulting from the ionisation freeze-out and/or direct ionisation by non-thermal electrons. During 1350–2000 days the electron fraction is in the H-envelope, rising to 0.1 in the Fe-He zone (KF98a). At 3425 days, Lundqvist et al. (2001) calculate that the fraction of iron that is singly-ionised, is in the range 0.2–0.4.
4.1.2 Adiabatic cooling
The adiabatic cooling becomes significant when the radiative cooling timescale becomes longer than the expansion timescale. For pure adiabatic cooling, T. Owing to their lower density and metallicity, adiabatic cooling is already dominant as early as 250 days in the H-envelope and 800 days in the He-envelope (KF98a). For the H/He zones within the core, the higher densities mean that adiabatic cooling begins to dominate at 800-1000 days. While fine-structure line cooling (cf. IR catastrophe below) becomes the dominant radiative cooling mechanism in these zones, it never supersedes adiabatic cooling. Nevertheless, fine-structure line cooling may be significant in these regions (C97). KF98a find that the H-envelope temperature lies in the range 400-1000 K on day 1350, falling to a range of 150–300 K by day 2000. The temperatures of the H/He zones within the core fall from 900 K to 300 K over the same period. The day 2000 KF98a value compares well with the 300 K derived from the Balmer continuum by Wang et al. (1996) for about the same time. The model of C97 yields 130 K for the H-envelope at 2875 days, compared with 350100 K derived from the Balmer continuum at that time.
4.1.3 The IR catastrophe
Once the nebular heating/cooling rate drops below a certain level,
cooling via low-lying fine-structure transitions dramatically
overtakes optical and near-IR transitions as the dominant radiative
cooling mechanism. Consequently the stabilising temperature falls
abruptly from 2000 K to a few K, and the bulk of the
nebula’s luminosity shifts to far-IR emission. This effect is known
as the “IR Catastrophe”, and was predicted by Axelrod (1980) in his
pioneering work on type Ia spectral models. Fransson & Chevalier
(1989) predicted that it could also occur in core-collapse SNe such as
SN 1987A. The first direct evidence for this phenomenon occurring in
SN 1987A was obtained through the detailed study of the evolution of
the near-IR/optical [Fe II] lines during the second year (Spyromilio
& Graham 1992).
In the dense, metal-rich zones, fine-structure radiative
cooling dominates for a considerable time. [Fe II] 26 m emission
is particularly important. Fine-structure cooling is most pronounced
in the Fe-rich zones (KF98a), where it commences at 500 days at
2700 K. According to KF98a, by the beginning of our observations
(1348 days) the temperature in the Fe-He zone had fallen to
K, where it remained until 2000 days, after which adiabatic
cooling became important. The IR catastrophe is also important for the
intermediate mass element zones, where the temperature at 1350 days is
200–400 K, falling to 100–200 K by day 2000 (KF98). Both FK98b and
dKLM98 find that, owing to the IR-catastrophe, [Fe II] 0.72, 1.26,
1.53, 1.64 m lines originating from the newly-synthesised iron in
the core should have vanished by 600 days. However, detectable
flux in these lines persists beyond this epoch. FK98b and dKLM98
attribute this to thermally-excited emission from primordial iron in
the H-He envelope where the temperature remains above 2000 K
until after day 1000. However, as indicated above, by 1350 days, the
temperature in the H-He zone is below 1000 K and so thermally excited
emission from these lines should be undetectable.
4.2 Near-IR ejecta lines at very late times
We can use the observed near-IR spectra to examine the physical scenario described above. The evolution of the intensities of the principal ejecta lines is illustrated in Figure 8.

4.2.1 Hydrogen Lines: Pa, Pa, Br
The intensity and evolution of the H-lines in the adiabatic cooling
phase is calculated by dKLM98 and KF98b up to 1200 days. For epochs
years, non-thermal ionisation from the ground state by
Compton-scattered electrons dominates photoionisation from excited
states (C97, KF98b). Non-thermal excitations are also important at
epochs beyond 1000 days (KF98b). dKLM98 find that by day 800 the line
ratios should be Case B. FK98b reach a similar conclusion, but with
the transition to Case B in the core being a little later, at about
1000 days, being complete by day 1200. Thus, during our era, the
H-spectrum is predicted to consist of a mixture of a low-temperature
Case B H-recombination spectrum together with a contribution from
direct non-thermal excitation (see KF98b for details). Line light
curves are given by dKLM98 and KF98b for the near-IR lines
Pa,, Br,,,. dKLM98 find
that, for the well-observed near-IR H-lines Pa and Br,
their models makes satisfactory predictions to 1200 days. This is in
spite of their non-inclusion of the envelope with its delayed
recombination effects. The KF98b model light curve for Br,
which includes delayed recombination effects in the envelope, is also
in good agreement with the observations. Their model indicates that,
by day 1200, the H-envelope is responsible for 70% of the
Br flux, and that this fraction is growing. Both Fransson et
al. (1996) and dKLM98 point out that derivation of total H-mass from
the H-lines is difficult and subject to large uncertainties. Fransson
et al. (1996) and KF98b make use of the line profiles in order to find
the most appropriate model (and hence the mass of H). (In a sense, C97
also make use of the observed velocity distribution in determining the
H-mass).
We examined the ejecta H-line fluxes to see if they yield the predicted low-temperature Case B ratios. These were first de-reddened assuming (Blanco et al. 1987). We find that the observed, de-reddened intensity ratio for days 1469, 1734, 1822. Martin (1988) predicts a value of 0.5 for a temperature of 200–1000 K. Given the uncertainty in the relative line intensities, we judge that the observed ratios are consistent with the predicted values. The uncertainties in the model matching are too large to make a useful judgement about the ratio on epoch day 2112. Martin (1988) also predicts =0.195. This is in fair agreement with the observed, de-reddened ratio of 0.18 on day 1469. Apparently poorer agreement is obtained on subsequent days. However, this is probably again due to model matching uncertainties, especially in the -window. We conclude that, at least up to 1800 days, the observed H-spectra are consistent with the scenario of non-thermal ionisation/excitation within an environment dominated by adiabatic cooling.
4.2.2 Helium Lines: He I 1.083, 2.058 m
As for hydrogen, theoretical considerations indicate that
post-1000 day He-lines evolve in an environment where the temperature
is dominated by adiabatic cooling, and the lines are driven by (a)
non-thermal direct excitation, and (b) recombination following
non-thermal ionisation. dKLM98 and KF98b point out that the
2.058 m line is uncontaminated by other ejecta species throughout
the observations, and also find that it is optically thin in all
regions after 700 days. Moreover, after 700 days, the
2.058 m line intensity is relatively insensitive to assumptions
made about the He I 584 Å continuum destruction probability
(KF98b). These considerations lead dKLM98 & KF98b to suggest that the
post-600 day He I 2.058 m line can provide the best measure of
the total helium mass. However, consideration of our spectra leads us
to a more pessimistic view of the usefulness of the 2.058 m line
in this situation. By day 1533, it was quite faint. To make matters
worse it is blended with comparably-strong CSM flux in this line.
Moreover, He I 2.058 m lies in a bad part of the atmospheric
window. Consequently there is large uncertainty in the He I
2.058 m line flux. dKLM98 show that their model 2.058 m
light curve provides a good match to the observations up to 1100 days.
The KF98b light curve match is somewhat poorer, with a flux
overproduction of about 40% between days 800 & 1100. The
2.058 m light curves of both dKLM98 and KF98b stop at 1200 days,
but suggest a gradual slowing down. For the later epochs described
here, to within the uncertainties, the observed fluxes fall on a
plausible extrapolation of the dKLM98 model light curve, but continues
to fall below that of the (extrapolated) KF98b light curve.
dKLM98 & KF98b agree that the He I 1.083 m line is more difficult to use for the determination of helium abundance. It is more temperature sensitive, and is optically thick for much longer than is the case for He I 2.058 m. Indeed, KF98b find the 1.083 m line to be optically thick in the He I region even beyond 2000 days. However, high optical depth in the inner zones may not be too important since, after 1200 days, the 1.083 m emission from the H-zone is predicted to dominate (and was already optically thin at 700 days). KF98b also point out that there may be contamination due to [S I] 1.082 m. Our empirical model matches also indicate that [S I] 1.082 m emission may be present. However, this line is part of a multiplet, with another component lying at 1.13 m and having about 0.3 of the intensity. Examination of this part of the spectrum (in spite of it being in a bad part of the atmospheric window) indicates that [S I] 1.082 m makes, at most, a relatively minor contribution to the 1.08 m ejecta emission (see Fig. 3). We find that the observed fluxes of the He I 1.083 m line fall on plausible extrapolations of both the dKLM98 and KF98b model light curves.
4.2.3 Forbidden lines of neutral species: [Si I], [S I] [Fe I]
The low temperature (T400 K) of the electron gas in the
macroscopically-mixed core during the period of our observations
implies that thermally-excited near-IR ejecta lines of [Si I], [S I]
& [Fe I] should have faded below detectability. Yet, the [Si I] and
[Fe I] lines are quite clearly present during this very late phase.
(Strong blending makes the presence of the [S I] lines more
ambiguous.) In particular, the [Si I] 1.645 m and [Fe I]
1.443 m lines are visible to beyond day 2000. The persistence of
these lines provides valuable support for the proposition that, by
this era, these lines are produced either by recombination or through
direct excitation by non-thermal electrons.
The [Si I] 1.6 m multiplet is of particular interest
here. FHK96 point out that for this species, recombination to the
neutral state does not produce any significant line emission in the
optical or near-IR region. Consequently, the [Si I] 1.6 m
emission must be due entirely to direct excitation by non-thermal
electrons. An interesting consequence of this is that the line
luminosity will follow the instantaneous energy input, and will be
independent of the ejecta temperature. At very late times this is
dominated by the 100% absorption of 44Ti decay positrons. Thus,
if the 44Ti scenario is correct, the luminosity in these lines
should converge to a near-constant value. In Figure 8 we see that the
[Si I] 1.645 m line fades by about a factor of 3 between
days 1734/1822 and 2112. During this period, the radioactive energy
deposition is dominated by 44Ti and would fade by a factor of
about 1.5. Thus, to within the uncertainty in the line intensities,
the evolution of [Si I] 1.645 m is consistent with the
radioactive decay and energy deposition being dominated by 44Ti
decay at these late times. We note that FHK96 also show that lines
which are driven purely by non-thermal excitation, such as the
[Si I] 1.6 m multiplet, have the potential to provide reliable,
temperature-insensitive mass estimates, provided the line profile and
the bolometric luminosity is also known.
C97 suggest that, by day 2875, virtually the entire positron luminosity of the 44Ti is deposited in the Fe/Si-rich clumps. While cooling is mostly by ground-term fine-structure lines, about 10% (1035 erg/s) is via the UV-optical-NIR lines of neutral species. About 20% (of the erg/s) is emitted as identified UV lines of Fe I and Si I with a further 70% being down-converted to numerous allowed and forbidden optical/NIR metal lines, forming a quasi-continuum. Of the remaining erg/s, a substantial fraction flows into the [Si I] 1.6 m and [Fe I] 1.44 m near-IR multiplets. This appears to be supported by our low-resolution spectra (Figure 6) taken on days 2952 and 3158 where the [Fe I] 1.443 m and possibly the [Si I] 1.645 m features are still detected. The luminosity in just the [Fe I] 1.443 m line on day 2952 is about erg/s.
4.2.4 Forbidden Lines of singly-ionised iron
As with the neutral forbidden lines, the low temperature of the ejecta during the era considered here means that there would have been negligible thermal excitation of the [Fe II] 1.26, 1.64 m multiplets. This includes the excitation of primordial iron in the H-envelope since, as mentioned above, even there it is expected that the temperature would be less than 1000 K by day 1350 (KF98a). This suggests, therefore, that the persistence of the [Fe II] lines must be due to recombination or direct excitation by non-thermal electrons. However, we note that C97 state that near-IR [Fe II] lines produced by radiative cascade are expected to be weak since the major radiative cascade to the ground level goes through optical forbidden lines and FIR lines of the ground term. Detailed modelling is required to test if this is in conflict with our detection of these lines.
4.3 Velocity behaviour in the ejecta lines
The FWHM velocities of the more prominent ejecta lines are listed in
Table 2, Col. 4. The He I lines apparently exhibit the largest width,
at 5000 km/s (FWHM). However, the uncertainty in this
measurement is large due to strong blending of the He I ejecta lines
with CSM lines and/or other species. The H I lines and the [Fe I],
[Fe II] lines show widths of 4000–4500 km/s, while the [Si I] lines
have widths closer to 3000 km/s. Even this latter value is higher
than the 2000 km/s invoked for the macroscopically mixed core.
Of particular interest is the fact that the [Fe I] and [Fe II] lines
exhibit higher velocity widths than the [Si I] lines. We argued above
that the persistence of the forbidden iron line emission during the
era studied here must be driven by delayed recombination following
freeze-out or through direct excitation by non-thermal electrons.
Consequently, the high velocities in these lines imply that these
processes must be occurring well out into the H/He envelope. Detailed
modelling will be required to determine how much each process
contributes to the line emission. If we favour the latter scenario,
it immediately suggests that upward mixing was even greater than has
been assumed hitherto. We note that velocities of at least
3000 km/s were observed in the [Fe II] lines as early as the end
of year 1 (Paper I and Spyromilio et al. 1990, Haas et al.
1990). Moreover, Fassia & Meikle (1999) showed that the presence of
the He I 1.083 m line on days 76–135 implied that upward mixing
of 56Ni in the ejecta of SN 1987A had extended to velocities as
high as 3000–4000 km/s. Upward mixing of 56Ni to even higher
velocities (over 5000 km/s) has been recently deduced by Mitchell et
al. (2001) on the basis of the high strength of the Balmer lines a few
days after explosion. Such high 56Ni velocities may be evidence
of neutrino-instability-driven acceleration of radioactive nickel just
after the core-bounce (e.g. Herant, Benz & Colgate 1992).
Alternatively, these results may favour the jet-like explosion models
of Nagataki (2000), in which the high velocity [Fe II] line profiles
are well reproduced.
Another remarkable characteristic of these late-time spectra is the presence and persistence of blueshifts (with respect to the supernova rest frame) in the ejecta lines (Table 2, Col. 3), with values of typically –200 km/s to –800 km/s. Such shifts first appeared around day 600 (Paper II) and were attributed to the formation of dust, blocking out the red (far-side) wing of the line. With the persistence of the blueshifts to as late as day 2000 we conclude that very dense dust concentrations must have formed in the ejecta. However it is possible that asymmetry in the excitation conditions may also be contributing to the effect.
5 Summary
We have presented near-IR spectra of SN 1987A covering the period 3.7
and 8.6 years post-explosion. This is the first time that IR spectra
of a supernova has been obtained to such late epochs. We have
described the measures taken to remove contamination from the nearby
Stars 2 and 3. The resulting spectra comprise emission from both the
ejecta and the bright circumstellar ring. The contributions from
these two sources were separated out using an empirical spectral
model. The CSM emission lines comprise recombination lines of H I and
He I, and forbidden lines of [S III] and [Fe II]. The allowed ejecta
spectra include lines of H I, He I, Na I, [Si I], [Fe I], [Fe II] and
possibly [S I]. We are unable to confirm the presence of weak [Co I]
and [Co II] lines as suggested by Bautista et al. (1995) on
day 1445.
The intensity ratios and widths of the H I ejecta lines are
consistent with the predicted low-temperature Case B recombination
spectrum arising from non-thermal ionisation/excitation in an
extended, adiabatically cooled H-envelope. Owing to difficulties with
low signal-to-noise and CSM-ejecta blending, the He I 2.058 m
ejecta line is probably of less value than pure ejecta theory would
suggest.
Perhaps the most interesting result is the slow decline in
the ejecta forbidden lines. This is particularly important for the
[Si I] lines, since it supports the scenario that pure non-thermal
excitation was taking place, driven increasingly predominantly by the
decay of 44Ti. The data presented here offers the prospect of
improved abundance measurements of silicon in the ejecta.
The FWHM of the ejecta lines provide evidence that the
extensive mixing has occurred, with heavy elements reaching layers
with velocities as high as 3000-4500 km/s. The iron velocities
were particularly high, and may provide support for the
neutrino-instability fast-nickel scenario, or for a jet-like
explosion. The blueshifts of the ejecta lines that had appeared
around day 600 (Paper II) continued to be present. This probably
indicates that dense concentrations of dust persisted in the ejecta
even as late as day 2000. However, asymmetry in the excitation
conditions may also contribute to the observed blueshifts.
The spectra presented here are unique. It is likely to be many years before such late-time near-IR observations are obtained for another supernova. Moreover, with the increasing interaction of the ejecta with the circumstellar ring, these near-IR spectra are probably the last from the “pristine ejecta” of SN 1987A that can be obtained.
6 Acknowledgements
We dedicate this paper to the memory of the late David Allen. He
played a central role in the near-IR study of SN 1987A. He made
particularly vital contributions to the work described here, both as
project scientist for IRIS, and by carrying out most of the
observations. He is sorely missed.
We thank Mike Burton, Stuart Lumsden, Raylee Stathakis and Chris Tinney for carrying out some of the observations, and the staff of the AAO for their support. We also thank Nick Suntzeff, Peter Challis and Peter Garnavich for the use of their unpublished data, and Emma Bowers, Robert Cumming and Gian Varani for assistance with the data reduction. This work is supported through PPARC Grant No. PPA/G/S/1997/00266.
References
- [1] Allen D. A., Cragg T. A., 1983, MNRAS, 203, 777
- [2] Allen D. A., Barton J. R., Burton M. G., Davies H., Farrell T., Gillingham P., Lankshear A., Lindner P., Mayfield D., Meadows V., Schafer G., Shortridge K., Spyromilio J., Straede J., Waller L., Whittard D., 1993, PASAu, 10, 298
- [3] Arnett W. D., 1988, ApJ, 331, 337
- [4] Axelrod T., 1980, PhD thesis, University of California
- [5] Bailey J., Barton J. R., Conray P., Hillier D. J., Hyland A. R., Jones T. J., Shortridge K., Whittard D., 1988, PASP, 100, 1178
- [6] Bautista M. A., Depoy D. L., Pradhan A. K., Elias J. H., Gregory B., Phillips M. M., Suntzeff N. B., 1995, AJ, 109, 729
- [7] Blanco V. M., Gregory B., Hamuy M., Heathcote S. R., Phillips M. M., Suntzeff N. B., Terndrup D. M., Walker A. R., Williams R. E., Pastoriza M. G., Storchi-Bergmann T., Matthews J., 1987, ApJ, 320, 589
- [8] Chugai N., Chevalier R. A., Kirshner R. P., Challis P. M., 1997, ApJ, 483, 925 (C97)
- [9] Crotts A. P., Heathcote S. R., 1991, Nature, 350, 683
- [10] DeKool M., Li H., McCray R., 1998, ApJ, 503, 857 (dKLM98)
- [11] Elias J. H., Frogel J. A., Matthews K., Neugebauer G., 1982, AJ, 87, 1029
- [12] Elias J. H., Depoy D. L., Gregory B., Suntzeff, N. B., 1991, in “Supernova 1987A and other supernovae”, proceedings of an ESO/EIPC Workshop, eds Danziger I. J., Kjr, p293
- [13] Fassia A., 1999, PhD thesis, University of London
- [14] Fassia A., Meikle W. P. S., 1999, MNRAS, 302, 314
- [15] Fransson C., Houck J., Kozma C., 19996, in “Supernovae and supernova remnants”, Proceedings of the International Astronomical Union Colloquium 145, Cambridge University Press, eds McCray R., and Wang Z., p.211 (FHK96)
- [16] Fransson C., Kozma C., 1993, ApJ, 408, 25
- [17] Fransson C., Chevalier R. A., 1989, ApJ, 343, 323
- [18] Haas M. R., Colgan S. W. J., Erickson E. F., Lord S. D., Burton M. G., Hollenbach D. J., 1990, ApJ, 360, 257
- [19] Herant M., Benz W., Colgate S., 1992, ApJ, 395, 642.
- [20] Jakobsen P., Jedrzejewski R., Macchetto F., Panagia N., 1994, ApJ 435, L47
- [21] Kurucz R. L., 1993a, ATLAS9 Stellar Atmosphere Programs and 2 km s-1 grid, (Kurucz CD-ROM No. 13)
- [22] Kozma C., Fransson C., 1992, ApJ, 390, 602
- [23] Kozma C., Fransson C., 1998a, ApJ, 496, 946 (KF98a)
- [24] Kozma C., Fransson C., 1998b, ApJ, 497, 431 (KF98b)
- [25] Li L., McCray R., Sunyaev R. A., 1993, ApJ, 419, 824
- [26] Lundqvist, P., Sonneborn, G. 2001, in ASP Conf. Ser., SN 1987A: Ten Years After, ed. M. Phillips & N. Suntzeff (San Francisco: ASP), in press. (astro-ph/9707144)
- [27] Lundqvist P., Kozma C., Sollerman J., Fransson C., 2001, A& A, 374, 629
- [28] Martin P. G., 1988, ApJS, 66, 125
- [29] Meikle W. P. S., Spyromilio J., Allen D. A., Varani G. -F., Cumming R. J., 1993, MNRAS, 261, 535 (Paper I)
- [30] Meikle W. P. S., Allen D. A., Spyromilio J., Varani G. -F., 1989, MNRAS, 238, 193 (Paper II)
-
[31]
Meikle W. P. S., 2001, in ASP Conf. Ser., SN 1987A: Ten
Years After, ed. M. Phillips & N. Suntzeff (San Francisco: ASP), in
press. (Available from http://astro.ic.ac.uk/Research/stellar
/supernovae/publications/) - [32] Mitchell R. C., Baron E., Branch D., Lundqvist P., Blinnikov S., Hauschildt P. H., Pun S. J. C., ApJ, 556, 979
- [33] Nagataki S. 2000, ApJS, 127, 141
- [34] Plait P. C., Lundqvist P., Chevalier R. A., Kirshner R. P., 1995, ApJ, 439, 730
- [35] Pinto P. A., Woosley S. E., 1988, Nat, 333, 534
- [36] Shigeyama T., Nomoto K., Hashimoto M., 1988, A & A, 196, 141
- [37] Shortridge K., FIGARO General data reduction and Analysis Starlink MUD, RAL, June 1991
- [38] Spyromilio J., Meikle W. P. S., Allen D. A., 1990, MNRAS, 242, 669
- [39] Spyromilio J., Graham J. R., 1992, MNRAS, 255, 671
- [40] Timmes F. X., Woosley S. E., Hartmann D. H., Hoffman R. D., 1996, ApJ, 464, 332
- [41] Turner S. E., Suntzeff N. B., Elias J. H., Keane M., Phillips M. M., Depoy D., 1996, BAAS 189, 4505
- [42] Walborn N. R., Phillips M. M., Walker A. R., Elias J. H., 1993, PASP 105, 1240
- [43] Walker A. R., Suntzeff N. B., 1990, PASP 102, 131
- [44] Wang Lifan, Wheeler J. C., Kirshner R. P., Challis P. M., Filippenko A. V., Fransson C., Panagia N., Phillips M. M., Suntzeff N., 1996, ApJ, 466, 998
- [45] Weitzel L., Krabbe A., Kroker H., Thatte N., Tacconi-Garman L. E., Cameron M., Genzel R., 1996, A&AS, 119, 531
- [46] Woosley S. E., Pinto P. A., Hartmann D., 1989, ApJ, 346, 395
- [47] Woosley S. E., 1988, ApJ, 330, 218