High resolution imaging of molecular line emission from high redshift QSOs
Abstract
We present moderate (1′′) and high resolution (0.2′′) observations of the CO (2–1) emission at 43 GHz, and radio continuum emission at 1.47 GHz, from the QSO BRI 1202–0725 and the QSO BRI 1335–0417 using the Very Large Array. The moderate resolution observations show that in both cases the CO emission is spatially resolved into two components separated by 1′′ for 1335–0417 and 4′′ for 1202–0725. The high resolution observations show that each component has sub-structure on scales to 0.5′′, with intrinsic brightness temperatures K. The CO ladder from (2-1) up to (7-6) suggests a high kinetic temperature for the gas ( K), and a high column density (N(H2) cm-2). In both sources the continuum-to-line ratio: . All these characteristics (brightness temperature, excitation temperature, column density, and continuum-to-line ratio) are comparable to conditions found in low redshift, ultra-luminous nuclear starburst galaxies. We find that the CO emitting regions in 1202–0725 and 1335–0417 must be close to face-on in order to avoid having the gas mass exceed the gravitational mass, implying perhaps unreasonably large rotational velocities. While this problem is mitigated by lowering the CO luminosity-to-H2 mass conversion factor (X), the required X values become comparable to, or lower than, the minimum values dictated by optically thin CO emission. We considered the possibility of magnification by gravitational lensing in order to reduce the molecular gas masses.
1 Introduction
The recent discoveries that the large majority of spheroidal galaxies in the nearby universe contain massive black holes, and that the black hole mass correlates with the mass of the spheroid of the parent galaxy, have led to the hypothesis of co-eval formation of massive black holes and galaxy spheroids, perhaps occurring in merging galaxies at high redshift (Richstone et al. 1998; Gebhardt et al. 2000; Ferrarese & Merritt 2000; Franceschini et al. 1999, Blain et al. 1999, Kauffmann & Haenelt 2000). We have undertaken an extensive study of high redshift QSOs in order to address the interesting question of co-eval black hole and spheroidal galaxy formation. The large samples of high QSOs coming from wide field surveys such as the Sloan Digital Sky Survey (Fan et al. 2001), and the Digitized Palomar Sky Survey (DSS; Djorgovski et al. 1999) have greatly facilitated the study of high redshift QSOs. Our studies involve: (i) searches for thermal dust emission at mm-wavelengths from a large sample of QSOs (Carilli et al. 2001a; Omont et al. 2001), (ii) high resolution imaging at cm-wavelengths of the non-thermal radio continuum emission from these sources (Carilli et al. 2001a, Carilli et al. 2001b), and (iii) observations of the CO line emission from selected sources with large infrared luminosities, as inferred from the mm-continuum observations (Carilli, Menten, & Yun 1999).
The interesting result from the mm-continuum surveys of high redshift QSOs is that 30 of the sources are detected in surveys with flux density limits of 1 to 2 mJy at 250 GHz (Carilli et al. 2001a; Omont et al. 2001), corresponding to infrared luminosities L⊙ and dust masses M⊙. Radio continuum studies of these sources show that the mm-to-cm spectral energy distributions (SEDs) of most of the sources are consistent with the radio-to-far IR correlation found for nearby star forming galaxies (Condon 1992; Carilli 2001a, b; Yun et al. 2000). If the dust is heated by star formation, the implied star formation rates are of order 103 M⊙ year-1. On the other hand, the global SEDs for these sources from cm-to-optical wavelengths are not out of the range defined by lower redshift, lower luminosity QSOs (Carilli et al. 2001a,b; Sanders et al. 1989), and hence the case for dust-heating by star formation in these sources is by no means secure.
Searches for CO line emission from dust emitting QSOs at have resulted in the detection of molecular line emission from four sources to date: 1202–0725, 1335–0415, 0952–0115, and 2322+1944 (Ohta et al. 1996; Omont et al. 1996b; Guilloteau et al. 1997, 1999; Cox et al. 2001). The implied gas masses are large ( M⊙), leading some to speculate that star formation may be inevitable (Omont et al. 2001). Moreover, in at least one case (1202–0725) the molecular line and mm continuum emission is known to be spatially extended, with a bright emission region well separated from the optical QSO.
For sources at the CO(2-1) transition is redshifted into the 43 GHz band of the Very Large Array (VLA), thereby allowing for sensitive observations to be made of the low order transitions from these sources. The VLA also allows for sub-arcsecond angular resolution observations to be made, which are critical to the physical interpretation of the systems.
In this paper we present high resolution observations of the CO(2-1) emission from 1202–0725 at and from 1335–0415 at , along with radio continuum observations at 1.4 GHz of 1202–0725. These data are combined with observations of higher order CO transitions in an attempt to understand the physical conditions in the molecular line emitting regions of high QSOs. We use = 65 km s-1 Mpc-1, and .
2 The sources
By selecting for very red, point-like optical sources, McMahon (1991) has identified a large sample of QSOs from the Automatic Plate Measuring survey (Irwin, McMahon, & Hazard 1991), including the two sources BRI 1202–0725 at and BRI 1335–0415 at . Optical spectra of both of these sources show strong associated Ly absorption (Storrie-Lombardi et al. 1996).
2.1 1202–0725
Omont et al. (1996) and Ohta et al. (1996) detect high order CO line emission from 1202–0725, as well as thermal continuum emission from warm dust at 1.35mm. The continuum and line emission consist of a double source with an angular separation of 4′′. The total flux density of the source at 1.2mm is mJy, implying a far IR luminosity of L⊙, assuming a spectral energy distribution (SED) typical for an ultra-luminous infrared galaxy (ULIRG; ), where is defined as in Helou et al. (1988) and Condon (1992), ie. the integrated luminosity between rest frame wavelengths of 42 to 122 m. The southern source in 1202–0725 comprises about 65 of the total. Observations of this source with ISO at mid- to far-IR wavelengths constrain the dust temperature to be K for a dust emissivity index (Leech, Metcalfe, & Altieri 2001).
The CO observations of Omont et al. (1996a) and Guelin et al. (2001) indicate a difference in the CO line widths for the northern and southern components. Gaussian fitting to the CO(5-4) line emission profiles by Omont et al. (1996) results in , line Full Width at Half Maximum (FWHM) = 190 km s-1, and an integrated line flux density = 1.10.2 Jy km s-1 for the southern source, and , FWHM = 350 km s-1, and an integrated line flux density = Jy km s-1 for the northern source. This difference is important, since it argues against gravitational lensing as the origin for the observed double source and large apparent luminosity. However, Guilloteau (2001) has recently called the difference in CO profiles into question due to the possible contamination of the line emission from the northern source by continuum emission at 3mm. The data presented herein support the original conclusions of Omont et al. (1996a) and Guelin et al. (2001) for different line profiles for the northern and southern sources in 1202–0725.
BRI1202–0725 is a radio continuum source with a total flux density of Jy at 1.4 GHz (see section 4.1), and 14115 Jy at 4.9 GHz (Yun et al. 2000). Extrapolating the centimeter spectrum to millimeter wavelengths assuming a continuous powerlaw spectrum implies a non-thermal contribution to the integrated emission at 40 GHz of 80Jy. Conversely, extrapolating the (sub)mm dust emission spectrum downward to 40 GHz implies a thermal dust contribution of 25Jy, assuming .
Optical imaging of 1202–0725 shows a point-like QSO with MB = –28.5, with faint near-IR and Ly emission extending about 2.4′′ north of the QSO (Hu, McMahon, & Egami 1996). The optical position of the QSO given by Hu et al. is 0.5′′ north of the position of the southern mm/cm/CO component. In the following we assume that this offset indicates the accuracy of the relative astrometry of the radio and optical images.
The (3) limit to the Ly flux from the northern mm/cm/CO component in 1202–0725 is erg cm-2 s-1 (Hu et al. 196), corresponding to a limit to the Ly luminosity of erg s-1. For comparison, the Ly luminosities of UV dropout galaxies at are typically erg s-1 (Steidel et al. 2000). The line emitting object detected 2.4′′ northwest of the QSO has a Ly luminosity of erg s-1 (Fontana et al. 1998; Petitjean et al. 1996). If this line emission is powered by star formation, then the star formation rate is M⊙ year-1, depending on the amount of dust extinction (Fontana et al. 2000). It is also possible that this line emission is powered by UV radiation from the QSO itself (Petitjean et al. 1996). The lack of CO and thermal dust emission from this position argues for the latter, while the lack of N V and C IV emission lines argues for the former (Fontana et al. 1998; Ohta et al. 2000).
2.2 1335–0417
Guilloteau et al. (1997) have detected CO (5–4) line emission from BRI 1335–0417 at , with a line FWHM = km s-1 and an integrated line intensity of 2.80.3 Jy km s-1. The flux density of the dust continuum emission measured at 1.35mm with the Plateau de Bure Interferometer (PdBI) at 2′′ resolution is 5.61.1 mJy, while that measured at 1.25mm with the IRAM 30m telescope (10.6′′ resolution) is mJy. The implied far IR luminosity based on the 1.25 mm measurement is L⊙. The 1.35mm PdBI observations shows marginal evidence for an extended source, with a formal Gaussian size of , with major axis oriented roughly north-south.
No high resolution optical images have been published of 1335–0417. The DSS shows an unresolved source with MB = –27.3, although with a pixel scale of just 1′′ the details of the source structure remain unknown. BRI 13350417 has been detected in the radio continuum, with an integrated flux density of Jy at 1.4 GHz and Jy at 4.9 GHz (Carilli et al. 1999).
3 Observations
Table 1 lists the observing parameters for BRI 1202–0725 and BRI 13350417. We also present a re-analysis of the D configuration observations from Carilli et al. (1999).
Standard amplitude and phase calibration were applied, correcting for atmospheric opacity at high frequency, and the absolute flux density scale was set by observing 3C 286. Fast switching phase calibration was employed for the high frequency observations (Carilli & Holdaway 1999). The 43 GHz observations were dynamically scheduled, and took place at night under excellent weather conditions. RMS phase variations after calibration were 20∘. The phase coherence was checked by imaging a calibrator with the same calibration cycle as that used for the target sources. At all times the coherence was found to be higher than 85.
A severe limitation at the VLA for observing broad lines at high frequencies is the maximum correlator bandwidth of 50 MHz, and the limited number of spectral channels (7) when using this bandwidth and dual polarization. The bandwidth of 50 MHz corresponds to a velocity coverage of only 350 km s-1 at 43 GHz. These correlator limitations preclude a meaningful determination of the line profile, so we chose to observe in continuum mode with two IFs (Intermediate Frequency) with two polarizations for each IF in order to maximize sensitivity to the integrated line emission (Carilli et al. 1999). Our analysis will necessarily assume the line widths as given by the higher order transitions.
For the CO line observations of 1202–0725 IF1 was centered on the emission line from the southern source, while IF2 was off-set from this by 50 MHz. Based on the (admittedly noisy) spectra in Omont et al. (1996a), IF1 should contain most of the emission from the southern component, while the sum of the IFs cover the emission from the northern component. The continuum for 1202–0725 was investigated with an observation at 43 GHz. For 1335–0417 IF1 was centered on the emission line, while IF2 was centered 1400 km s-1 off the line. Taking into account the limited width of the continuum band employed, we estimate that we are missing about 30 of the velocity-integrated line emission in 13350417.
4 Results
4.1 BRI 1202-0725
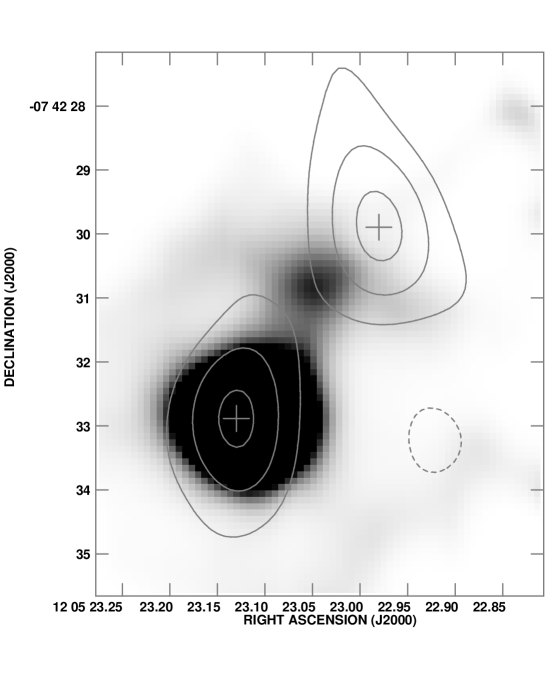
The VLA D array observations of the CO(2-1) emission from 1202–0725 are shown in Figure 1, with a spatial resolution of about 2′′. Figure 1a shows the summed emission in IF’s 1 and 2 for the 40 GHz observations. Shown in greyscale on Figure 1a is the Ly image of 1202–0725 from Hu et al. (1996). Again, we have aligned the position of the optical QSO with the peak in the radio continuum, CO, and thermal dust emission for the southern source. Figures 1b and 1c show IFs 1 and 2, respectively, for the 40 GHz observations. Figure 1d shows the continuum image at 43 GHz.
Table 2 lists the results for the two components in 1202–0725. Column 3 lists the position of the measured CO components. Column 4 lists the 7mm continuum flux densities at these positions, column 5 lists the observed CO flux densities, and column 6 lists the velocity integrated CO emission. Column 7 lists the 1.4 GHz continuum flux densities, while column 8 lists the CO luminosities (in K km s-1 pc2).
The southern CO component is clearly detected in IF1 of the 40 GHz observations (Fig. 1b), but is not seen in IF2, nor in the 43 GHz continuum image (Figs. 1c and 1d). The northern component shows up in both IF channels for the 40 GHz observations (Figs 1a,b,c), but is not seen in the 43 GHz continuum image (Fig 1d). From the 43 GHz image we set a 2 upper limit of 0.16 mJy for the 43 GHz continuum emission from both the northern and southern components in 1202–0725.
The lack of continuum emission at 43 GHz from the northern component in 1202–0725 is significant in regard to the recent possible detection of mJy of continuum emission at 3mm by Guilloteau (2001). The implied spectrum from 3mm to 7mm must be rising with a powerlaw index . It also implies that the observed emission in IFs 1 and 2 at 40 GHz for the northern source is CO(2-1) line emission (Figs. 1a,b,c), and hence that the velocity profiles for the CO lines from the northern and southern sources are different.
Figure 2 shows the results from the B array observations with a resolution of about . The southern source in IF1 (Fig 2b) appears as two unresolved, roughly equal components (flux densities mJy), separated by 0.3′′. The implied lower limit to the (redshift corrected) brightness temperature for these components is about 25 K. The northern source in IFs 1 and 2 (Fig 2a) is marginally detected with a peak surface brightness of mJy beam-1. This implies two, or more, compact components with flux densities below our detection threshold, or diffuse emission on a scale .
Figure 3 shows the radio continuum image of 1202–0725 at 1.4 GHz, with a resolution of about . Both components are detected, with flux densities as listed in Table 2. The total 1.4 GHz flux density of 1202–0725 has been measured three times over the course of three years with values of Jy (Yun et al. 2000), Jy, and Jy. In our analysis we adopt the mean value of 315 Jy. It is possible that the source is variable, although making accurate flux density measurements at this level is difficult due to confusion problems arising in wide-field imaging at 1.4 GHz.
4.2 BRI 1335–0417
The low resolution image of the CO(2-1) emission from 1335–0417, as reproduced from Carilli et al. (1999), is shown in Figure 4a, along with the off-line channel in Figure 4b. For this image the UV-data were naturally weighted in order to maximize sensitivity, at the expense of resolution. The rms noise on the image is 0.11 mJy beam-1 and the resolution is about . The CO emission appears extended north-south in this image by about 1′′.
In order to investigate this extension in more detail, we re-imaged the data using uniform weighting of the visibilities, which optimizes resolution at the expense of sensitivity. The result is shown in Figure 4c, with a rms noise of 0.14 mJy and resolution of about . The source is comprised of two components separated by 1.3′′. Gaussian fitting to each component shows that they are unresolved, with upper limits to their sizes of about 1.1′′. Table 2 lists the component positions and flux densities.
The position of the 1.35mm continuum peak is located within 0.2′′ of the southern CO component, and the mm continuum source also shows marginal evidence for a north-south extension on the scale of 1′′ (Guilloteau et al. 1997). The optical QSO position is within 0.1′′ of the southern source position.
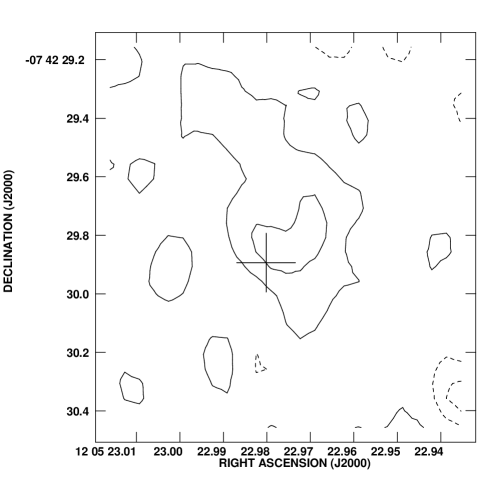
Figure 5 shows the high resolution (B array) image of the CO(2-1) emission from 1335–0417. The naturally weighted beam is roughly circular with FWHM = . Nothing is detected in this high resolution image to a 2 surface brightness limit of 0.18 mJy beam-1. Non-detection at high resolution could mean that the emission is diffuse on scales larger than the resolution with a (redshift corrected) brightness temperature K. On the other hand, a number of compact components distributed over 1′′ with higher brightness temperature is certainly not precluded, eg. the data allow for four small () components each with brightness temperatures 22 K.
5 Analysis
5.1 Masses
The H2 gas masses can be calculated from the values of in Table 1 assuming a value of X = the H2 mass-to-CO(1-0) luminosity conversion factor in M⊙ (K km s-1 pc2)-1. A value of is applicable to Galactic Giant Molecular Clouds (Dame et al. 1987; Strong et al. 1988; Bronfman et al. 1988), while for ULIRGs Downes and Solomon (1998) find a value of . This calculation also requires an extrapolation from the CO(2-1) measurements to the CO(1-0) luminosity. Assuming constant brightness temperature and using a value of X appropriate to ULIRGs leads to molecular gas masses of about M⊙ for the CO emitting components in 1202–0725 and 1335–0417.
We can also calculate the gravitational masses using the observed sizes and line widths for the sources, and assuming a disk of gas in Keplerian rotation. For 1202–0725 south we use a line width of 190 km s-1 and a radius corresponding to half the separation of the two components = 0.15′′ = 1.1 kpc, leading to an enclosed mass of sin M⊙. For 1335–0417 we do not have spatially resolved spectroscopy, so we adopt a line width of 420 km s-1 and a radius of half the separation of the two components = 0.65′′ = 4.7 kpc, leading to an enclosed mass of sin M⊙.
An upper limit to can be derived by assuming that the molecular gas mass dominates the total enclosed mass. Using for 1202–0725 south we find , while for 1335–0417 we find . These small angles lead to a significant problem in that the implied rotational velocities are then extremely large, 400 km s-1. To obtain rotational velocities of km s-1, more typical of large spiral galaxies, would require a further reduction in the conversion factor to . However, such a low X value would violate the minimum mass conditions dictated by optically thin CO emission, for which for an excitation temperature of 50 K and assuming a Galactic CO abundance (Solomon et al. 1997). It may be that these systems are extremely massive, or perhaps that the apparent CO luminosities are magnified by gravitational lensing (see section 6).
5.2 Continuum-to-Line Ratios
We now consider the continuum-to-line ratio: . A non-linear relationship between this ratio and has been found by Solomon et al. (1997), in which values of 5 to 50 have been found for Galactic Giant Molecular Clouds and for nearby galaxies with , while values of 80 to 250 have been found for ULIRGs.
For the QSOs discussed herein we derive the (CO(1-0)) from (CO(2-1)) assuming the same brightness temperature for the two transitions. Considering the integrated properties of 1202–0725 leads to: . For 1335-0417 we find: .
5.3 CO excitation conditions
Figure 6 shows the CO ladder for the various transitions observed in 1202–0725 and 1335–0417. The data have all been normalized to the velocity integrated line flux for CO(5-4). For comparison, we have included the CO ladder observed for the best studied nuclear starburst M82 (Güsten et al. 1993; Mao et al. 2000), and the CO ladder for the integrated emission from the the Milky Way disk inside the solar radius (excluding the Galactic center) as seen by COBE (Fixsen, Bennett, & Mather 1999). The excitation conditions for the two QSOs follow those seen in M82, with roughly constant brightness temperature (intensity frequency2) up to CO(5-4), and then roll-off to higher order transitions. This behavior is very different than that seen for the disk of the Milky Way, for which the integrated line flux peaks at the CO(3-2) line.
We have used a standard one component LVG model simulating a spherical cloud to interpret the observed line ratios (see also Ohta et al. 1998). Input parameters are the kinetic temperature, the H2 density, and the CO column density, the latter in the form cm-2, with grad denoting the velocity gradient in km s-1 pc-1, n(CO) being the nominal CO number density in cm-3, and describing the FWHM in km s-1. Given the inhomogeneity of the interstellar medium in the Milky Way and nearby galaxies, our assumption of uniform physical conditions is crude but appropriate for a source with four detected lines from the main CO species and no information on rare isotopomers. The cosmic background was assumed to be at a temperature of 15 K.
Due to the lack of constraints, there is a clear degeneracy in LVG modeling between various parameters such as the temperature and density (Güsten et al. 1993). Our modeling is not meant as an exhaustive analysis, but is merely representative of the types of conditions that can give rise to the observed line ratios. Adopting a kinetic temperature of 70 K, corresponding to the temperature derived from the spectrum of thermal dust emission (Leech et al. 2001), we find that the data can be reasonably fit with a model in which: N(CO) = cm-2, n(H2) = cm-3, and grad = 1 km s-1 pc-1. Raising the temperature to 100 K decreases the required density by a factor two. A more thorough analysis of the excitation conditions in 1202–0725, including new, spatially resolving observations of the high order transitions will be given elsewhere (Kohno et al. 2001, in preparation).
In the likely case that photon dominated regions (PDR) provide a more realistic approach, the density must be larger than the ‘critical’ density to efficiently excite the mid- and high-J CO lines and to avoid subthermal excitation (e.g. Koester et al. 1994). With line temperatures being highest for the CO J = 2-1 or 3-2 transitions, critical densities, at which collisional deexcitation rates exceed radiative decay rates, are to cm-3.
6 Discussion
We briefly compare the properties of 1202–0725 and 1335–0417 to those found in nuclear starburst galaxies seen at lower redshift. Yun et al. (2000) found that the ratio of radio-to-far IR luminosity for both these sources is within the range defined for active star forming galaxies based on the tight radio-to-far IR correlation (Condon 1992), although in both cases the ratio falls at the high end of the normal range, suggesting a possible contribution to the radio emission from the AGN. For 1202–0725 there is marginal evidence that the radio emission is time variable. Variability would rule-out a starburst origin for the radio emission. Further radio continuum monitoring is in progress to test this interesting possibility.
The measured (redshift corrected) brightness temperature for the CO(2-1) emission from the compact components in the southern source in 1202–0725 is K. This limit is consistent with values seen for the CO(2-1) emission from starburst nuclei of ULIRGs, for which brightness temperatures of 30 K to 60 K have been measured (Downes and Solomon 1998).
The excitation conditions for the CO for these two sources follow roughly those seen for the nuclear starburst galaxy M82, but are very different than those expected for the disk of a normal spiral galaxy. Assuming a Galactic abundance for CO of (eg. Wilson et al. 1986) implies an H2 column density of order 1024 cm-2. This value is similar to the molecular gas column density seen toward ULIRGs (Downes & Solomon 1998), but is an order of magnitude larger than that observed in the lower luminosity nuclear starburst galaxies M82 and NGC 253 (Harrison, Henkel, & Russell 1999, Mao et al. 2000). A low metallicity would suppress CO emission and would yield even higher H2 column densities. It would be very interesting to measure the CO(1-0) line of the source. A direct comparison of CO(1-0) and 2-1 line intensities would provide significant information on optical depths, since the 1-0 line may be optically thin, while the 2-1 line is likely optically thick.
We have found that the continuum-to-line ratio, , is about 335 for both sources. This ratio is at the high end of those seen for ULIRGs, and suggests a continuation of the non-linear trend for increasing continuum-to-line ratios with increasing far IR luminosity. Considering to be a measure of star formation rate, and (CO(1-0)) to be a measure of molecular gas mass, it has been suggested that this non-linear relation might imply a higher star formation efficiency () in higher luminosity galaxies, in particular for galaxies with L⊙ (Solomon et al. 1997). For dense nuclear starbursts a number of groups (Solomon et al. 1997; Mao et al. 2001; Weiss et al. 2001) have shown that the densities are such that the entire interstellar medium in the starburst regions may be molecular, and that the CO(1-0) emission may be dominated by this molecular inter-cloud medium, as opposed to being from the denser star forming clouds themselves. This phenomenon would contribute to the non-linear relationship between and (CO(1-0)). For 1202–0725 and 1335-0417 there is also the obvious possibility of dust heating by the AGN, in which case the continuum-to-line ratio cannot be interpreted in the context of star formation.
Downes and Solomon (1998) show that for the nuclear starburst regions in ULIRGs the H2 mass-to-CO(1-0) luminosity conversion factor, X, is a factor four or so below the Galactic disk value. Even for this low value of X, we find that the CO emitting regions in 1202–0725 and 1335–0417 must be close to face-on in order to avoid having the gas mass exceed the gravitational mass, implying perhaps unreasonably large rotational velocities. While this problem is mitigated somewhat by lowering X even further, the required X values become comparable to, or lower than, the minimum values dictated by optically thin CO emission (Solomon et al. 1997).
One way of circumventing this mass problem would be to assume that the source is magnified by strong gravitational lensing. Magnification by a factor three or so would avoid unphysical values of X. The very large IR and CO luminosities, and the double structure of the sources in the CO line emission, and in the non-thermal radio continuum and thermal mm continuum for 1202–0725, could possibly indicate gravitational lensing. On the other hand, neither source is double at optical wavelengths, arguing against lensing, although the possibility of differential obscuration along the two lines-of-sight complicates this conclusion (Hu et al. 1996). More telling is the difference in CO(2-1) line profiles, which is difficult, although perhaps not impossible, to explain in the context of gravitational lensing. Also, double sources arise from strong gravitational lensing of very compact emitting regions (sizes few pc). For extended emitting regions ( pc), such as must be the case for the thermal CO and mm continuum emission, strong lensing will only occur if the extended emission regions cross a caustic in the source plane (Blandford & Narayan 1992). Such a phenomenon usually leads to more complex geometries, like arcs or rings, as in APM 0827+525 and IRAS 10214 (Lewis et al. 2001; Scoville et al. 1995). More sensitive, high resolution imaging at cm and mm wavelengths is required to address this interesting question.
Overall, the physical conditions in the molecular gas and dust in these systems are similar to those observed in nuclear starbursts at low redshift, including: (i) the radio-to-far IR luminosity ratio, (ii) the CO brightness temperature, (iii) the CO excitation conditions, (iv) the CO column densities, and (v) the CO line-to-dust continuum ratio.
The National Radio Astronomy Observatory (NRAO) is operated by Associated Universities, Inc. under a cooperative agreement with the National Science Foundation. We thank E. Hu for allowing us to reproduce the Ly image, S. Myers for discussions concerning gravitational lensing, and the referee for many important comments.
References
- (1)
- (2) Blain, A.W. Jameson, A., Smail, I., Longair, M.S., Kneib, J.-P., & Ivison, R.J. 1999, MNRAS, 309, 715
- (3)
- (4) Blandford, R.D. & Narayan, R. 1992, ARAA, 30, 311
- (5)
- (6) Bronfman, L., Cohen, R.S., Alvarez, H., May, J., & Thaddeus, P. 1988, ApJ, 331, 181
- (7)
- (8) Carilli, C. L. & Yun, M. S. 1999, ApJ, 513, L13
- (9)
- (10) Carilli, C. L. & Holdaway, M. A. 1999, Radio Science, 34, 817
- (11)
- (12) Carilli, C.L., Bertoldi, F., Rupen, M.P. et al. 2001a, ApJ, 555, 625
- (13)
- (14) Carilli, C.L., Bertoldi, F., Omont, A., Cox, P., McMhaon, R.G., & Isaak, K. 2001b, AJ, in press
- (15)
- (16) Carilli, C.L., Menten, K.M., & Yun, M.S. 1999, ApJ, 521, L25
- (17)
- (18) Condon, J. J. 1992, ARAA, 30, 575
- (19)
- (20) Cox, P., Omont, A., Bertoldi, F. et al. 2001, A & A (letters), submitted
- (21)
- (22) Dame, T., Ungerechts, H., Cohen, R. S. et al. 1987, ApJ, 322, 706
- (23)
- (24) Downes, D., & Solomon, P.M. 1998, ApJ, 507, 615
- (25)
- (26) Djogovski, S.G. 1999, in The Hy-redshift Universe, (ASP: San Francisco), eds. A.J. Bunker & W.J.M. van Breugel, p. 397
- (27)
- (28) Fan, X. et al. 2001, AJ, 121, 54
- (29)
- (30) Ferrarese, L. & Merritt, D. 2000, ApJ (letters), 539, 9
- (31)
- (32) Fixsen, D.J., Bennett, C.L., & Mather, J.C. 1999, ApJ, 526, 207
- (33)
- (34) Franceschini, A., Hasinger, G., Mayaji, T., & Malquori, D. 1999, MNRAS (letters), 310, 5
- (35)
- (36) Fontana, A., D’Odorico, S., Giallongo, E., Cristiani, S., Monnet, G., & Petitjean, P. 1998, AJ, 115, 1225
- (37)
- (38) Gebhardt, Karl et al. 2000, ApJ (letters), 539, 13
- (39)
- (40) Guelin, M. et al. 2001, in preparation
- (41)
- (42) Guilloteau, S., Omont,A., McMahon, R.G., Cox,P., & Petitjean,P. 1997, A&A, 328, L1
- (43)
- (44) Guilloteau, S., Omont, A., Cox, P., McMahon, R. G., & Petitjean, P. 1999, A&A, 349, 363
- (45)
- (46) Guilloteau, S. 2001, in Science with Large Millimeter Arrays, ed. A. Wootten, (San Francisco: ASP) in press
- (47)
- (48) Güsten, R., Serabyn, E., Kasemann, C., Schinckel, A., Schneider, G., Schulz, A., & Young, K. 1993, ApJ, 402, 537
- (49)
- (50) Harrison, A., Henkel, C., & Russell, A. 1999, MNRAS 303, 157
- (51)
- (52) Helou, G., Khan, I.R., Malek, L., & Boehmer, L. 1988, ApJ (supplement), 68, 151
- (53)
- (54) Hu, E., McMahon, R.G., & Egami, E. 1996, ApJ, 459, L53
- (55)
- (56) Irwin, M., McMahon, R. G., & Hazard, C. 1991, in The Space Distribution of Quasars, ed. D. Crampton, (San Francisco: PASP), p. 117
- (57)
- (58) Kawabe, R., Kohno, K., Ohta, K., & Carilli, C. 1999, in Highly Redshifted Radio Lines, eds. C. L. Carilli, S. J. E. Radford, K. M. Menten, & G. I. Langston, (San Francisco: PASP), p. 48
- (59)
- (60) Kauffmann, G. & Haehnelt, M. 2000, MNRAS, 311, 576
- (61)
- (62) Koester, A., Stoerzer, H., Stutzki, J., & Sternberg, A. 1994, A& A 284, 545
- (63)
- (64) Leech, K.J., Metcalfe, L., & Altieri, B. 2001, MNRAS, in press, (astroph 0109033)
- (65)
- (66) Lewis, G.F, Carilli, C., Papadopoulos, P., & Ivison, R.J. 2001, MNRAS (letters), in press (astroph ??)
- (67)
- (68) Mao, R.Q., Henkel, C., Schulz, A. et al. 2000, A& A 358, 433
- (69)
- (70) McMahon, R. G. 1991, in The Space Distribution of Quasars, ed. D. Crampton, (San Francisco: PASP), p. 129
- (71)
- (72) Ohta, Kouji, Yamada, T., Nakanishi, K., Kohno, K., Akiyama, M., & Kawabe, R. 1996, Nature, 382, 426
- (73)
- (74) Ohta, Kouji, Matsumoto, Tsuyoshi, Maihara, Toshinori et al. 2000, PASJ, 52, 557
- (75)
- (76) Ohta, Kouji, Nakanishi, Kouichiro, Akiyama, Masayuki et al. 1998, PASJ, 50, 303
- (77)
- (78) Omont, A., McMahon, R. G., Cox, P., Kreysa, E., Bergeron, J., Pajot, F., & Storrie-Lombardi, L.J. 1996a, A&A, 315, 1
- (79)
- (80) Omont, A., Petitjean, P., Guilloteau, S., McMahon, R. G., Solomon, P. M., & Pecontal, E. 1996b, Nature, 382, 428
- (81)
- (82) Omont, A., Cox, P.; Bertoldi, F., McMahon, R. G., Carilli, C., & Isaak, K. G 2001, A& A, 374, 371
- (83)
- (84) Petitjean, P., Pecontal, E., Valls-Gabaud, D. & Charlot, S. 1996, Nature, 380, 411
- (85)
- (86) Richstone, D., Ajhar, E. A., Bender, R. et al. 1998, Nat. Supp., 395A, 14
- (87)
- (88) Sanders, D.B., Phinney, E. S., Neugebauer, G., Soifer, B. T., & Matthews, K. 1989, ApJ, 347, 29
- (89)
- (90) Scoville, N.Z., Yun, M.S., R. L. Brown, & P. A. Vanden Bout 1995, ApJ (letters), 449, L109
- (91)
- (92) Solomon, P.M., Radford, S.J.E., & Downes, D. 1992, Nature, 356, 318
- (93)
- (94) Solomon, P.M., Downes, D., Radford, S., & Barrett, J.W. 1997, ApJ, 478, 144
- (95)
- (96) Solomon, P.M. 2001, in Starburst Galaxies Near and Far, eds. D. Lutz & L. Tacconi (Springer: Berlin), p. 173
- (97)
- (98) Steidel, C.C., Adelberger, Kurt L., Shapley, Alice E., Pettini, Max, Dickinson, Mark, & Giavalisco, Mauro 2000, ApJ, 532, 170
- (99)
- (100) Storrie-Lombardi, L.J., McMahon, R.G., Irwin, M.J., & Hazard, C. 1996, ApJ, 468, 12
- (101)
- (102) Strong, A.W., Bloemen, J. B. G. M., Dame, T. M. et al. 1988, A& A, 201, 1
- (103)
- (104) Weiss, A., Neininget, N., Hüttermeister, S., & Klein, U. 2001, A& A, 365, 571
- (105)
- (106) Wilson, T.L., Serabyn, E., Henkel, C., & Walmsley, C.M. 1986, A& A 158, L1
- (107)
- (108) Yun, M.S., Carilli, C.L., Kawabe, R., Tutui, Y., Kohno, K. & Ohta, K. 2000, ApJ, 528, 171
- (109)
Figure Captions
FIG. 1a.— The contours
show the VLA image of CO(2-1) emission from 1202–0725
at . The spatial resolution (FWHM) is
with the major axis position angle = 0o, and the rms noise
on the image is mJy beam-1.
This frame shows the sum of the two IFs with a mean
frequency of 40.510 GHz and a total bandwidth of 100 MHz.
The contour levels are: -0.13, 0.13, 0.26, 0.39 mJy beam-1.
The greyscale shows the narrow band image of
the Ly emission (Hu et al. 1996). The crosses
in this and subsequent images of 1202–0725, mark
the two peak positions of the CO emission in this image.
1b. — The image of IF1 (40.485 GHz) and mJy
beam-1.
The contour levels are: -0.19, 0.19, 0.38, 0.57, 0.76 mJy
beam-1.
1c. — The image of IF2 (40.535 GHz) with the same contours as 1b and
mJy beam-1.
1d. — The 43 GHz continuum image of 1202–0725 with a resolution of
, with the major axis position angle = , and
mJy.
The contour levels are: -0.2, -0.1, 0.1, 0.2, 0.3 mJy beam-1.
FIG. 2a.— The VLA image of the CO(2-1) emission from
the northern component in 1202–0725 using the sum of IFs 1 and 2 at
40 GHz at a resolution of with the major axis
position angle = 11o, and mJy beam-1. The
contour levels are: -0.2, -0.1, 0.1, 0.2, 0.3 mJy beam-1.
2b.— The VLA image of the CO(2-1) emission from the
southern component in 1202–0725 for IF1 at 40.485 GHz,
and mJy beam-1.
The contour levels and resolution are the same as Figure 2a.
FIG. 3.— An image of the radio continuum emission from 1202–0725 at 1.4 GHz made with the VLA at a resolution of , major axis position angle = -30o, and Jy beam-1. The contour levels are a geometric progression in the square root of two with the first level being 35Jy beam-1.
FIG. 4a.— The contours
show the VLA image of CO(2-1) emission from 1335–0417
at . The spatial resolution is with major axis PA = 39o,
and mJy beam-1.
This frame shows the first IF at 42.635 GHz
and a bandwidth of 50 MHz.
The contour levels are: -0.24, -0.12, 0.12, 0.24, 0.36, 0.48, 0.50 mJy
beam-1. The crosses in this and subsequent images,
mark the positions of the two peaks as seen in Figure 4c.
4b. — The same as 4a but for the second IF at 42.835 GHz.
4c. — The same as 4a but using uniform weighting of the
visibilities, leading to a spatial resolution of
with major axis PA = 39o,
and mJy beam-1.
The contour levels are: -0.26, -0.13, 0.13, 0.26, 0.39, 0.52 mJy
beam-1.
FIG. 5. — An image of the CO(2-1) emission from 1335–0417 at a spatial resolution of , and mJy beam-1. This frame shows the first IF at 42.635 GHz and a bandwidth of 50 MHz. The contour levels are: -0.28, -0.14, 0.14, 0.28, 0.42 mJy beam-1.
FIG. 6. — The CO ladder for the two high redshift QSOs in this paper and using data from Omont et al. (1996), Ohta et al. (1996), and Guilloteau et al. (1997) for the other transitions. The open squares are the results for BRI 1202–0725. The open triangles are those for 1335–0417. The solid triangles are the data for the CO ladder for the integrated emission from the the Milky Way disk inside the solar radius (excluding the Galactic center) as seen by COBE (Fixsen, Bennett, & Mather 1999). The open circles are the results for the starburst nucleus of M82 (Güsten et al. 1993; Mao et al. 2000). The ordinate is the velocity integrated line flux density, normalized to the CO(5-4) line, except for the Milky Way, for which the values are normalized at CO(3-2). The long dash line shows the line strengths increasing as frequency squared. The short dash line shows an LVG model with Tkin = 100 K and n(H2) = cm-3, and the dotted line shows the LVG model with Tkin = 70 K and n(H2) = cm-3.
| Source | Date | Configuration | Frequency |
|---|---|---|---|
| GHz | |||
| 1202–0725 | March 1999 | D (1km) | 40.485, 40.535 |
| 1202–0725 | May 2001 | B (10km) | 40.485, 40.535 |
| 1202–0725 | November 2001 | D | 43.315, 43.365 |
| 1202–0725 | August 1999 | A (30km) | 1.365, 1.415 |
| 1335–0417 | December 1999 | B | 42.635, 42.835 |
| 1335–0417 | March 1999 | D | 42.635, 42.835 |
| Source | Position | S(7mm) | S(CO(2-1)) | S V | S(1.4 GHz) | L’(CO(2-1)) | |
|---|---|---|---|---|---|---|---|
| J2000 | mJy | mJy | Jy km s-1 | mJy | K km s-1 pc2 | ||
| 1202–0725 South | 4.695 | 12 05 23.12 –07 42 32.9 | |||||
| 1202–0725 North | 4.692 | 12 05 22.98 –07 42 29.9 | |||||
| 1335–0417 South | 4.407 | 13 38 03.40 –04 32 35.4 | |||||
| 1335–0417 North | 4.407 | 13 38 03.42 –04 32 34.1 | – |


![[Uncaptioned image]](/html/astro-ph/0112492/assets/x4.png)