Cosmic Ray composition around the knee from EAS electromagnetic and muon data
Abstract
We report the analysis of the Ne-Nμ coincident events collected by the MACRO/EAS-TOP collaboration at the Gran Sasso Laboratories. The result points to a primary composition becoming heavier around the knee of the primary spectrum (in the energy region eV). The result is in very good agreement with the measurements of EAS-TOP alone at the surface, wich detects muons with energy GeV and uses the same (QGSJET) interaction model.
1 Introduction and the detectors
The study of the primary composition in the Extensive Air Shower energy region requires the use of different observables in order to cross check the information and reduce the dependence on the interaction model and propagation codes used. At the National Gran Sasso Laboratories a program of exploiting the surface shower size measurements from EAS-TOP (2005 m a.s.l.), and the high energy muon measurements ( TeV) performed in the deep underground laboratories (MACRO) has been developed. Such muons in fact originate from the decays of mesons produced in the first interactions in the atmosphere and from a quite different rapidity region than the GeV muons usually used for such analysis ( or ).
The two experiments operated in coincidence for a live time of 960.12 days between 1990 and 2000. The number of coincident events collected with the two detectors operating in the final configuration amounts to 28160, of which 3752 have shower cores inside the edges of the array (”internal events”) and shower size , and 409 have , i.e. above the observed knee at the corresponding zenith angle. We present here an analysis of the full data set in terms of the QGSJET interaction model as implemented in CORSIKA. For a comparison of different interaction models see [1].
The EAS-TOP array is located at Campo Imperatore (2005 m a.s.l., with respect to the vertical of the underground Gran Sasso Laboratories, corresponding to 930 gr cm-2 atmospheric depth). Its e.m. detector (to which we are mainly interested in the present analysis) is built of 35 scintillator modules 10 m2 each, including an area A 105 m2. The array is fully efficient for . Its reconstruction capabilities of the EAS parameters (for internal events) are: above , and for the EAS arrival direction. The array and the reconstruction procedures are fully described in [2].
MACRO, in the underground Gran Sasso Laboratory at 963 m a.s.l., with 3100 m w.e. of minimum rock overburden, is a large area multi-purpose apparatus designed to detect penetrating cosmic radiation. The lower part of the MACRO detector has dimensions m3. A detailed description of the apparatus can be found in [3].
In this work we consider only muon tracks which have at least 4 aligned hits in both views of the horizontal streamer tube planes over the 10 layers composing the whole detector. The standard reconstruction procedure of MACRO [4] has been used.
The two experiments are separated by a thickness of rock ranging from 1100 up to 1300 m, depending on the angle.
The muon energy threshold at the surface for muons reaching the MACRO depth ranges from TeV to TeV inside the effective area of EAS-TOP. Event coincidence is established off-line, using the absolute time given by a GPS system with an accuracy better than 1 .
2 Analysis and results
The analysis technique has to be adapted
to the specific trigger requirements (both surface and underground
detectors fired) with defined acceptance area for the EAS array
(internal events), but undefined for the underground one.
Therefore, the main experimental feature to be considered
is the muon multiplicity distribution in different intervals
of shower sizes. We have chosen six intervals of shower sizes around the
knee:
5.20 5.31;
5.31 5.61;
5.61 5.92;
5.92 6.15;
6.15 6.35 and
6.35 6.7.
Within each size bin the muon multiplicity distribution has been fitted with a superposition of pure and components, or light and heavy admixtures containing equal fractions of and or and respectively. All spectra in the simulation have slope .
The fit has been performed in the quoted six windows by minimizing the following expression for each multiplicity distribution:
| (1) |
where in the number of observed events in the -th bin of multiplicity, () and () are the number of simulated events in the same -th multiplicity bin from the () and () components, respectively; and are the parameters (to be fitted) defining the fraction of each mass component contributing to the same multiplicity bin. The results of the fits have been normalized to reproduce the observed number of coincident events in each size bin.
To infer the mass composition evolution as a function of energy, for each size bin we take from the simulation the distributions of contributing mass groups weighted by the parameters and and with weights representing the relative efficiency to trigger the underground apparatus. The resulting distributions from different size bins are summed together, and so we eventually obtain the simulated energy spectra of the two basic components that reproduce the experimental data.
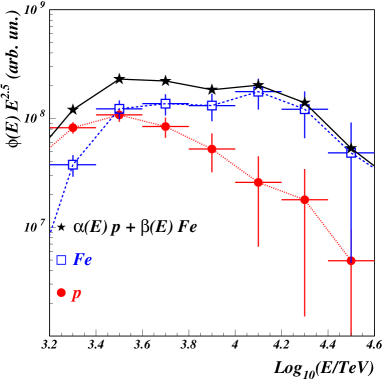
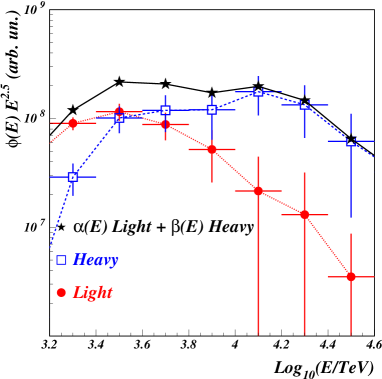
These resulting spectra for - and - components, further corrected for the detection efficiency of the surface array, are reported in Fig. 1 together with their sum. Within such procedure, for each bin in we calculate from the expression:
| (2) |
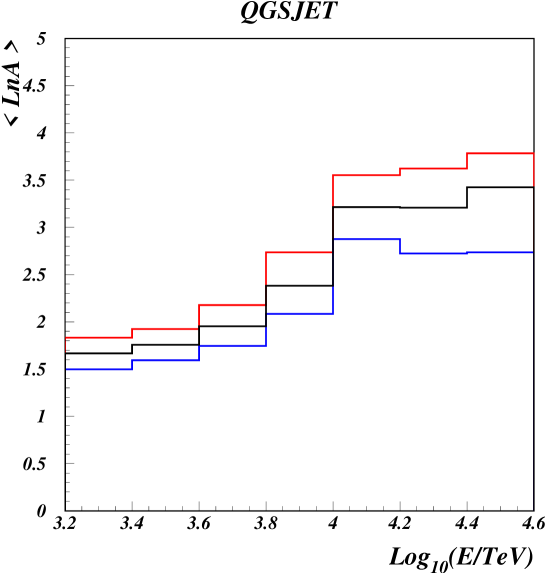
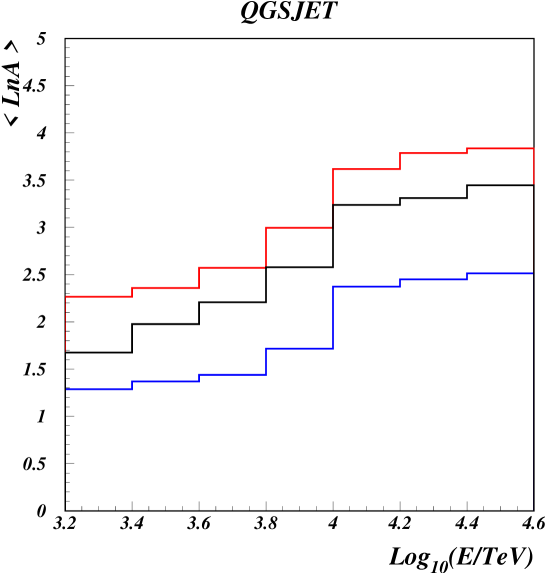
where and are the numbers of simulated events from and contributing to the k-th energy bin. The same expression, with obvious modifications, is used for the - composition. The results are depicted in Figs. 2, the two curves delimiting the error band. The results show an increase in through the energy corresponding to the knee position.
3 Conclusions
The analysis of the Ne-Nμ ( TeV) data collected by the MACRO/EAS-TOP collaboration at the Gran Sasso Laboratories points to a primary composition becoming heavier around the knee of the primary spectrum (in the energy region eV). The result is in very good agreement with the measurements of EAS-TOP alone at the surface, wich detects muons with energy GeV, using the same (QGSJET) interaction model [7]. GeV and TeV muons are produced in different kinematic regions: in the central one and at the edges of the fragmentation region respectively. The present measurements show therefore a good consistency of the interaction model in describing the yield of secondaries over a wide rapidity region.
References
- [1] EAS-TOP and MACRO Coll., Proc. 27 ICRC, 1, 120, 2001.
- [2] Aglietta M. et al., Nucl. Instr. & Meth. A, 336, 310, 1993.
- [3] MACRO Collaboration (Ahlen S.P. et al.), Nucl. Instr. & Meth. A, 324, 337, 1993.
- [4] MACRO Collaboration (Ahlen S.P. et al.), Phys. Rev. D, 46, 4836, 1992.
- [5] MACRO Collaboration (Ambrosio M. et al.), Phys. Rev. D, 56, 1418, 1997.
- [6] EAS-TOP Coll., Astroparticle Physics, 10, 1, 1999, and Proc. 26th ICRC, 1, 230, 1999.
- [7] B.Alessandro et al., these proceedings.