MSX Observations of Diffuse UV Emission in Orion
Abstract
We have observed intense diffuse radiation in the UV (1400 Å - 2600 Å) from three fields around M42 in Orion. Intensities of 20000 photons cm-2 sr-1 s-1 Å-1 were observed to the east and west of M42 with 8000 photons cm-2 sr-1 s-1 Å-1 south of the nebula. Enhanced emission, perhaps associated with a nearby complex of molecular clouds observed in CO, was detected in one of the fields. The IRAS 100 m emission in that region is highly correlated with the UV intensity with a UV-IR ratio of 40 photons cm-2 sr-1 s-1 Å-1(MJy sr-1)-1. In the other two fields there was no structure in the diffuse emission nor was there any correlation with the IRAS emission.
keywords:
reflection nebulae; Ultraviolet: ISM - ISM: clouds - dust, extinction1 Introduction
The Midcourse Space Experiment (MSX) was a US Ballistic Missile Defense Organization (BMDO) satellite launched on 26 April 1996, from Vandenberg AFB into a 900 km altitude, semi-sun synchronous orbit. Mill et al. (1994) provide an overview of the MSX mission and objectives, which included observations of a variety of natural and man-made phenomena over a spectral range from the ultraviolet to the mid-infrared.
A large number of astronomical observations were made during the mission, characterizing various components of celestial backgrounds. Price et al. (1997) describe the objectives of the 11 MSX astronomy experiments, designated “CB” (for Celestial Background), and also detail the data obtained by SPIRIT III, the infrared telescope aboard MSX. The ultraviolet and visible sensor suite of four imagers and five hyperspectral imagers (collectively called UVISI) on MSX are described by Hefferman et al. (1996) and Paxton et al. (1996).
In the first part of the mission (May, 1996 to February, 1997), the infrared instruments had the highest priority and were used to scan many interesting regions of the sky. Although the two UV imagers and five hyperspectral imagers (SPIMs) did take data during this phase, while the IR measurements were being made, it was only after the cryogen ran out (February 1997) that the full suite of UVISI sensors were used to begin a systematic survey of the sky as well as dedicated observations of specific regions. More than 400 observations (covering a substantial fraction of the sky) were obtained by the end of this phase of the mission in December 1997. These experiments were denoted as CB-10 (a systematic survey of the sky) and CB-11 (observations of specific celestial targets).
The Orion nebula has long been known to be one of the brightest regions of diffuse UV emission in the sky since the first (and only) observations from a sounding rocket flight by Carruthers and Opal (1977). Despite considerable internal (instrumental) scattering, they detected a diffuse signal amounting to approximately 10% of the direct starlight, which they attributed to the scattering of starlight from interstellar dust in Orion.
In the present paper, we describe the three MSX observations, or “data collection events” (referred to as DCEs hereafter), in which the UVISI sensors were directed toward various regions in Orion. We detected intense UV emission in all three fields. In the following sections we describe our observations and results.
2 Observations
| Instr. | Bandpassa | Field of Viewb | Res.c |
| IUW | 1240 - 1380 Å (Filter 3) | 3′ | |
| 1430 – 1760 Å (Filter 6) | |||
| IVW | 4000 - 8500 Å (Filter 3) | 3′ | |
| IUN | 2000 - 2500 Å (Filter 3) | 20′′ | |
| 2000 - 2670 Å (Filter 4) | |||
| 2230 - 2710 Å (Filter 5) | |||
| IVN | 2900 – 8270 Å | 20′′ | |
| Spectrographic Imagers (SPIMs) | |||
| SPIM1 | 1350 - 1740 Å | 6 Å | |
| SPIM2 | 1640 - 2530 Å | 7 Å | |
| SPIM3 | 2520 - 3910 Å | 19 Å | |
| SPIM4 | 3790 - 5850 Å | 31 Å | |
| SPIM5 | 5810 - 8970 Å | 40 Å | |
-
a
The bandpass for the imagers was selectable using a variety of filters; we have listed only those used in our observations.
-
b
The field of view for the SPIMs was selectable; only those options that were used in our observations are listed here. In all of our observations the SPIMs were operated with a spatial scan mirror, resulting in an effective field of view of SPIM 1 included a BaF2 filter to block the atmospheric HI and OI lines.
-
c
The listed resolutions are spatial resolutions for the imagers and spectral resolutions for the SPIMs. In the cryogen phase the spectral resolution of the SPIMs was half that listed because of binning forced upon us by data bandwidth restrictions.
Because the 9 UVISI instruments were designed to observe a variety of phenomena, from ballistic missiles in midcourse to the faint diffuse astronomical radiation, a plethora of filters and operating modes were available. We list those used in our observations in Table 1. In the cryogen phase, when SPIRIT III was operational, the bandwidth available for the UVISI instruments was limited such that we were only able to download the data from one imager at a time. However, we could power two (or more) imagers and download the data from each alternately. In our cryogen phase observations, we routinely used both the narrow and wide field UV imagers. with half of the total exposure time in each. The SPIMs took much less bandwidth and we were able to operate all 5 even in the cryogen phase, albeit at a reduced spectral and spatial resolution. There were no bandwidth restrictions in the post-cryogen phase and we operated all 9 instruments at their full resolutions.
All the UVISI instruments used essentially identical detectors — intensified CCDs — with different photocathodes. Incoming light ejected electrons from the photocathode which were amplified by a micro-channel plate to strike a green phosphor coupled by a reducing fiber optic taper to the CCD. The gain of the MCP was adjustable over a dynamic range of 109; however, because we were interested in observations of relatively faint astronomical sources, we normally operated at a gain high enough that individual photons could be detected well over the background. The dynamic range within a scene was more limited and we could not always use the photon counting mode because of bright stars in the field of view. In particular, this was the case for the wide field imagers in the Orion observations.
The CCDs were read every half second (with an integration time of 467 milliseconds) and the data were dumped to an on-board tape recorder. This rapid readout resulted in an enormous amount of data, typically 1 GB per data collection event (DCE). These data were processed at the Applied Physics Laboratory of the Johns Hopkins University under the supervision of the DCATT (Data Certification and Technology Transfer) team, whose responsibility it was to certify the process and the data. The starting point for our scientific analysis was “Level 1CA” data: CCD images with a distortion correction, flat fielding and calibration already applied.
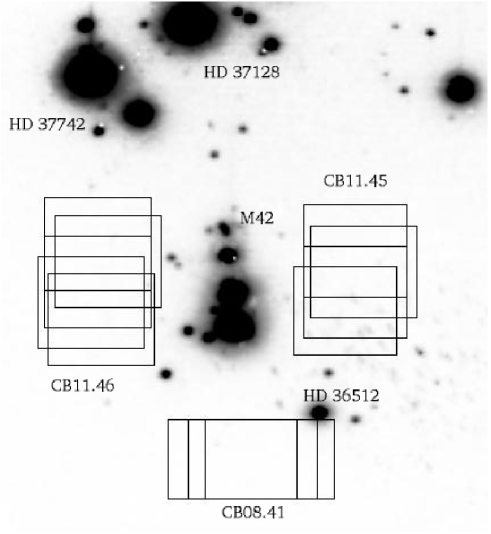
We observed three regions in Orion, one in the cryogen phase and the other two after the SPIRIT III instrument was turned off. These observations are denoted, in temporal order:
CB08-41 (UJ_CB08010004101_05_9999B),
CB11-45 (UJ_CB11010004501_05_9999A), and
CB11-46 (UJ_CB11010004601_05_9999B)
and are superimposed on an IUW image of Orion in Fig. 1. In each DCE, we observed a specific location for 10 minutes and then offset the pointing by about . This was repeated for a total of four pointings per DCE (three for CB08-41) with significant field overlap. In each of the two later observations (CB11-45 and CB11-46) filter changes were made after each pointing. The SPIMs used a scanning mirror to observe a field centered on the instrument boresight, overlapping much of the IUN field of view.
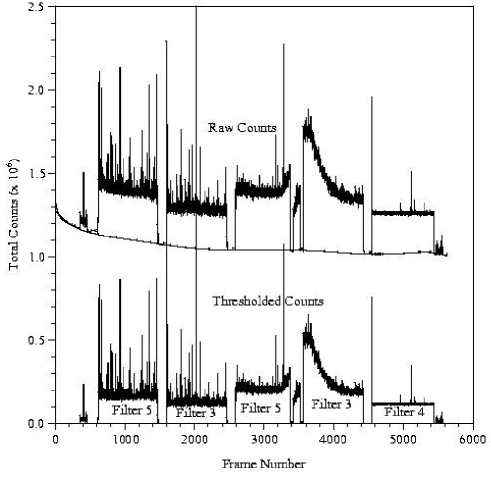
Although the 0.5 second integration time of the UVISI sensors resulted in an enormous amount of data, the large number of samples in a single DCE were invaluable for diagnostic information. As an illustrative example, we have plotted (Fig. 2) the total signal per frame from the narrow field of view imager (IUN) in CB11-45. At the beginning and end of each DCE and at every filter change the gain on the MCP was set to the minimum value and the observed count rate dropped to the CCD read noise, setting a floor for the observed signal (square wells in Fig. 2). The read noise was parametrized and subtracted from the data and the residual was thresholded to leave only individual photon hits (lower curve in Fig. 2). A few cosmic ray hits were bright enough to light up the entire detector and were easily identified (spikes in Fig. 2). In such a case the entire frame was discarded. Less intense events were also present and were removed by comparing the signal over several frames.
In addition, there was a general increase in the background level between frames 3200 and 4200 in all 9 instruments and persisting even through a filter closure and while the spacecraft was in an inertial hold. Similar increases in the total signal have occurred in other DCEs and, in particular, CB11-46 (executed on the following day) showed a rise at the same geographical position over central Africa. In other DCEs, the rise was over other regions of the Earth, typically at low geographical latitudes and often far from the South Atlantic Anomaly. Although we have been unable to identify the source of the signal, it is clearly terrestrial in origin and we have discarded all affected frames.
| counts pixel-1 s-1 | Effective Fluxa | |
|---|---|---|
| CB08-41 (start) | 0.0096 | 1700 |
| CB08-41 (end) | 0.0034 | 600 |
| CB11-45 (start) | 0.025 | 4400 |
| CB11-45 (end) | 0.010 | 1750 |
| CB11-46 (start) | 0.025 | 4400 |
| CB11-46 (end) | 0.023 | 4000 |
-
aphotons cm-2 sr-1 s-1 Å-1
This column contains the dark count converted into an effective photon flux (using the same calibration as was used for the data).
At this point, we were left with a series of frames containing the astrophysical signal plus an instrumental dark noise. These frames were added together to form a single FITS file for each instrument and for each pointing. The data product from the imagers was an image of the region observed and from the SPIMs it was a 3-dimensional file with 2 spatial dimensions and one spectral.
The dark noise in the imagers (at the operational gain) was only read at the beginning and end of the DCEs (for about a minute each) and these values are tabulated in Table 2. (Note that in CB11-45 and CB11-46 there actually was another measurement in the middle of the DCE which was compromised by the general increase in the background level already discussed.) We have used the mean of these two values as the effective dark current throughout the observation. The deviation between the two values was added in quadrature to the other errors to yield a total uncertainty. In all cases the measured dark current was much less than the observed signal.
Because there were far fewer SPIM pixels and because there were no intermediate points for the CCD read noise parametrization, the background definition in the SPIMs is very uncertain. Fortunately, SPIM 1 included a barium fluoride (BaF2) filter which cut off all light below 1350 Å, allowing an absolute measurement of the effective background level. There was some wavelength overlap between the different SPIMs and we could estimate the background subtraction in the other SPIMs by forcing the spectra to be continuous. However, in practice, because of the uncertainties in matching the continua and the cumulative errors in the longer wavelength SPIMs, we could only obtain useful results for SPIMs 1 and 2, the two UV SPIMs.
3 Calibration
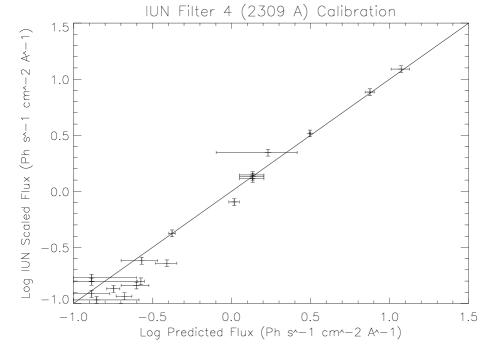

The Data Certification and Technology Transfer (DCATT) team had primary responsibility for characterizing and calibrating the instrument. However, the calibration in the photon counting mode was dependent on the details of the processing and we evolved our own calibration procedures (Newcomer et al. 2001). We extracted stars from many different DCEs and identified them using the SIMBAD database. If, and only if, the stars had TD-1 fluxes with reliable spectral types, we calculated their brightness in each of the instruments and filters and compared with the observed brightmess. We have plotted one of these calibration curves in Fig. 3; others are shown by Newcomer et al. (2001). In each case, the calibration proved to be both linear and stable over a large range of brightnesses and over the lifetime of the satellite. Note that we were forced to reject many of the observed stars for calibration purposes because of spectral types which were clearly inconsistent with the TD-1 measurements.
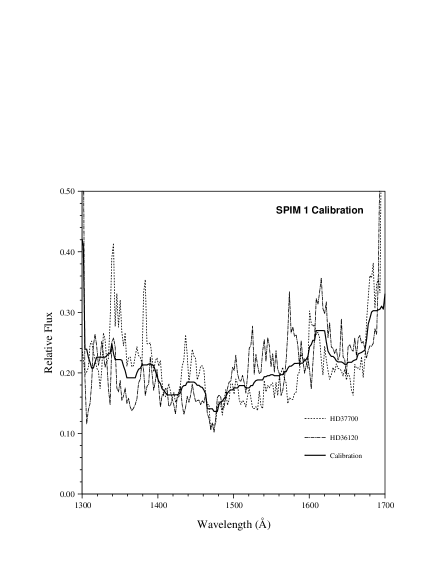
The SPIM calibration is based on two stars (HD 36210 and HD 37700) for which high quality IUE spectra (both SWP and LWP) exist. We integrated the flux around each star, estimating the background from the neighbouring pixels, and compared with the archived IUE spectra. The calibration curves derived from the two stars (independently) are plotted in Fig. 4 and are entirely consistent with each other. Because our primary spectroscopic science comes from SPIMs 1 and 2, the two UV SPIMs, and because of the background subtraction problems in the longer wavelength SPIMs, we have focussed on the data from those two spectrographs in this paper.
4 Results
| Fluxa | |
|---|---|
| CB08-41 (Filter 4) | |
| CB08-41 (Filter 4) | |
| CB08-41 (Filter 4) | |
| CB11-45 (Filter 3) | |
| CB11-45 (Filter 5) |
- aphotons cm-2 sr-1 s-1 Å-1
We observed intense diffuse ultraviolet emission in three regions around M42 in Orion at levels of more that photons cm-2 sr-1 s-1 Å-1 to the east and west of M42. A lower, but still high, level of 8000 photons cm-2 sr-1 s-1 Å-1 was observed south of the nebula (CB08-41). Instrumental scattering from the many bright stars in Orion was clearly visible in a few pointings in each DCE and we have used only those parts of each image which were observed in multiple pointings and in which the measured flux was consistent between pointings.
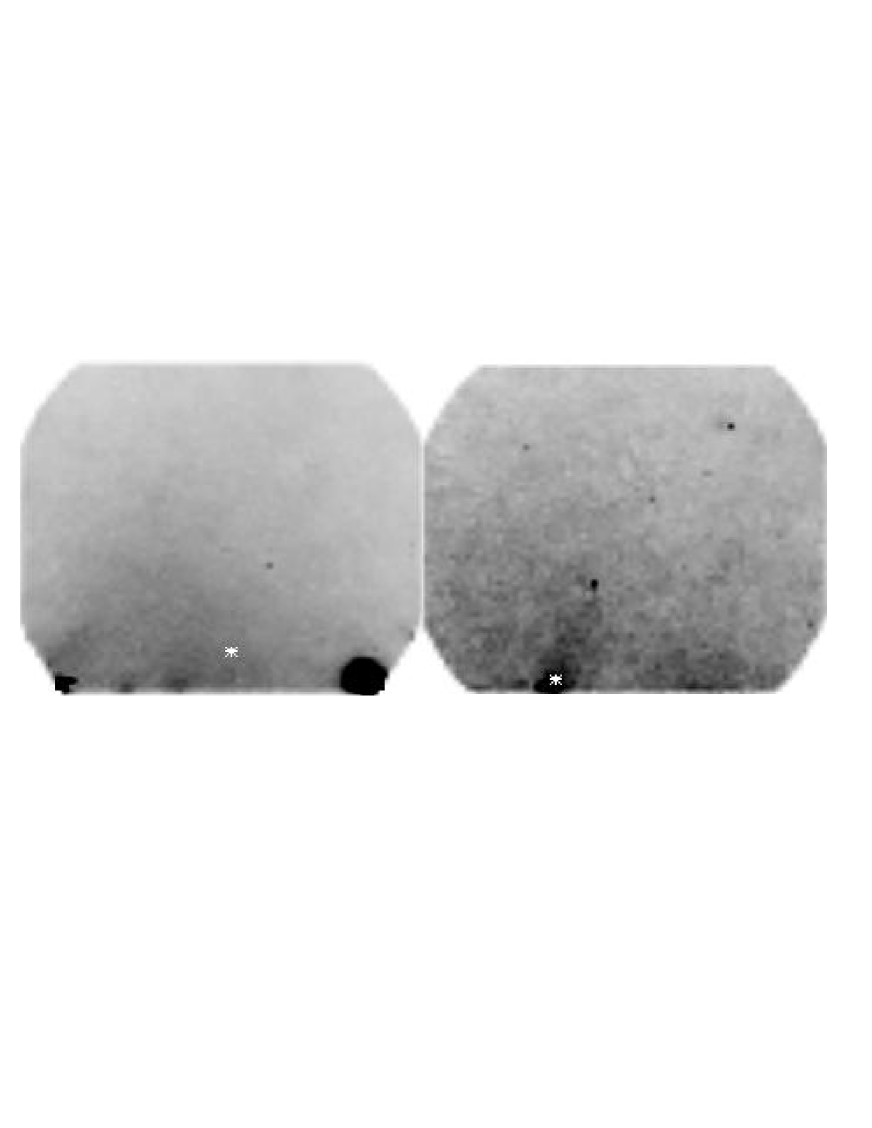
In two of the DCEs — CB08-41 and CB11-45, to the south and west of M42, respectively — the flux was uniform with levels tabulated in Table 3. However, a bright patch was observed in CB11-46 (Figure 5), most likely emission from the outlying regions of the complex of molecular clouds detected by Ogura & Sugitani (1998) about 15′ away.
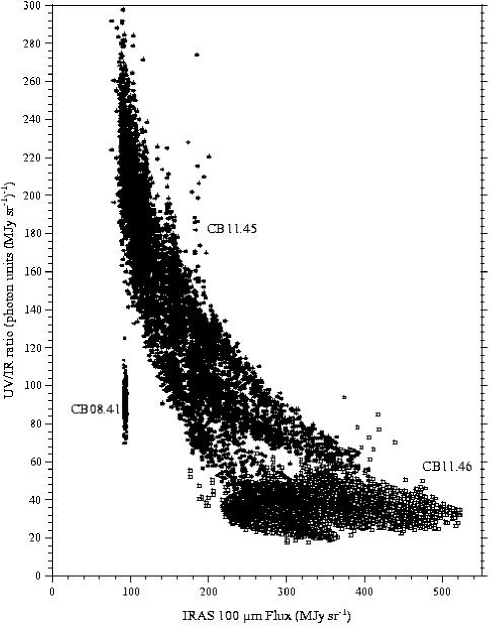
The UV flux is tightly correlated with the 100 m IRAS emission in CB11-46 (Figure 6) with a UV-IR ratio of about 40 photons cm-2 sr-1 s-1 Å-1/(MJy sr-1)-1. The UV to IR ratio from the other two observations is quite different (also plotted in Fig. 6), particularly for CB11-45 where the UV flux does not vary at all despite a factor of 4 variation in the IRAS 100 m flux.
The only other determination of the UV to IR ratio has come from Haikala et al (1995) who used FAUST observations of an isolated Galactic cirrus cloud to derive a ratio of 128 photons cm-2 sr-1 s-1 Å-1(MJy sr-1)-1. Although the combination of UV and IR observations of the same region can provide great insight into the optical properties of the dust grains, both the UV and the IR emission are highly dependent on the exact geometry of the stars and the dust and detailed modeling is required to deconvolve the properties and nature of the dust.
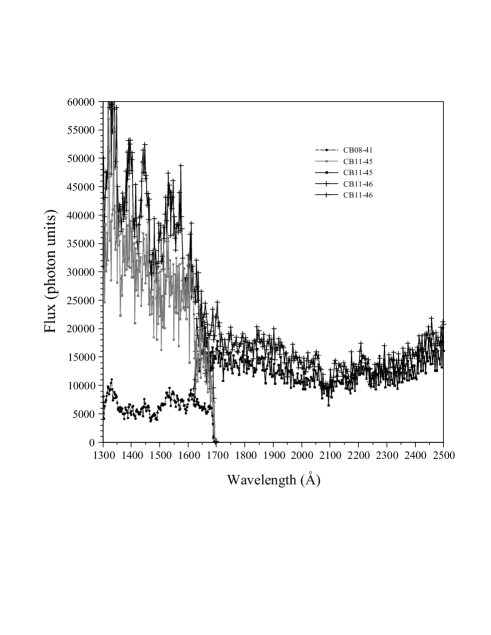
We also obtained spatial maps of the three DCEs with SPIMs 1 and 2 (due to processing problems only SPIM 1 was available for CB08-41). There was no evidence for spatial variability in the diffuse radiation detected by the SPIMs, after discarding the data near the bright stars in the field, and so we simply integrated over the entire field of view to give the spectra plotted in Figure 7. Allowing for the different instrumental passbands, the diffuse backgrounds detected by the SPIMs are consistent with those detected by IUN. We note that, because of a drop in the gain of the SPIMs in the middle of the DCE for CB11-46, the SPIMs observed only the eastern half of the field.
5 Conclusions
We have observed intense diffuse radiation from three fields around M42 in Orion. This background is much brighter to the east and west of the nebula with intensities of more that 2 x 10⁴ photons cm-2 sr-1 s-1 Å-1 dropping to 8000 photons cm-2 sr-1 s-1 Å-1 to the south of M42. In one of the DCEs (CB11-46 to the east of M42), we detected a bright patch which may be related to the nearby molecular clouds of Ogura & Sugitani (1998). In the other two regions, the emission was uniform.
The UV flux was directly correlated with the IR in CB11-46 with a ratio of about 40 photons cm-2 sr-1 s-1 Å-1 (MJy sr-1)-1. No such relation was observed in CB11-45 where, despite a factor of 4 variation in the IRAS 100 m flux, the UV was essentially constant over the field. The only other measurement of the UV-IR ratio was the 128 photons cm-2 sr-1 s-1 Å-1 (MJy sr-1)-1 obtained by Haikala et al (1995) for an isolated Galactic cirrus cloud. It is clear, and should be expected, that the UV-IR ratio is heavily dependent on the environment.
In principle, the combination of IR and UV observations in a single direction will strongly constrain the optical properties of the dust grains. Stellar radiation penetrates into the interior of the clouds and some part is scattered in the UV. That part not scattered will be absorbed and then reemitted as thermal radiation in the IR. In practice, a detailed study is required to realistically model the penetration and subsequent reradiation of the input radiation field by the optically thick (in the UV) dust. We are beginning such a study for simple geometries where we have Voyager and IRAS data and hope, eventually, to extend it to more complex regions such as Orion.
This work was supported at the Johns Hopkins University by USAFG F19628-93-K-0004
References
- [1] Carruthers, G. R. & Opal, C. B. 1977, ApJ, 217, 96.
- [2] Haikala, L. K., Mattila, K., Bowyer, S., Sasseen, T. P., Lampton, M., & Knude, J. 1995, ApJL, 443, L33.
- [3] Heffernan, K. J., Heiss, J. E., Boldt, J. D., Darlington, E. H., Peacock, K., Harris, T. J., & Mayr, M. J. 1996, Johns Hopkins APL Technical Digest, V17, 198.
- [4] Mill, J. D., O’Neil, R. R., Price, S., Romick, G. J., Uy, O. M., Gaposchkin. E. M., Light, G. C., Moore Jr., W. W., Murdock, T. L., & Stair, A. T. 1994, Journal Spacecraft and Rockets, 31, No. 5 900.
- [5] Newcomer, R., Henry, R. C. , Murthy, J., Paxton, L. J., & Price, S. D. 2001.
- [6] Ogura, K. & Sugitani, K 1998, Publications of the Astronomical Society of Australia, 15, 91.
- [7] Paxton, L. J, Meng, C.-I., Anderson, D. E., & Romick, G. J. 1996, Johns Hopkins APL Tech. Digest, 17, 19.
- [8] Price, S. D., Tedesco, E. F. Cohen, M. Walker, R. G. Henry, R. C. Moshir, M. Paxton, L. J. and Witteborn, F. C. 1997 in “Proceedings of IAU Symposium 179, New Horizons from Multi-Wavelength Sky Surveys,” ed. B. J. McLean, D. A. Golombek, J. J. E. Hayes, and H. E. Payne (Dordrecht: Kluwer), 115.
- [9] Smith, N., Egan, M. P., Carey, S., Price, S. D., Morse, J. A., & Price, P. A. 2000, ApJ, 532, 145.