A Closer Look at the Soft X-ray Transient X160852: Long-term Optical/X-ray Observations
Abstract
We report long-term simultaneous optical and (RXTE) X-ray observations of the soft X-ray transient and low mass X-ray binary X160852 spanning from 1999 to 2001. In addition to the usual X-ray outburst and quiescent states, X160852 also exhibits an extended low intensity state during which the optical counterpart, QX Nor, is found to be about two magnitudes brighter than during quiescence. We detect optical photometric variability on a possible period of 0.5370 days with a semi-amplitude of mag in the band. The modulation could be orbital but is also consistent with a scenario invoking a superhump with decreasing period. We discuss the possibilities to distinguish between the orbital and superhump period cases. Observations of QX Nor during quiescence indicate an F to G type main sequence secondary while theoretical considerations argue for an evolved mass donor. Only an evolved mass donor would satisfy the condition for the occurrence of superhumps.
1 Introduction
Soft X-ray transients (SXTs) are a subclass of the low mass X-ray binaries (LMXBs), mass-transfer systems where matter donated by a late-type star is accreted onto either a neutron star (NS) or a black hole. SXTs are characterized by prominent outbursts separated by long periods of quiescence. The physical mechanism underlying the outbursts remains under debate, although the favored scenario at present is some variation of the disk instability model (see the recent review by Lasota 2001). During an outburst, the luminosity of SXTs increases by several orders of magnitude at all wavelengths. While the optical light is dominated by the accretion disk and the heated face of the companion during the outburst as in the persistent LMXBs, the quiescent state of SXTs offers the rare opportunity to study the mass donor “uncontaminated” by other sources of emission. Observations of the mass donor in quiescence can provide the orbital period of the system through ellipsoidal variations, the spectral type and radial velocity curve of the donor star, and also constrain the mass of the compact object. The majority of SXTs appear to contain black hole primaries and this group provides some of the best black hole candidates with the most stringent mass constraints.
X160852 is a member of the rarer group of SXTs with neutron star primaries (based on the detection of type I X-ray bursts). X-ray outbursts from this system have been recorded since the early 1970’s. While some of the data suggested a recurrence pattern of days (Murakami et al. 1980), Lochner & Roussel-Dupre (1994) reported a more complex outburst history. Hasinger & van der Klis (1989) classified X160852 as an Atoll source. Kilohertz quasi-periodic oscillations (QPOs) were discovered during the decay of the 1996 outburst (van Paradijs et al. 1996, Berger et al. 1996), twin QPO peaks with varying separation during the 1998 outburst (Mendez et al. 1998), and finally possible sideband oscillations (Jonker, Mendez & van der Klis 2000).
The optical counterpart of X160852, QX Normae, was discovered by Grindlay & Liller (1978) after an outburst in 1977. Wachter (1997) detected QX Nor in the IR and optical a few months after its outburst in 1996. If X160852 was to adhere to the recurrence pattern of its last two outbursts (February 1996 and 1998), the next outburst was expected to occur early in 2000. We report here on long-term optical and X-ray observations spanning from 1999 to 2001.
2 Observations
2.1 Optical
We performed CCD photometry of QX Nor with various CTIO telescopes between 1999 and 2001. A log of all observations can be found in Table 1. The YALO 1m telescope is operated exclusively in queue mode by a consortium consisting of Yale, AURA, University of Lisbon, and Ohio State University. The SSTO (Synoptic/Service/Target–of–Opportunity) Program at the CTIO 0.9m telescope provided queue scheduled observations about once per week during Feb–Jul 2000. Most observations of X160852 were carried out in the band with exposure times ranging from 600–900 s depending on the brightness of the target and/or observing conditions. The data were overscan-corrected, bias-corrected, and flat-fielded in the standard manner using IRAF. Photometry was performed by point spread function fitting with DAOPHOT II (Stetson 1993). The instrumental magnitudes were transformed to the standard system by comparison with previously calibrated local standards (Wachter 1997). The errors quoted here are the intrinsic 1 errors of this relative photometry. The 1 error at the different magnitude levels was derived from the rms scatter in the light curves of several comparison stars of appropriate brightness.
2.2 X-rays
The bulk of the X-ray observations utilized in this paper are the publicly available data from the All Sky Monitor 111provided by the ASM/RXTE teams at MIT and at the RXTE SOF and GOF at NASA’s GSFC. on board the the Rossi X-ray Timing Explorer (Bradt, Rothschild & Swank 1993). We also present data obtained with the RXTE proportional counter array (PCA). The PCA consists of five proportional counter units (PCUs) and is currently being operated with reduced duty cycles for three out of the five PCU detectors. X160852 was observed (with the PCA) 34 times from 2000 March 6 to 2000 May 24 and 14 times from 2001 January 2 to 2001 January 28. We also used the target-of-opportunity public domain data of X160852 from 2000 January 6 to 2000 January 16 (4 observations).
The observations were performed in various configurations; the X-ray data presented here were obtained using Standard 1 and Standard 2 modes. The Standard 1 mode has a time resolution of 1/8 s in one energy band (2-60 keV) and the Standard 2 mode has a time resolution of 16 s and 129 channels in the 2-60 keV energy band. The Standard 1 data were used to exclude time intervals from the light curve in which type I X-ray bursts were present. We used the Standard 2 data to compute the intensity light curve based on the various PCUs available, excluding PCU 0 after 2000 12 May (due to the loss of the propane veto layer in PCU 0). X-ray timing and spectral analysis will be presented in a forthcoming paper.
We performed our data analysis using RXTE standard software FTOOLS 5.0 and our own IDL routines. We only utilized data obtained when the source was degrees above the Earth’s limb. Intervals measured within 30 minutes of passages of the South Atlantic Anomaly or during times of high particle background (ELECTRON 0 or 2 greater than 0.1) were discarded. Data were only extracted from the top layer of the PCUs. Background subtraction was performed using the sky-VLE model for observations when X160852 was bright (net count rate greater than 40 c s-1 PCU-1) and the L7-240 model for the faintest intensity observations.
3 Low Intensity State versus True Quiescence
As part of a monitoring program of SXTs in quiescence, we obtained several optical CCD frames of the X160852 field in May 1999. The ASM light curve indicated that the system was not active at the time and that months had passed since its last outburst in 1998. Consequently, we expected the optical counterpart, QX Nor, to be undetectable as in previous observations during quiescence. To our surprise, we observed the optical counterpart at the same brightness as in our observations only two months after the 1996 outburst (Wachter 1997), at an average level of , ! Wachter (1997) had speculated that QX Nor was still bright two months after the outburst due to a delayed outburst decay in the optical compared to the X-rays. However, finding the counterpart at similar brightness 13 months after an outburst clearly requires an alternative explanation.
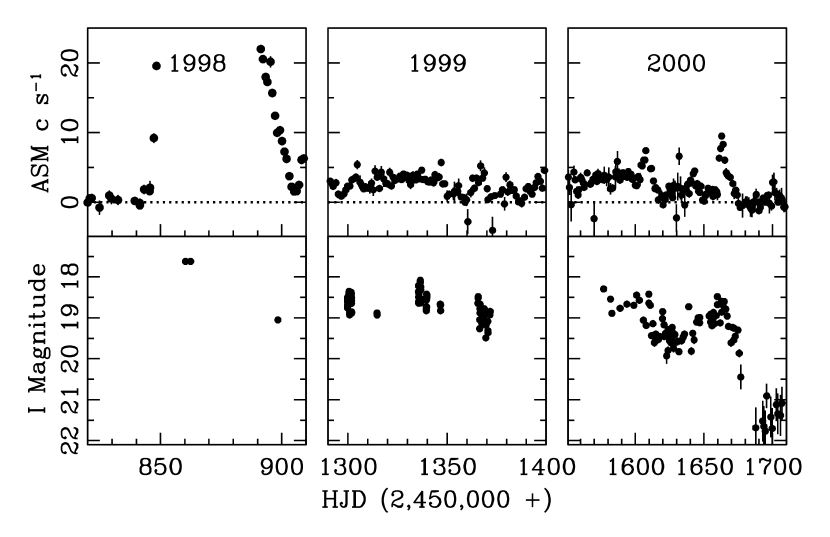
After continued monitoring of QX Nor in June and July 1999 and the first half of 2000, it became clear that X160852 exhibits three distinct states: the outburst state, an extended low intensity state (LIS), and the quiescent state. We will refer to the quiescent state as true quiescence (TQ) in order to distinguish it from the LIS that was previously thought to also represent the quiescent state of the system. Figure 1 illustrates the various source states observed in the X-ray and optical. The only optical observations of QX Nor during an X-ray outburst have been reported by Corbel & Chapuis (2000) and are reproduced in the figure. During the 1998 outburst ( ASM counts s-1 at peak), the optical counterpart reached . During the 1999 and most of the 2000 observations, the source is in the LIS ( ASM counts s-1) with a corresponding optical brightness of . The variability apparent in the optical data in this state is partly due to the overall variation seen in the X-rays as well as possible orbital modulation (see Section 4). Only after 2000 May 16 (HJD 2,451,680) and prior to the 1998 outburst is the source at true quiescent levels. The ASM count rate hovers around zero and the optical counterpart drops to . Our optical data during TQ constitute the first detection of the quiescent optical counterpart and will be discussed in more detail below.
These different states of X160852 become even more apparent when considering the entire five year ASM light curve shown in Figure 2. After the outburst in 1996, X160852 remained in the LIS for months, then spent months in TQ, underwent a new outburst in 1998 followed by almost two years in the LIS, and finally TQ for about the last year. In January of both 2000 and 2001, the ASM data seem to show the decaying tail of a new outburst of X160852. Unfortunately, all of those data points fall in the time interval each year (November to January) when the source is very close to the sun and the recorded data points are the most unreliable. These time intervals can be easily identified in the long-term X-ray light curve as times with missing coverage and/or increased scatter and measurement errors. Even if all the data points can be trusted, the 2000 “outburst” would have been very short (there are several points that would correspond to the rise phase) compared to the previous two, and reached nowhere near the previously recorded peak values. If real, it seems more reminiscent of one of the higher variability spikes evident in the LIS on various occasions, e.g., around October 1996, March 1999, and May 2000. In addition, in the context of the outburst mechanism models, it might be more plausible for the system to replenish matter in the disk in TQ for some time before another major outburst can be sustained. The possible 2001 outburst is more difficult to evaluate. It would have started from TQ as expected, but also returned immediately into TQ as confirmed by the faintness of the optical counterpart. In contrast, X160852 remained in the LIS for extended periods after both the 1996 and 1998 outbursts. Our 2001 PCA data do show count rates of 20–90 counts s-1 PCU-1 during January 2–19, supporting the authenticity of some X-ray activity in X160852. By the date of the first optical observation (2001 February 1), however, the system had returned to TQ. It remains unclear, whether the 2001 event constituted a major outburst of the system akin to those in 1996 and 1998. We note that there are marked differences in the X-ray timing and spectral behavior between the outbursts in 2000 and 2001. For example, the low frequency noise in 2001 is much stronger than in 2000. This is true throughout the two outbursts. A detailed analysis of the X-ray data will be presented in a forthcoming paper.
Are the two non-outburst states, the LIS and TQ, unique features of X160852 or a universal characteristic of SXTs? The latter possibility might offer some additional clues to the physics underlying the outburst mechanism. Aql X-1 is the only neutron star SXT other than X160852 that has undergone multiple outbursts since the launch of RXTE and has sufficient X-ray flux to distinguish between possible LIS and TQ states. The ASM lightcurve from this source is shown in Figure 3. On occasion, Aql X-1 indeed seems to show the same two level states outside of outburst as observed in X160852: a LIS is seen for several months after the outburst in June 1999 as well as possibly between outbursts in 1996. Jain et al. (2001) report optical observations of Aql X-1 across the 1999 outburst and LIS. The behavior of the optical counterpart is strikingly similar to that of X160852: the Jain et al. (2001) light curve shows a persistent optical brightness at a level magnitude lower than during the peak of the outburst, but several magnitudes brighter than quiescence, during the period July–November 1999, immediately following the large X-ray outburst. We can also compare the X-ray luminosities of the various states for both of these sources. Chen, Shrader, & Livio (1997) list outburst peak / quiescent luminosities of about / ergs s-1 for X160852 and / ergs s-1 for Aql X-1. For X160852, our PCA data give ergs s-1 for the LIS luminosity in the 2-10 keV band. Jain et al. (2001) arrive at ergs s-1 for the LIS in Aql X-1 (the assumed distances for X160852 and Aql X-1 are 3.6 kpc and 2.5 kpc, respectively). Thus, the LIS is very similar in both sources. Interestingly, most outbursts of Aql X-1 do not lead to an LIS, and there is evidence for LISs unassociated with a true outburst state. Most recently, Bailyn et al. (2001) have reported an optical brightening of the Aql X-1 counterpart starting in June 2001, during which the ASM flux never exceeded 8 counts s-1. This LIS seems likely to be analogous to the modest X-ray activity observed in June 1996 and January 1999.
It is difficult to understand the LIS and TQ in the context of the pure disk instability model which describes the SXT phenomenon as a limit cycle between two discrete disk states. An outburst occurs when a heating front in the disk is triggered and initiates the transition from a quiescent, cold, low viscosity disk to a hot, high viscosity state. Subsequent cooling fronts return the disk to the quiescent state (e.g. Lasota 2001). The model does not produce an extended intermediate state analogous to the observed LIS. During the LIS, X160852 appears very much like a persistent LMXB, with a relatively stable X-ray flux and photometrically varying counterpart. Instead of returning directly to the quiescent cold disk after an outburst, X160852 seems to retain a luminous accretion disk with a stable mass transfer rate sufficient to sustain an elevated X-ray flux for an extended period of time. The presence of a luminous accretion disk during the LIS is supported by the observation that the brightness of the optical counterpart does not decrease as strongly from outburst state to the LIS as from LIS to TQ. Figure 1 shows that the optical counterpart increases in brightness by about two magnitudes from TQ to LIS, but at most one magnitude between the LIS and the peak of the outburst (when the X-ray flux increases by a factor of more than 20). A similarly small optical brightness difference between the LIS and full outburst level is seen in the 1999 Aql X-1 outburst. This implies that the main optically luminous components that are created in the system during the outburst are retained for the duration of the LIS. The major elements likely to change during an SXT outburst are the size and luminosity of the accretion disk. Any additional brightening during outburst in the optical is probably due to an increase in X-ray irradiation of the disk and the mass donor and represents a smaller contribution to the overall brightness of the system than the transition from the cold quiescent disk to the hot disk during outburst and the LIS.
The LIS is reminiscent of the standstills seen in the optical light curves of Z Cam type cataclysmic variables (CVs). For Z Cam systems, the decline from outburst is interrupted and the systems remain at about 0.7 mag below the peak brightness (e.g. Warner 1995, p. 163). The duration of the standstills varies from ten days to years. After a standstill, the system returns to its usual quiescent state. These observed properties are interpreted in the framework of the disk instability model where the mass transfer rate from the secondary fluctuates about the critical rate that separates stable systems from those that undergo dwarf nova outbursts. Buat-Menard, Hameury, & Lasota (2001) show that heating of the outer disk by the accretion stream impact point also has to be included to successfully model observed Z Cam type lightcurves. Stellar spots have been suggested as the main cause for the required variations in mass transfer rate.
In the case of X160852, it is unclear why the transition to TQ eventually occurs and why the LIS can last for very different periods of time (between 10 months and 2 years according to the present RXTE data set). Figure 4 shows the details of the transition from the LIS to TQ during 2000. The ASM data indicate two plateau-like levels preceding TQ, each separated by a small X-ray “flare” (HJD 2,451,608 and 2,451,663). The optical data mimic this behavior although the plateaus and the subsequent flares are less pronounced, most likely due to the intrinsic optical variability during the orbital cycle (see Section 4). The decay via the observed plateaus may be explained by discrete physical changes in the disk as a consequence of a decrease in mass transfer rate. The mass transfer rate in turn might decrease due to diminishing X-ray irradiation. X-ray irradiation is increasingly recognized to play a crucial role in transient outbursts. X-ray irradiation stabilizes the accretion disk against the thermal instability that causes SXT outbursts and increases the mass transfer rate from the mass donor (Hameury, Lasota, & Warner 2000; Smak 1995). The LIS might occur because the level of X-ray irradiation in X160852 after a major outburst is sufficient to stabilize the mass transfer rate slightly above the critical level separating persistent and transient behavior. However, since the system is so close to this critical boundary, any change in the X-ray irradiation could trigger a decay to quiescence. Such a change in X-ray irradiation might be due to the development of transient vertical structure in the disk that shields a large fraction of the disk and the mass donor from the central X-ray flux. The secondary and disk cool, the mass transfer rate from the secondary drops, and the disk temporarily stabilizes at a lower mass transfer level. However, the new accretion rate and associated X-ray irradiation are now insufficient to induce long-term stability in the disk, so the mass transfer declines further and the disk eventually reaches the quiescent state. The return to TQ in the optical appears to be delayed with respect to the X-ray decay. Unfortunately, our optical data are very sparse during the transition and we can only estimate the delay to be on the order of 2–5 days.
4 Periodic Optical Modulation
Figure 5 shows the optical band light curve of QX Nor obtained in 1999 May, June, and July when the system was in the LIS. The source exhibits large amplitude variations of up to 0.6 mag during each night as well as pronounced changes in overall brightness between the observations in different months. The May observations in particular are highly suggestive of a periodic modulation. We searched the individual and combined 1999 data sets for a periodic variability component with CLEAN (Roberts, Lehar & Dreher, 1987) and PDM within IRAF (Stellingwerf 1978). A strong signal for a period around 0.5 days is found in the individual data set from each month; however, this period is not apparent when all the data are combined. More detailed analysis shows that this is due to the large changes in the overall system brightness. Detrending the data (i.e. correcting the data for an overall shift in the magnitude level for each night) is difficult. Simply offsetting by a nightly average does not work due to the large amplitude variability and differences in orbital phase coverage on each night. On nights with very few measurements we cannot unambiguously determine which part of the light curve is sampled and/or the data do not include reference points (either the maximum or minimum transition) that indicate the overall brightness of the system. We finally assumed that the system was at a constant level for all of the May data, and at a different but constant level for the first two nights of the June data. These data then define the full amplitude between maxima and minima. Subsequently, we only corrected those data to the level of the May measurements for which either a maximum or minimum transition is visible and discarded nights with only a few data points for the purpose of the period analysis. For this detrended data set, PDM and CLEAN give best periods of 0.546, 0.538, 0.531, and 0.5370 days for the May, June, July and combined data sets, respectively.
Figure 6 shows the detrended data from each month folded on the 0.5370 day period, with the reference point for the phasing fixed at the time of the first observation in May. Each data set clearly displays variability on this period, however, there is also some indication of a phase shift from one month to the next. This phase shift, as well as the tendency towards increasingly shorter periods (when each month’s data are considered separately), led us to consider superhumps, in addition to more traditional mechanisms, as the cause of the photometric variability. In the past, photometric modulation in LMXBs was thought to be due to either the varying aspect of the heated face of the mass donor or ellipsoidal variations from the distorted shape of the mass donor. In both cases, the modulation is strictly periodic and only differs in the number of maxima and minima per orbital cycle. Haswell et al. (2001) discussed possible mechanisms for superhumps in LMXBs and claimed that for many LMXBs (with low inclination) the observed variability is more likely to be a superhump than an orbital modulation. Superhumps are common in CVs, where they are believed to be the consequence of an eccentric, precessing disk (Warner 1995). Superhump periods are usually a few percent (%) longer than the orbital period and have been found to slowly decrease in length during outbursts. Aql X-1 may also show superhump behavior. Jain et al. (2001) report stable periodicity in the early stages of the 1999 outburst of that object at a period of hours, somewhat smaller than the 18.9 hr period observed by many authors during outburst, and suggest that the outburst periodicity may be superhumps.
Figure 7 shows our detrended light curve data together with two fits, corresponding to sine waves with either a fixed period of 0.5370 days, or with a time variable period of the form . In both cases, the sine wave semi-amplitude was held constant at 0.27 mag. For the variable period, the best fit is achieved with days and . The superhump (time-variable) period gives a marginally better fit with rms versus rms for the constant orbital period scenario, but there is clearly not enough data to conclusively distinguish between these two possibilities. However, this duplicity could be easily resolved during a future bright state of the optical counterpart. Several extended monitoring campaigns could be planned in such a way as to cover time intervals when the two mechanisms produce modulation that is clearly out of phase. Alternatively, radial velocity studies in TQ could unambiguously determine the orbital period of the system, but would require much larger telescopes. In any case, the orbital period of the system is likely to be close to 0.537 d, since orbital and superhump periods generally differ by only a few percent. If the optical emission in the system is dominated by reprocessing of X-rays in the disk and the facing side of the mass donor, the detection of superhump modulation will depend on the inclination of the system according to Haswell et al. (2001). Superhump modulation is expected to be visible only in low inclination systems, while brightness variations due to the X-ray heated face of the secondary will dominate in high inclination systems. Identifying the process underlying the photometric variability could, therefore, offer the first clues to the inclination of X160852.
5 The Quiescent Counterpart
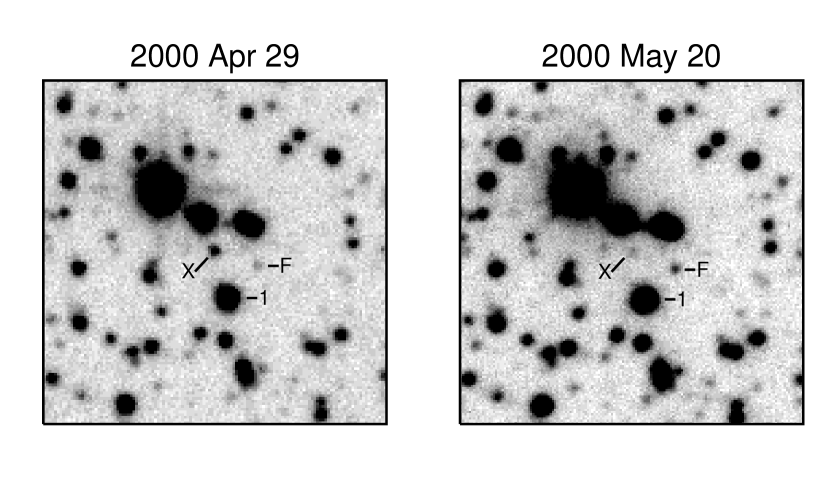
According to the 2000 ASM, PCA, and optical light curves (see Figure 4), X160852 entered its TQ state around HJD 2,451,680 (2000 May 16). In the TQ state, photometry of the optical counterpart with the YALO (1m) telescope is only possible under exceptional observing conditions and with limited accuracy (see Figure 8). Averaging all YALO detections after HJD 2,451,680, we measure . In order to derive more accurate quiescent magnitudes, we also observed the counterpart with the CTIO 1.5m telescope on 2000 May 20–22, and again in 2001 June 01 with the CTIO 4m telescope. The observations on the CTIO 1.5m were obtained only a few days after the source faded to TQ. The observations on the CTIO 4m telescope, taken over a year later, provide the opportunity to determine whether the brightness level detected with the YALO after HJD 2,451,680 indeed represents a stable quiescent state or whether the counterpart has faded to even fainter magnitudes in the intervening months.
Figure 8 shows two frames of the X160852 field. The image on the left was obtained with the YALO telescope when the source was still in the LIS, the image on the right was created by combining four 900 s exposures from the CTIO 1.5m in the TQ state. Notice the change in brightness relative to the faint comparison star F (). The quiescent counterpart is clearly detected in the CTIO 1.5m data with an average brightness of , consistent with the YALO data within the errors. Unfortunately, accurate photometry of the faint counterpart is very difficult since it is strongly affected by the PSF of the nearby bright stars even under good seeing conditions. The observations with the CTIO 4m were mainly obtained in the band, since band observations with the MOSAIC II instrument are susceptible to fringing that is difficult to correct in the crowded field of X160852. We measure and , confirming that our data actually reflect a stable quiescent state.
Previously, Wachter (1997) reported the detection of the IR quiescent counterpart and derived constraints on the spectral type of the mass donor. We can combine our and band measurements with those and values, and repeat the calculations. We use a distance estimate of 3.6 kpc based on type I X-ray bursts with photospheric radius expansion (Nakamura et al. 1989). The extinction towards X160852 is highly uncertain. The hydrogen column density () derived from X-ray spectral fits in the literature ranges from (1.0–2.0) cm-2. Rutledge et al. (1999) use two representative values of cm-2 and cm-2 for their recent reanalysis of X160852 X-ray spectra. Utilizing the relationships between and by Gorenstein (1975) and Predehl & Schmitt (1995) leads to for the range of . A lower limit on the extinction can be estimated from the observations of the open cluster Ruprecht 115 by Piatti, Claria & Bica (1999) which is located only ’ away from X160852. The cluster is found to lie at a distance of 2.5 kpc with an extinction of E(B–V)=0.6, corresponding to . It is also unclear whether the absorbing material is distributed between the observer and X160852 or within the LMXB itself.
Figure 9 illustrates the various photometric constraints on the spectral type of the mass donor. The extinction values for the different filters were calculated from using the relationships given in Cardelli, Clayton, & Mathis (1989). The shaded areas indicate the range in dereddened magnitudes for QX Nor in (arbitrarily chosen) intervals as follows: vertical shading – (); diagonal shading – (); horizontal shading – (). We will first consider the case of a main sequence donor. The spectral energy distributions of four different main sequence spectral types at a distance of 3.6 kpc are shown in Figure 9. A late F to early G type main sequence star appears to be the most consistent with the current data. One problem is the apparent lack of a unique extinction value associated with this choice. However, it is important to keep in mind that all the quiescent flux measurements of QX Nor carry a rather large uncertainty. In addition, a residual accretion disk could contribute some flux and thus distort the quiescent spectrum attributed to the donor star. As seen in the previous section, the source also varies strongly during the LIS. It is not clear what level of variability can be expected in TQ, but it adds another source of uncertainty to the quiescent measurements, which were taken years apart in some cases. The IR magnitudes place the strongest constraints on the spectral type. It would be important to repeat those measurements, as well as those at the other wavelengths, with higher accuracy and closer proximity in time.
While a giant mass donor is inconsistent with the quiescent magnitudes of X160852, we have to consider the possibility that the mass donor is evolved. In many LMXBs, both persistent and transient, main sequence donors would significantly underfill their Roche lobes. Consequently, somewhat evolved companions are required. For example, Shahbaz, Naylor & Charles (1993) conclude that their observations of the neutron star SXT Cen X-4 are most consistent with a subgiant mass donor. Steeghs & Casares (2001) show that the mass donor in Sco X-1 must be a significantly evolved subgiant. In addition, theory suggests that most NS systems require evolved mass donors in order to appear as transient systems (King, Kolb & Burderi 1996). In Figure 9, the spectral energy distributions for the various spectral types would shift to brighter magnitudes for evolved secondaries (we neglect for the moment any changes in colors due to the uncertainty of colors for subgiants), thus pushing a lower mass K star into the regime of possible mass donors. Using equation (10) from King, Kolb & Burderi (1996), we find as the condition for X160852 to exhibit SXT behavior (assuming =1.4 and P=0.537 d). is the ratio of the secondary mass to that of a main sequence star of equal density which would fill its Roche lobe in a binary of the same period. The mean density in a Roche-lobe filling star is determined solely by the binary period, g cm-3 (Frank, King, & Raine 1992). Assuming P=0.537 d, then g cm-3, which would correspond to an F0 main sequence star with (Cox 2000). Hence, we would derive for the mass of an evolved mass donor in X160852 that fulfills the condition for SXT behavior as given by King, Kolb & Burderi (1996).
Figure 10 illustrates the relationship between the size of the mass donor’s Roche lobe and the system’s mass ratio assuming three different NS masses. We calculated the Roche lobe size in a 0.5 day binary for a range of mass ratios () using the standard approximate analytic formula by Eggleton (1983),
| (1) |
together with Kepler’s law. For comparison, the radii of main sequence stars of various spectral types (taken from Cox 2000) are also shown. As calculated above, a main sequence F0 star would fill its Roche lobe in a 0.5 day orbit with a 1.4 NS. Slightly later F types are sufficient for higher mass NSs. This is a somewhat earlier spectral type than favored by the quiescent magnitudes. However, Figure 9 shows that a higher value for and/or a slightly larger distance would improve the agreement. The 3.6 kpc distance to the source was derived assuming specific values for the mass and radius of the NS and the anisotropy factor of burst emission (Nakamura et al. 1989) and allows variations of 20–40%. We have also indicated the case for an evolved mass donor, by repeating the calculations detailed in the previous paragraph for different masses of the NS. We note that only the case of an evolved mass donor will satisfy the condition required for the formation of superhumps if the disk eccentricity is caused by the 3:1 orbital resonance.
6 Conclusions
We have identified three distinct states in the X-ray and optical light curves of X160852. In addition to the previously recognized outburst and (true) quiescence states, X160852 also exhibits an extended low intensity state during which the optical counterpart, QX Nor, is found to be about two magnitudes brighter than during true quiescence. The LIS is characterized by the presence of a luminous accretion disk in the system. The optical counterpart displays pronounced variability that can be attributed to either the varying aspect of the X-ray irradiated face of the mass donor with an orbital period of 0.5370 days, or a time variable superhump period with days and . This ambiguity could be resolved with photometric monitoring during a future bright state of the system. If the mass donor is assumed to be a main sequence star, an F to G type star is consistent with the current observations. However, theoretical considerations argue for an evolved mass donor with a mass of (for a NS primary). Only an evolved mass donor would satisfy the condition for the occurrence of superhumps.
References
- (1)
- (2) Bailyn, C., Tourtellotte S., Walkowicz L., Gonzalez D., & Espinoza, J. 2001, IAU Circ.7646
- (3)
- (4) Berger, M. et al. 1996, ApJ, 469, L13
- (5)
- (6) Bradt,, H.V., Rothschild, R.E., & Swank, J.H. 1993, A&AS, 97, 355
- (7)
- (8) Buat-Menard, V., Hameury, J.-M., & Lasota 2001, A&A, 369, 925
- (9)
- (10) Cardelli, J. A., Clayton, G. C., & Mathis, J. S. 1989, ApJ, 345, 245
- (11)
- (12) Chen, W., Shrader, C. R., & Livio, M. 1997, ApJ, 491, 312
- (13)
- (14) Corbel, S. & Chapuis, C. 2000, in Proceedings of the 19th Texas Symposium on Relativistic Astrophysics and Cosmology, eds. E. Aubourg, T. Montmerle, J. Paul and P. Peter, (CEA Saclay), Nuclear Physics B (Proc. Suppl.), 80, CD-ROM 15/06
- (15)
- (16) Cox, A. N. (ed.) 2000, Allen’s Astrophysical Quantities, 4th ed. (New York: Springer-Verlag)
- (17)
- (18) Eggleton, P. P. 1983, ApJ, 268, 368
- (19)
- (20) Frank, J., King, A., & Raine 1992, Accretion Power in Astrophysics, 2nd ed. (Cambridge: Cambridge University Press), p. 51
- (21)
- (22) Gorenstein, P. 1975, ApJ, 198, 95
- (23)
- (24) Grindlay, J. E., & Liller, W. 1978, ApJ, 220, L127
- (25)
- (26) Hameury, J.-M., Lasota, J.-P., & Warner, B. 2000, A&A, 353, 244
- (27)
- (28) Hasinger, G., & van der Klis, M. 1989, A&A, 225,79
- (29)
- (30) Haswell, C. A., King, A. R., Murray, J. R., & Charles, P. A. 2001, MNRAS, 321, 475
- (31)
- (32) Jain, R. K., Bailyn, C., Garcia, M. R., & Levine A. M. 2001, in preparation
- (33)
- (34) Jonker, P. G., Mendez, M. & van der Klis, M. 2000, ApJ, 540, L29
- (35)
- (36) King, A. R., Kolb, U., & Burderi, L. 1996, ApJ, 464, L127
- (37)
- (38) Lasota, J.-P. 2001, New Astronomy Reviews, in press, astro-ph/0102072
- (39)
- (40) Lochner, J. C., & Roussel-Dupre, D. 1994, ApJ, 435, 840
- (41)
- (42) Mendez, M., van der Klis, M., Wijnands, R., Ford, E. C., van Paradijs, J., & Vaughan, B. A. 1998, ApJ, 505, L23
- (43)
- (44) Murakami, T. et al. 1980, ApJ, 240, L143
- (45)
- (46) Nakamura, N., Dotani, T., Inoue, H., Mitsuda, K., Tanaka, Y., & Matsuoka, M. 1989, PASJ, 41, 617
- (47)
- (48) Piatti, A. E., Claria, J. J., & Bica, E. 1999, MNRAS, 303, 65
- (49)
- (50) Predehl, P., & Schmitt, J. H. M. M. 1995, A&A, 293, 889
- (51)
- (52) Roberts, D. H., Lehar, J., & Dreher, J. W. 1987, AJ, 93, 968
- (53)
- (54) Rutledge, R. E., Bildsten, L., Brown, E. F., Pavlov, G. G., & Zavlin, V. E. 1999, ApJ, 514, 945
- (55)
- (56) Shahbaz, T., Naylor, T., & Charles, P. A. 1993, MNRAS, 265, 655
- (57)
- (58) Smak, J. 1995, Acta Astronomica, 45, 355
- (59)
- (60) Steeghs, S. & Casares, J. 2001, ApJ, in press, astro-ph/0107343
- (61)
- (62) Stellingwerf, R. F. 1978, ApJ, 224, 953
- (63)
- (64) Stetson, P. B. 1993, DAOPHOT II User’s Manual (Victoria:Dominion Astrophys. Obs.)
- (65)
- (66) van Paradijs et al. 1996, IAUCirc. 6336
- (67)
- (68) Wachter, S. 1997, ApJ, 485, 839
- (69)
- (70) Warner, B. 1995, in Cataclysmic Variable Stars, (Cambridge: Cambridge Univ. Press), 194
- (71)


| Date-Obs (UT) | Telescope | Obs | Filters |
|---|---|---|---|
| 1999 May 0103 | CTIO 1.5m | 30 | , |
| 1999 Jun 0617 | CTIO 0.9m | 37 | , |
| 1999 Jul 0612 | CTIO 0.9m | 26 | |
| 2000 Feb 02Aug 01 | CTIO 0.9maaSome data collected under the SSTO program - see text. | 55 | , , |
| 2000 Mar 04Jun 11 | YALO | 95 | , |
| 2000 May 2022 | CTIO 1.5m | 18 | |
| 2001 Feb 07Jun 01 | YALO | 24 | |
| 2001 Jun 01 | CTIO 4m | 6 | , |