The mass of radio galaxies from low to high redshift 11institutetext: Sterrewacht Leiden, Postbus 9513, 2300 RA Leiden, The Netherlands 22institutetext: Astrophysics, Department of Physics, Keble Road, Oxford, OX1 3RH, UK 33institutetext: Department of Physics and Astronomy, University of Wales College of Cardiff, P.O.Box 913, Cardiff, CF2 3YB, UK
The mass of radio galaxies from low to high redshift
Abstract
Using a new radio sample, 6C* designed to find radio galaxies at along with the complete 3CRR and 6CE sample we extend the radio galaxy relation to . The 6C* data significantly improve delineation of the relation for radio galaxies at high redshift (). In a spatially flat universe with a cosmological constant ( and ), the most luminous radio sources appear to be associated with galaxies with a luminosity distribution with a high mean (), and a low dispersion ( mag) which formed their stars at epochs corresponding to .
1 The advantages of using radio galaxies
Radio galaxies provide the most direct method of investigating the host galaxies of quasars if orientation based unified schemes are correct. The nuclear light which dominates the optical/near-infrared emission in quasars is obscured by the dusty torus in radio galaxies, therefore difficult psf modelling and subtraction are not required to determine the properties of the underlying host galaxy. Unfortunately compiling samples of radio loud AGN is a long process, because of the radio selection there is no intrinsic optical magnitude limitation, making follow-up observations extremely time consuming, especially when dealing with the faintest of these objects. However, low-frequency selected radio samples do now exist with the completion of 3CRR (Laing, Riley & Longair 1983) along with 6CE (Eales et al. 1997; Rawlings et al. 2001) and the filtered 6C* sample (Blundell et al. 1998; Jarvis et al. 2001a; 2001b). We can now use these radio samples to investigate the underlying stellar populations through the radio galaxy Hubble diagram.
2 Previous radio samples and the Hubble diagram
There has been much interest in the relation for radio galaxies in the past decade. Dunlop & Peacock (1993) using radio galaxies from the 3CRR sample along with fainter radio sources from the Parkes selected regions demonstrated that there exists a correlation between radio luminosity and the band emission. Whether this is due to a radio luminosity dependent contribution from a non-stellar source or because the galaxies hosting the most powerful radio sources are indeed more massive galaxies has yet to be resolved. Eales et al. (1997) confirmed this result and also found that the dispersion in the band magnitude from the fitted straight line increases with redshift. This result, along with the departure to brighter magnitudes of the sources at high redshift led Eales et al. to conclude that we are beginning to probe the epoch of formation of these massive galaxies. Using the highest redshift radio galaxies from ultra-steep samples of radio sources van Breugel et al. (1998) found that the near infrared colours of radio galaxies at are very blue, consistent with young stellar populations. They also suggest that the size of the radio structure is comparable with the size of the near infrared region, and the alignment of this region with the radio structure is also more pronounced at . Lacy et al. (2000) using the 7C-III sample found evidence that the hosts of radio galaxies become more luminous with redshift and are consistent with a passively evolving population which formed at high redshift (). Thus, all of this work points to a radio galaxy population which formed at high redshift and has undergone simple passive evolution since. However, all of these studies were made with only a few high-redshift () sources. With the 6C* sample we are now able to probe this high-redshift regime with increased numbers from samples with well-defined selection criteria.
3 The 6C* filtered sample
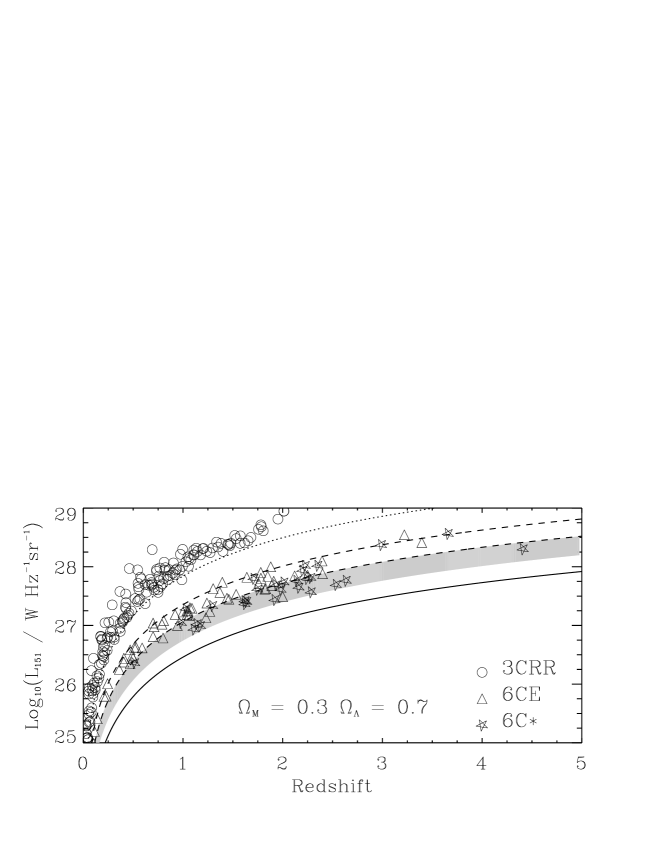
The 6C* sample is a low-frequency radio sample ( Jy) which was originally designed to find radio sources at using filtering criteria based on the radio properties of steep spectral index and small angular size. The discovery of 6C*0140+326 at (Rawlings et al. 1996) and 6C*0032+412 at (Jarvis et al. 2001a) from a sample of just 29 objects showed that this filtering was indeed effective in finding high-redshift objects. Indeed, the median redshift of the 6C* sample is whereas for complete samples at similar flux-density levels the median redshift is . We can now use this sample to push the radio galaxy diagram to high redshift () where it has not yet been probed with any significant number of sources. Fig. 1 shows the radio luminosity-redshift plane for the three samples used in this analysis.
4 Emission-line contamination
The most-luminous sources at high redshift may be contaminated by the bright optical emission lines redshifted into the infrared. This is particularly true for sources in radio flux-density limited samples. The high-redshift sources in these samples are inevitably some of the most luminous, and we also know there is a strong correlation between low-frequency radio luminosity and emission-line strength (e.g. Rawlings & Saunders 1991; Willott et al. 1999; Jarvis et al. 2001a) which will increase the contribution to the measured band magnitudes from the emission lines in the most radio luminous sources.
To subtract this contribution we use the correlation between [OII] emission-line luminosity and the low-frequency radio luminosity from Willott (2000), where . Then by using the emission-line flux ratios for radio galaxies (e.g. McCarthy 1993) we are able to determine the contribution to the band magnitude from all of the other emission lines. This is illustrated in Fig. 2 where the emission-line contamination to the band flux is shown for various radio flux-density limits and a range of redshifts.

5 The relation

In Fig. 3 we plot the diagram for all of the sources in our dataset. We also show four synthetic galaxy evolution models from the ‘Galaxy Isochrone Synthesis Spectral Evolution Library’ (GISSEL) of Bruzual & Charlot (1993) and a curve representing a galaxy which undergoes no-evolution. The GISSEL files that we have used are ones in which there is an instantaneous burst of star formation and one in which the burst of star formation lasts 1 Gyr, with a Salpeter IMF with a lower mass cut-off of 0.1 M⊙ and an upper mass cut-off of 125 M⊙. We use two different assumptions about the star formation history, one in which the burst of star formation begins at and one in which the burst occurs at .
The no-evolution curve was constructed by taking the spectral energy distribution template from the GISSEL library that was found to fit the observed spectral energy distribution of a radio galaxy at , and which also reproduced the near-infrared colours. All of the curves are normalised to pass through the low-redshift () points.
With our data on the 6C* sample in addition to the 6CE and 7C-III samples we find that in a low-density universe ( and ) the data are predominantly brighter than the no-evolution curve and are consistent with a passively evolving stellar population with a high-formation redshift. If this passively evolving scenario is correct then hierarchical growth at is not a required ingredient. However, this brightening may not just be due to passive evolution of the stellar population. Non-stellar contributions from the central AGN may also contribute a higher fraction of light at these redshifts. All of the studies to measure the non-stellar contribution to the band flux conducted to date (e.g. Leyshon & Eales 1998; Simpson, Rawlings & Lacy 1999), have concentrated on the most radio luminous 3CR sources at , and may have little bearing on the properties of the high-redshift sources considered here. If it turns out that the high-redshift 6C sources have non-stellar contamination to those of the 3C sources (which have the same radio luminosity) then hierarchical build up may be necessary. Note that band observations of the high-redshift 6C sources will be at shorter wavelengths than those of the 3C sources.
However, separate arguments lead us to conclude that the dominant factor is passive evolution of a stellar population which formed at . First, recent sub-mm observations with SCUBA have shown that the dust masses in radio galaxies are larger at than in galaxies with similar radio luminosities at lower redshift (Archibald et al. 2001). This implies that the majority of star-formation activity in these galaxies is occurring at high redshift. Second, the discovery of six extremely red objects at in the 7C Redshift Survey (Willott, Rawlings & Blundell 2001) with inferred ages of a few Gyrs, implies that these objects formed the bulk of their stellar population at . Third, detailed modelling of the optical spectrum of the weak radio source LBDS 53W091 at has shown that this object is most plausibly an old elliptical, with an inferred age of Gyr (Dunlop et al. 1996). The further discovery of LBDS 53W069 at , with an inferred age of Gyr (Dunlop 1999) suggests that there exists a population of evolved, radio weak ellipticals which formed at . Therefore, the new data on the 6C* sample presented in here is consistent with the results from various other observational studies of radio galaxies in which these radio-luminous systems formed most of their stars at epochs corresponding to very high redshifts (), and have undergone simple passive stellar evolution since. Willott et al. (2001) have pointed out that such galaxies probably undergo at least two active phases: one, at epochs corresponding to , when the black hole and stellar spheroid formed, and another, at e.g. , when powerful jet activity is triggered, or perhaps re-triggered, by an event such as an interaction or a merger. The small scatter in the relation (Jarvis et al. 2001b) and sub-mm results (Archibald et al. 2001) suggest that the second active phase has little influence on the stellar mass of the final elliptical galaxy
We have shown that the powerful radio galaxies in our samples are consistent with having passively evolving stellar populations. If we now compare the masses of these powerful radio galaxies to the derived value of for nearby elliptical galaxies [ for (Kochanek et al. 2000)], we find, if passive evolution is accounted for, that the powerful radio galaxies considered in this here are consistent with being throughout the redshift range .
References
- (1) Archibald E.N., et al., 2001, MNRAS, 323, 417
- (2) Blundell K.M., et al., 1998, MNRAS, 295, 265
- (3) Bruzual G., Charlot S., 1993, ApJ, 405, 438
- (4) Dunlop J.S., 1999, in ‘The most distant radio galaxies’ KNAW Colloquium, Amsterdam, October 1997, eds Röttgering et al., Kluwer
- (5) Dunlop J.S., Peacock J.A., 1993, MNRAS, 263, 936
- (6) Dunlop J.S., Peacock J.A., Spinrad H., Dey A., Jimenez R., Stern D., Windhorst R.A., 1996, Nature, 381, 581
- (7) Eales S.A., Rawlings S., Law-Green D., Cotter G., Lacy M., 1997, MNRAS, 291, 593
- (8) Jarvis M.J., et al., 2001a, MNRAS, 326, 1563
- (9) Jarvis M.J., et al., 2001b, MNRAS, 326, 1585
- (10) Kochanek C.S., et al., 2000, ApJ, 543, 131
- (11) Lacy M., Bunker A.J., Ridgway S.E., 2000, AJ, 120, 68
- (12) Laing R.A., Riley J.M., Longair M.S., 1983, MNRAS, 204, 151
- (13) Leyshon G., Eales S.A., 1998, MNRAS, 295, 10
- (14) McCarthy P.J., 1993, ARAA, 31, 639
- (15) Rawlings S., Eales S.A., Lacy M., 2001, MNRAS, 322, 523
- (16) Rawlings S., et al., 1996, Nature, 383, 502
- (17) Rawlings S. & Saunders R., 1991, Nature, 349, 138
- (18) Simpson C., Rawlings S., Lacy M., 1999, MNRAS, 306, 828
- (19) van Breugel W.J.M., et al., 1998, ApJ, 502, 614
- (20) Willott C.J., 2000, to appear in Proc. ”AGN in their Cosmic Environment”, Eds. B. Rocca-Volmerange & H. Sol, EDPS Conf. Series (astro-ph/0007467)
- (21) Willott C.J., Rawlings S., Blundell K.M., 2001, MNRAS, 324, 1
- (22) Willott C.J., Rawlings S., Blundell K.M., Lacy M., 1999, MNRAS, 309, 1017