The Optical Polarization of Near-Infrared Selected QSOS
Abstract
Optical broad-band polarimetry is presented for near-infrared color-selected active galactic nuclei (AGN) classified as quasi-stellar objects (QSOs) based on their -band luminosity. More than 10% of a sample of 70 QSOs discovered in the Two Micron All Sky Survey (2MASS) with and show high broad-band linear polarization (%), and values range to a maximum of %. High polarization tends to be associated with the most luminous objects at , and with QSOs having the highest near-IR–to–optical flux ratios. The 2MASS QSO sample includes objects possessing a wide range of optical spectral types. High polarization is seen in two of 22 broad emission-line (Type 1) objects, but of the QSOs of intermediate spectral type (Type 1.5–1.9) are highly polarized. None of the nine QSOs classified as Type 2 exhibit %. It is likely that the unavoidable inclusion of unpolarized starlight from the host galaxy within the observation aperture results in reduced polarization for the narrow emission-line objects.
The high polarization of 2MASS-discovered QSOs supports the conclusion inferred from their near-IR and optical colors, that the nuclei of many of these objects are obscured to some degree by dust. Correlations between optical polarization and near-IR luminosity and color imply that the dominant polarizing mechanism in the sample is scattering of AGN light into our line of sight by material located in relatively unobscured regions near the nucleus. The broad-band polarization properties of the 2MASS QSO sample are compared to those of other, predominantly radio-quiet, QSOs and are found to be consistent with the idea that the orientation of AGN to the line of sight plays a major role in determining their observed properties.
1 Introduction
Despite several decades of intense scrutiny, our understanding of active galactic nuclei (AGN) remains incomplete. Fundamental issues such as the number density of AGN, their contributions to the far-infrared and X-ray backgrounds, the role of orientation to our line of sight, the processes that form and power the nuclei, and their evolution still need to be resolved. Recent large-scale X-ray, optical, and near-infrared surveys have begun to reveal new populations of AGN with number densities comparable to, or exceeding, the number density of AGN derived from previous optical and radio surveys (e.g., Sanders & Mirabel, 1996). In particular, the Two Micron All Sky Survey (2MASS; Skrutskie et al., 1997) is finding large numbers of AGN that have been missed by traditional UV/optical search techniques. New survey wavebands can uncover past observational biases and reveal a wider range of AGN properties.
Polarization is an important property that can be used to explore the physics and structure of AGN, and polarimetry yields valuable information about the various classes of active nuclei. For instance, early surveys of the most luminous known AGN – quasi-stellar objects (QSOs) and quasi-stellar radio sources (quasars) – showed that they could be divided into two classes by their optical polarization properties (Moore & Stockman, 1984). The vast majority of objects, both radio and optically selected, show low optical polarization (%; Stockman, Moore, & Angel 1984). About 1% of the sample exhibited higher and variable polarization (Moore & Stockman, 1981), in part earning them the designation of optically violent variable quasars (OVVs). Almost all of these objects are associated with compact radio sources, and their variability behavior, both in flux and in polarization, clearly signifies that optically thin synchrotron radiation dominates the UV/optical continua.
Identification of the polarization mechanism(s) in low-polarization QSOs has not been as straightforward largely because of the low levels of polarization encountered. Except for a handful of broad absorption-line QSOs (BALQSOs; Moore & Stockman 1984; Schmidt & Hines 1999) and QSOs discovered by the Infrared Astronomical Satellite (IRAS) (Hines, 1994), only the OVVs exhibit polarization above the traditional high-polarization threshold of %. A good illustration of the difficulty in identifying the polarizing mechanism in most QSOs is provided by the blue-excess Palomar-Green (PG) sample (Schmidt & Green, 1983). Berriman et al. (1990) have shown that this predominantly radio-quiet sample has a mean intrinsic optical polarization of only 0.5% and the maximum observed polarization is 2.5%. Unambiguous statistical tests designed to determine the source of the polarized flux have been extremely hard to obtain, even though high quality broad-band polarimetry exists for the entire PG QSO sample.
This is not the case for the the lower luminosity analogs to radio-quiet QSOs, the Seyfert 1 galaxies. These objects show overall polarization properties similar to the PG QSOs, but their polarization distribution extends to higher values. The high-polarization Seyfert 1 “tail” better facilitates comparison of the polarization distribution with dust extinction and dust emission indicators, and led Berriman (1989) to conclude that the primary polarizing mechanism in Seyfert 1s is the scattering of nuclear light by dust located within the narrow emission-line region (NLR). Variations of this mechanism have been successful in explaining the polarization of several Seyfert 2 galaxies and showing that these objects would look like Seyfert 1s if viewed from sightlines that intercept the scattering material and the NLR (e.g., Antonucci & Miller, 1985; Miller & Goodrich, 1990; Tran, 1995b; Wilkes et al., 1995).
IRAS found a small number of infrared-luminous AGN which suggest the existence of a population of red, optically-obscured radio-quiet QSOs (Beichman et al., 1998; Low et al., 1988, 1989). Spectropolarimetry of several of these “hyperluminous” infrared galaxies (HIGs) has confirmed that their tremendous IR luminosities are powered in large part by QSOs hidden from our direct view, and that polarization arises from scattering of nuclear light by material with a relatively unobstructed view of the AGN (Wills et al., 1992; Hines & Wills, 1995; Hines et al., 1995, 1999, 2001; Goodrich et al., 1996; Young et al., 1996; Tran, Cohen, & Villar-Martin, 2000). A similar situation has been found for several radio galaxies (di Serego Alighieri, Cimatti, & Fosbury, 1994; Jannuzi et al., 1995; Cohen et al., 1999). For these objects, light scattered by dust located up to several kiloparsecs from the nucleus reveals the rest-frame ultraviolet spectrum of a QSO hidden from our direct view.
Cutri et al. (2001) have initiated a near-infrared, high galactic latitude survey for AGN using 2MASS. The survey is designed to find new red, radio-quiet objects and has, in fact, revealed a large population of previously unidentified AGN. The new sample generally consists of low-redshift () objects with redder near-IR colors (a criterion of the object selection) and much higher near-IR–to–optical flux ratios than optically selected AGN. Many of these AGN can be classified as QSOs in their own right since their -band luminosities are comparable to those of optically selected QSOs.
Higher levels of optical polarization relative to UV-excess QSOs are expected from the 2MASS sample if, as with the IR-selected HIGs, many of these objects are obscured along our line of sight. Nuclear light scattered by material (dust and/or electrons) distributed around the AGN will make a larger contribution to the total observed flux than if, as inferred for optically selected QSOs, we have a direct, unobstructed view to the bright unpolarized nucleus. Given an asymmetric distribution and/or illumination of the scattering material, high polarization can result.
The 2MASS AGN survey presents a large, well-defined sample of QSOs that invites comparisons with AGN selected by other means. In this paper we present observations of 2MASS QSOs aimed at determining their broad-band optical polarization properties. We test the conclusion reached by Cutri et al. (2001), based on the near-IR colors of the sample, that some of the objects in the general low- QSO population found by 2MASS are obscured along our line of sight. In addition, the polarization distribution of the new near-IR–selected QSOs is compared to three largely radio-quiet QSO samples (PG, BALQSO, and IRAS HIGs) for which polarization data are available.
2 Observations
The objects selected for observation were 89 spectroscopically-confirmed AGN from Cutri et al. (2001). Of these, 70 objects meet the criteria that we adopt for 2MASS “red” QSOs. That is, and . Absolute magnitudes are determined assuming km s-1 Mpc-1, , and which are used throughout this paper, and are K-corrected using the near-IR spectral indices derived from the JHK 2MASS magnitudes. The luminosity criterion adopted for inclusion into the sample was chosen to encompass the range of shown by the PG QSOs. Only three 2MASS QSOs in this sample have , reflecting the fact that the PG QSO sample includes many more objects with than the 2MASS sample. In addition, all 2MASS AGN identified by Cutri et al. (2001) have 30∘. The sample of 2MASS QSOs and their optical polarization measurements are listed in Table 1.
Table 2 lists 18 additional AGN and one unidentified object observed in the polarization survey. Most of these objects do not meet the criterion, though their absolute magnitudes place them in the range adopted for QSOs. 2MASSI J004125.3+134335 and 2MASSI J145744.9+202809 (2M004125 and 2M145744; hereafter objects will be designated as 2Mhhmmss in the text) do not meet the criterion. Mostly because of the relatively bright limiting apparent magnitudes and color selection of the 2MASS AGN survey, all of the objects observed in the polarimetry program have confirmed redshifts except 2M092145 and 2M234905. We have excluded the objects listed in Table 2 from the analysis of the 2MASS QSO sample so that we can solely concentrate on the polarization properties of a well-defined low-redshift sample and allow for a more straightforward comparison of these properties with other QSOs in this redshift range.
2.1 Photo-Electric Polarimetry
A majority of the observations made during 1999 were obtained using the Two-Holer Polarimeter/Photometer (Sitko, Schmidt, & Stein, 1985) on the Steward Observatory (SO) 1.5 m telescope atop Mt. Lemmon, AZ, or the Bok 2.3 m reflector on Kitt Peak, AZ. This instrument uses a semi-achromatic half-waveplate spinning at 20.65 Hz to modulate incident polarization, and a Wollaston prism to direct orthogonally polarized beams to two photomultiplier tubes. All observations for this survey were made unfiltered so that these generally optically faint objects could be observed using the 1.5 m and 2.3 m telescopes. Given the typically red optical colors of the QSOs and the location of the H line, the effective wavelength of unfiltered observations usually falls within the Kron-Cousins bandpass (6000–7000). All observations were made with the smallest available circular aperture (0.51 mm). This subtends 43 diameter at the f/16 Cassegrain focus of the 1.5 m telescope. For the f/9 Bok telescope, a lens is inserted before the aperture to slow the beam to f/16 and the aperture translates to 29. The lens has poor transmission at Å and therefore unfiltered observations made at the Bok telescope will have slightly redder effective wavelengths. Sky subtraction is accomplished by moving the object out of the aperture several times during an observation.
Data taking and reductions are thoroughly described in Moore, Schmidt, & West (1987) and Smith et al. (1992). Uncertainties in the percent linear polarization () and polarization position angle (, where is the polarization position angle measured in the usual astronomical sense — 0∘ is North and 90∘ is East) quoted in Tables 1 and 2 are based on photon counting statistics. The linear polarization measurements listed are not corrected for statistical bias. The polarization position angle is essentially undetermined when (see Wardle & Kronberg, 1974), and in these cases no value for is given. Polarization position angles are calibrated using the grid of polarization standard stars measured by Schmidt, Elston, & Lupie (1992). Unpolarized standard stars measured by Schmidt, Elston, & Lupie (1992) were occasionally observed to check for instrumental polarization, which was found to be %. Observations made with Two-Holer are identified in the “Comments” column of Tables 1 and 2.
2.2 CCD Imaging Polarimetry
Observations of 2MASS AGN during 2000, along with a few 1999 observations, were obtained using the CCD Imaging/Spectropolarimeter (Schmidt, Stockman, & Smith, 1992) in its imaging mode at the Bok telescope. The field of view for imaging polarimetry at the Bok telescope is with an image scale of 1.9 pixel/arcsecond. Like Two-Holer, a semi-achromatic /2-waveplate is placed in front of a Wollaston prism to analyze incident linear polarization. Using a plane mirror in the grating location, the two orthogonally polarized beams are imaged onto a thinned, anti-reflection-coated 1200800 Loral CCD. Four separate reads of the CCD chip are made with the waveplate rotated through 16 positions to determine the linear Stokes parameters, and , using exposure times for each waveplate position of 30–200 s. All observations were filtered using a KPNO “nearly Mould” filter (6000–7000).
Aperture photometry is performed on the co-added total flux images as well as the and flux images to extract the normalized linear Stokes parameters for all usable targets in the field of view. Tables 1 and 2 list the results using a circular digital aperture with a diameter of 6 pixels (32). For consistency with surveys of other QSO samples, no attempt has been made to correct the polarization for starlight from the QSO host galaxies that are apparent in many of the images (see §3 and §4). There is no evidence for extended polarized emission, but this does not strongly constrain the size of possible scattering regions since the seeing/image quality of the imaging polarimetry over the long exposure sequences was typically 15–25 FWHM. Values for , , and their uncertainties are presented in the same manner as the Two-Holer data.
For 16 objects, observations were made on two or three nights to improve on an initially low signal-to-noise ratio (S/N) measurement. Weighted means of the multiple observations are given in Table 2, though in most cases, the average values are dominated by the higher S/N measurements resulting from the imaging polarimetry. The multiple observations do not reveal any polarization variations larger than twice the observational uncertainty, and we use the weighted means in the subsequent analysis.
2.3 Galactic Interstellar Polarization
For a high galactic latitude sample of objects, such as the 2MASS-selected AGN, polarization due to transmission through aligned dust grains within the Milky Way is minimal. Impey & Tapia (1990) and Berriman et al. (1990) both show that observing a level of interstellar polarization () higher than 0.6% is rare among objects with 30∘. We observed at least one star or galaxy in the fields of 44 of the target AGN. For those cases where , we find evidence for % in only 10 fields. These are summarized in Table 3. Most of these 10 measurements come from the region 120∘∘ and close to the galactic latitude limit for the survey (30∘∘). No measurement of Galactic interstellar polarization with yields %.
Comparison of the interstellar polarization measurements with the polarimetry of the AGN suggests that the polarization of only 2M032458 and 2M095504 could be solely due to dust within our own Galaxy. At the same time, the intrinsic polarization of only 2M005010 appears to be significantly suppressed by a local interstellar component that is orthogonal to the measured polarization of the object. Correcting for the interstellar polarization measured in this field, the -band polarization of 2M005010 is % (not corrected for statistical bias) at ∘∘. Because the average uncertainty in for the entire sample, 0.5%, is similar to the highest levels of that are encountered, the observed polarization of the 2MASS objects have not been adjusted for the presence of Galactic interstellar polarization.
3 The Polarization of 2MASS QSOs
3.1 The Distribution of Polarization
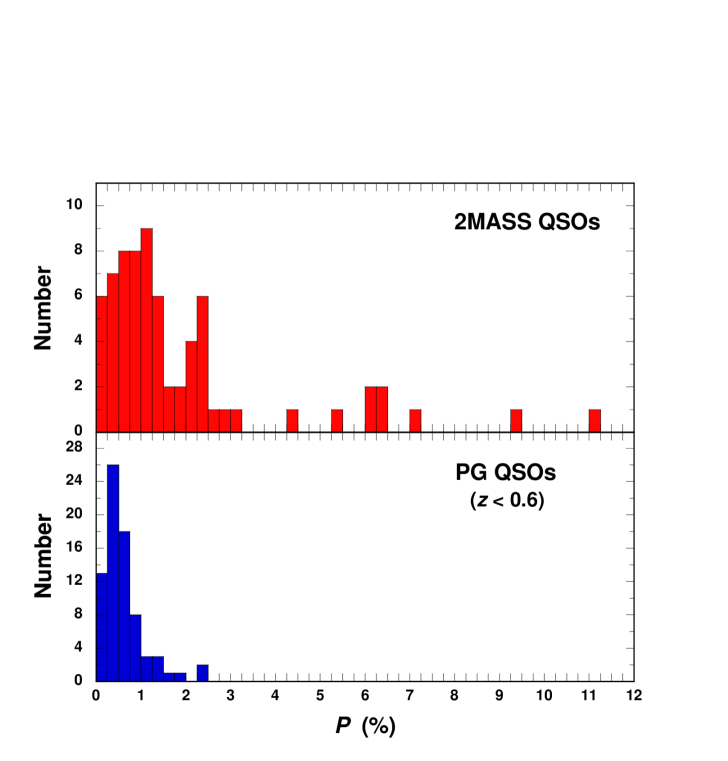
The distribution of linear polarization for the 70 QSOs is shown in Figure 1. The unfiltered and -band measurements have been combined to construct the histogram, and lacking multi-color polarization information, no adjustments to the observed polarizations have been made for differences between the effective bandpasses of the Two-Holer and imaging polarimetry.
The optical broad-band polarimetry shows that the 2MASS QSOs are a generally highly polarized sample of AGN. More than 10% of the sample (nine of 70 objects) have polarization above 3% and a maximum polarization of 11% is observed. The results can be contrasted to the unfiltered optical polarization of the PG QSO sample (Berriman et al., 1990) that is shown in the lower panel of Figure 1. For the PG sample, we only include the objects with to match the redshift range for the two QSO samples. The average redshift of the 2MASS sample is (median = 0.24), whereas (median = 0.16) for the 75 PG QSOs with . Inclusion of the 21 higher-redshift PG QSOs does not change the obvious difference between the general polarization levels of the two samples, since the highest polarization observed in the entire PG catalog is % for PG 1114+445 () and PG 1425+267 (). For the purposes of comparisons between the PG and 2MASS QSOs, the PG sample will be limited to the 75 QSOs with and .
The distributions of optical polarization show a dramatic difference between optically selected QSOs represented by the PG sample, and near-IR selected AGN having similar -band luminosities (). The high polarization of the 2MASS QSOs relative to UV/optically selected QSOs supports the conclusion that the red near-IR colors and high near-IR–to–optical flux ratios arise from some degree of obscuration by dust in our line of sight. Extinction and reddening by dust bias these objects against discovery in traditional optical (UV-excess) AGN surveys. High polarization is expected from a reddened, partially obscured QSO population either because of the transmission of AGN light through aligned dust grains (the interstellar polarization mechanism) within the AGN host galaxy, or the scattering of nuclear light by material distributed fairly close to the AGN. Optical spectropolarimetric results for several highly polarized 2MASS QSOs support the view that scattering of nuclear light in regions near the nucleus is indeed the dominant polarizing mechanism (Smith et al., 2000a, b), and not dichroic absorption by aligned dust grains. Polarized light from analogous scattering regions in UV/optically selected QSOs appears to be completely swamped by the unpolarized, direct light from the nucleus, leading to the low polarization observed for most QSOs measured in past surveys (e.g., Stockman, Moore, & Angel, 1984; Berriman et al., 1990). We further explore this conclusion in the following sections.
3.2 Polarization and Color
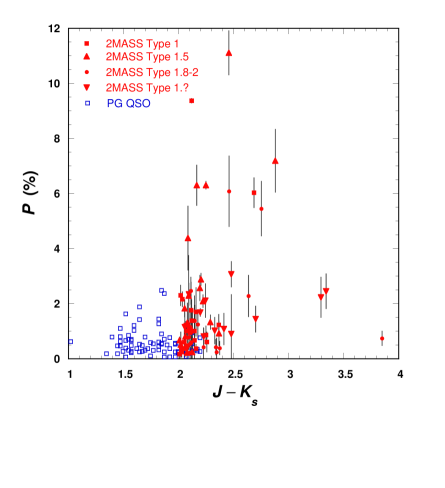
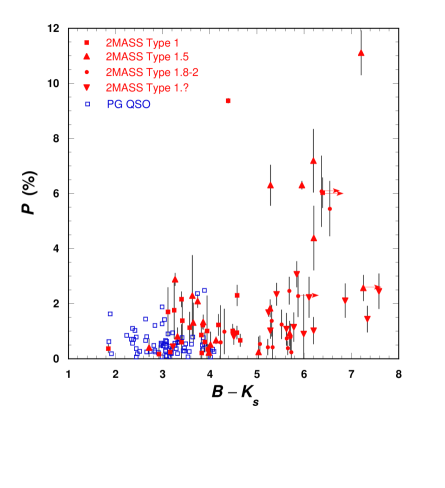
If dust obscuration in our line of sight plays a role in producing the high optical polarization of 2MASS QSOs relative to presumably unobscured QSOs found optically, then a correlation might be expected between polarization and color in the sense that redder, more obscured objects would tend to be highly polarized. Figures 2 and 3 show the observed polarization as a function of and color indices, respectively. The PG QSOs with are also plotted in both figures using data from Neugebauer et al. (1987) and Berriman et al. (1990). It is readily apparent, especially with respect to , that the likelihood of detecting % is higher for redder objects. A non-parametric correlation test (Kendall’s tau) applied to 2MASS sample confirms the trends suggested in Figures 2 and 3, and these results are summarized in Table 4. The probability of finding a correlation this strong between polarization and or if these parameters are uncorrelated is %.
High polarization is observed over the range of spanned by the 2MASS sample, though most 2MASS QSOs with have %. The three objects with are also not highly polarized. It is interesting to note that the near-IR color criterion for selection into the 2MASS sample seems to be near something of a threshold for observing high polarization. Three of the nine highly polarized 2MASS QSOs are at the red end of the range spanned by the PG sample (), although none of the 12 PG QSOs that meet the 2MASS color selection criterion have %.
The color index is much more sensitive to the presence of dust in our line of sight to the AGN than , and as expected, the 2MASS QSOs span a range of at least 5.7 magnitudes in . Four objects are undetected in the blue Palomar Digital Sky Survey (DSS). This is in stark contrast to the low- PG QSOs that span only about 2 magnitudes in . All QSOs with % have with the exception of 2M151653 (; %). If the 2MASS QSOs are similar to PG QSOs except that they are obscured by dust, high polarization objects appear in the sample when there is 1.5 mag of visual extinction of the direct nuclear light above that experienced by an average PG QSO.
3.3 Polarization and Near-IR Luminosity
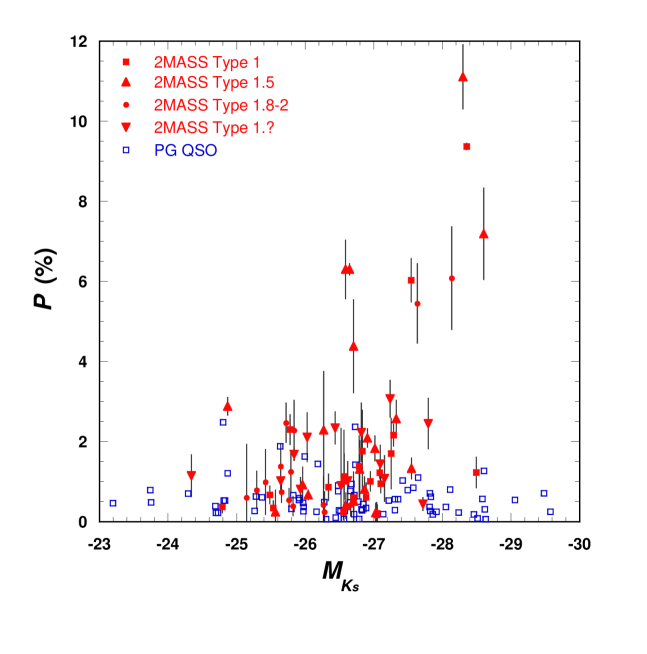
A strong trend is observed among the 2MASS QSOs between optical polarization and the near-IR luminosity inferred from the apparent magnitudes (Figure 4 and Table 4). Six of the 10 most luminous objects at 2.2m are highly polarized, and all objects with % have . There are two probable effects that might preferentially select intrinsically luminous QSOs in this sample to be highly polarized. First, under the assumption that 2.2m brightness is a more accurate measure of intrinsic luminosity than optical brightness, the most luminous objects are better able to illuminate scattering regions distributed around the nuclear source. Brighter and/or more extensive scattering regions around the nucleus will generally result in more polarized, scattered light that contributes a larger fraction to the total observed flux. The second effect is the suppression of polarization by unpolarized sources of optical light such as starlight from the host galaxy. The relative contribution of the host galaxy to the total flux is typically higher for lower luminosity AGN, and therefore, the observed polarization is lower.
The 2MASS AGN sample has no morphological selection criteria and inspection of the DSS and frames obtained from the imaging polarimetry easily reveal host galaxies for many of the 2MASS QSOs. In several cases, the extended galactic emission outshines the QSO in the optical. For instance, only 50% of the -band flux measured in a 20″-diameter aperture for 2M022150 is included in a 6″ aperture. By comparison, sophisticated optical observational techniques or near-IR imaging have typically been required to detect the host galaxies of UV/optically selected QSOs (see e.g., McLeod & Rieke, 1994; Bahcall et al., 1997). Clearly, the effect on the measured optical polarization by host galaxy starlight will tend to be greater for the 2MASS sample than it is for other QSO samples. This issue is discussed further in §3.4 and §4.
3.4 Polarization and Optical Spectral Type
One of the hallmarks of the 2MASS color-selected sample is the wide variety of AGN types revealed by optical spectroscopy (Cutri et al., 2001). The full range of AGN emission-line spectral types are represented in the 70 2MASS QSOs, from Type 1 to Type 2/LINER. A majority of the objects show some evidence for broad emission lines (Type 1–1.9) with only 9 objects not showing a broad component in their Balmer line profiles.
We have divided the QSO sample into categories using the spectral classifications determined by Cutri et al. (2001): Type 1 (22 objects; which includes Type 1.2 objects), Type 1.5 (19 objects), and Type 1.8–2/LINER/Starburst (15 objects). Objects that show broad H emission lines, but whose available spectra either do not include H (“Type 1.b”; 3 objects), or have no detected H emission line (“Type 1.x”; 10 objects) have been combined into a fourth category (Type 1.?). Spectral classification has been ambiguous for 2M232745 and we have included it with the Type 1.x and 1.b objects. The properties of these categories and the PG QSOs are summarized in Table 5.
Inspection of Figures 2, 3, or 4 reveals that all categories, with the exception of Type 1.?, are represented among the nine highly polarized examples. Over one quarter of the 19 QSOs classified as Type 1.5 are highly polarized. In the case of 2M165939, the polarized flux spectrum shows a blue continuum, broad Balmer emission lines, and that the NLR features are unpolarized (Smith et al., 2000a). Although there is a broad emission-line component in the total flux spectrum, these polarization properties imply that the AGN is partially hidden from our direct view. Moreover, the scattering material must lie further away from the continuum source than the broad emission-line region (BLR), but be close to, or within the NLR.
The relative lack of high polarization among Type 1 objects (two of 22 objects) is reminiscent of the PG sample that is composed of Type 1–1.5 objects (adopting the classifications compiled by Veron-Cetty & Veron 2001), where none have %. Although 2MASS detects redder Type 1 objects, many that are presumably reddened by dust, direct unpolarized light from the nucleus is apparently still strong enough to swamp any scattered, polarized light sources. Alternatively, as with any of the low-polarization objects, the scattered light component could also be reddened, keeping its contribution to total observed flux too small to yield %. One of the two highly polarized Type 1 QSOs, 2M151653, has been shown by Smith et al. (2000a) to be polarized in the same manner as 2M165939. That is, material close to or within the NLR scatters light into our line of sight from an active nucleus partially obscured from our direct view.
All of the highly polarized QSOs discovered in this survey exhibit evidence for a broad-line region in their total flux spectra, albeit weakly in the cases of 2M010835 (Type 1.9; ) and 2M171559 (Type 1.8; ). Therefore, the high polarization of the 2MASS sample is not the result of the inclusion of Type 2 objects with hidden continuum sources and BLRs like those that exist in several highly polarized Seyfert 2 nuclei (see e.g., Tran, 1995b).
On the other hand, the two highly polarized narrow emission line-dominated objects are the most luminous objects of their type in the sample. No other Type 1.8–2 objects have and all but 2M145410, 2M163736, and 2M230304 have . Within the context of the unified AGN scheme, Type 2 objects are thought to be more heavily obscured by dust than Type 1s. This naturally explains why the luminosity of the Type 2 objects is generally lower than that of Type 1–1.5 and why is typically larger for Type 2s (Table 5). The prevalence of intermediate-type QSOs among the highly polarized 2MASS QSOs suggests that unpolarized light sources dilute the optical polarization of objects of more extreme spectral type. Type 2 objects may exhibit low polarization because of the relatively large flux contribution from stars in the host galaxy, assuming that there is no large systematic difference in host galaxy luminosity between types, or from other unpolarized sources such as the featureless continuum (FC2) that is argued to be present in the spectra of some Seyfert 2 nuclei (e.g., Tran, 1995c).
The effect of the host galaxy on the polarized AGN flux can be roughly estimated for the different spectral types of 2MASS QSOs summarized in Table 5. Given the median luminosity and colors of the Type 1–1.5 objects, the observed -band polarization is 0.8, where is the intrinsic -band polarization of the AGN, assuming that the host galaxy is similar to the average host found for UV-excess QSOs ( for radio-quiet QSOs; Bahcall et al., 1997). In comparison, a similar host for a typical Type 1.8–2 2MASS QSO will dilute by about a factor of 2.
If the 2MASS Type 2 QSOs are high-luminosity analogs to Seyfert 2 nuclei, it is not surprising that high broad-band optical () polarization is not observed in these objects. Even the archetype of Seyfert 2 nuclei that harbor Type 1 polarized spectra, NGC 1068, does not show % in the red (Angel et al., 1976; Miller & Antonucci, 1983). Much of the strong increase in polarization in the blue in Seyfert 2s is attributed to the decreased dilution by starlight (see e.g., Antonucci & Miller, 1985; Tran, 1995a). The 2MASS QSO polarization measurements have an effective wavelength 6000 Å, and the redshifts of the objects in the sample are not high enough that the polarimetry includes much flux blueward of the Ca H and K break where the starlight contribution is diminished. In addition, any reasonable aperture will include a majority of the flux from the host galaxy for a typical 2MASS QSO, whereas much of the host galaxy starlight is avoided using similar apertures for Seyfert 2 galaxies simply because of their much lower redshifts.
Finally, there are no highly polarized examples among the objects placed in the Type 1.? category. This category is dominated (10 of 14 objects) by QSOs that show no evidence for H emission in their confirmation spectra, though broad H is observed (Cutri et al., 2001). The objects have a median similar to Types 1 and 1.5 QSOs in the 2MASS sample, but their color indices are more typically like the much redder Type 1.8–2 objects. The red colors and large Balmer decrements suggest that we are not seeing much AGN light at optical wavelengths and, as with the Type 1.8–2 objects, the host galaxy dilutes the polarized flux. The low optical polarization of the highly reddened Type 1.x QSOs could also be the result of dust obscuring the scattering regions.
4 Discussion
4.1 Radio and Infrared Properties
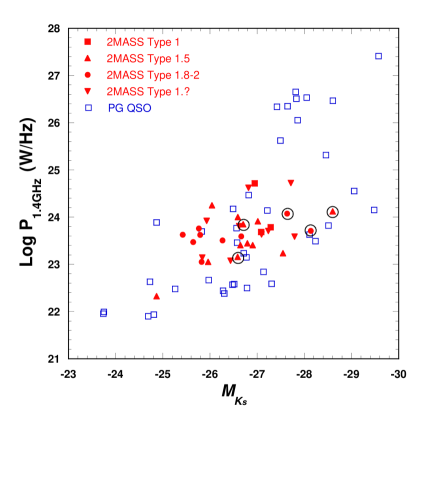
The optical broad-band polarization results are consistent with the interpretation that the 2MASS sample includes a fraction of low-, radio-quiet QSOs that are obscured along our line of sight (Cutri et al., 2001). In §3 the 2MASS QSOs were compared with the predominantly radio-quiet PG QSOs in the same redshift range. This comparison is motivated not only by the similar numbers of objects and the high S/N polarimetry that is available, but also because the two samples have similar luminosity distributions at . However, it can be seen in Figure 4 that the 2MASS sample lacks objects as bright at as the most luminous PG QSOs. Cutri et al. (2001) suggest that this is caused by selection biases in the 2MASS AGN sample such as the exclusion of known AGN, and that the extinction necessary to achieve essentially rules out finding new objects as bright as the most luminous unobscured QSOs. This should not be the case in the mid- to far-IR where emission from dust near the nucleus will dominate the observed flux. An important test of the equivalence of the 2MASS and optically-selected QSOs is a comparison of their spectral energy distributions (SEDs) from mid-IR to radio wavelengths where orientation effects are mitigated.
Nearly half (33 of 70) of the 2MASS QSOs are detected at 1.4 GHz by either the NRAO VLA Sky Survey (NVSS; Condon et al., 1998) or the VLA Faint Images of the Radio Sky at Twenty-Centimeters (FIRST) survey (Becker, White, & Helfand, 1995), and about half (5 out of 9) of the highly polarized QSOs are detected. The detection rate is about the same for the PG QSOs with (38 of 75 objects), even though the 2MASS sample by design omits known AGN in radio catalogs. No object has a 1.4 GHz radio power (P) above W Hz-1, while the PG sample boasts 10 objects with (Figure 5). In addition to having a number of powerful radio sources, the radio-detected PG sample includes 14 objects with low radio luminosity (). Eleven of these objects have . The low-luminosity objects are missing from the 2MASS sample primarily because of its higher average redshift. Thus, although selection biases strongly affect the 2MASS sample, the 2MASS QSOs are roughly consistent in radio luminosity with the radio-quiet PG QSOs. There is no evidence for any relationship between radio luminosity and high optical polarization among the 2MASS objects.
Despite the similarity in the overall 1.4 GHz detection statistics for the 2MASS and PG QSO samples, the Type 1 2MASS objects are under-represented in the radio surveys. Only three of 22 Type 1 QSOs are detected by FIRST or NVSS, whereas 60% of objects in the other 2MASS spectral categories are detected at 1.4 GHz (Table 5). The reason behind the lack of radio sources associated with Type 1 objects in the near-IR selected sample compared to the optically selected PG QSOs is not readily apparent, but this discrepancy hints at possible intrinsic differences in the central engine and/or AGN environment between the two samples.
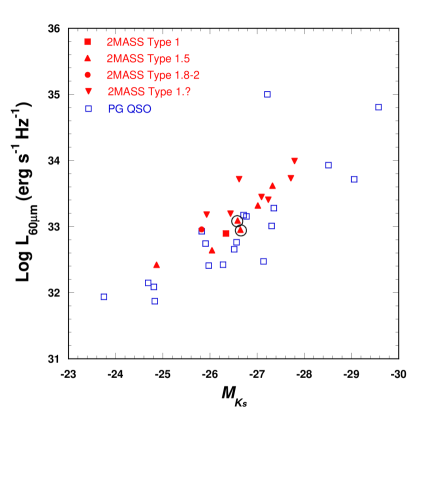
Comparison between the 2MASS and PG QSO samples in the mid infrared is difficult because of the small number of objects detected by IRAS. Only 15 of the 70 2MASS QSOs are detected at 60m in the IRAS Faint Source Catalog (FSC). Nineteen PG QSOs with were detected and the slightly higher success rate is due to the PG sample containing more objects with that are more likely to be bright enough to be seen by IRAS. Figure 6 shows that the IRAS-detected 2MASS QSOs are generally more luminous at 60m for a given near-IR luminosity than the PG QSOs, but this is at least partially a selection bias caused by the higher redshift of the 2MASS sample. Two highly polarized 2MASS QSOs were detected by IRAS and neither of these objects show an excess of 60m emission above that expected from a PG QSO.
As with the radio surveys, the Type 1 2MASS QSOs are rare in the sample detected at 60m, with only 2M171442 being represented. The remainder of the 60m detections summarized in Table 5 are distributed among Types 1.5 (6 of 19 objects), 1.x (6 of 10 objects), 1.8 (2M022150), and 1.b (2M130700). The large representation of Type 1.x QSOs in Figure 6 is striking. These objects tend to be the most luminous QSOs at 60m for a given . It may be that these systems contain more dust than other types of QSOs, a difference that could account for the observed infrared emission, redder optical and near-IR colors, and large Balmer decrements. One possibility is that the excess dust has been added via a merger with another galaxy. This would also help to explain the low polarizations observed for the Type 1.x objects since a large amount of dust in the system could obscure the scattering regions. The presence of two stellar systems would also help to dilute any polarized flux from the AGN. Future high-resolution optical and near-IR imaging of the 2MASS sample can explore the possible role that galaxy mergers play in QSOs.
The high sensitivity of the Space Infrared Telescope Facility (SIRTF) is well suited to examine the mid-IR SEDs of AGN samples. Future SIRTF observations may resolve the issue of whether near-IR selected, red QSOs are similar to optically-selected QSOs in their mid- and far-IR properties as expected if orientation to our line of sight is indeed the major discriminant between AGN types at shorter wavelengths, or are systematically more luminous as suggested by the few IRAS detections.
4.2 Comparison with Other QSO Samples
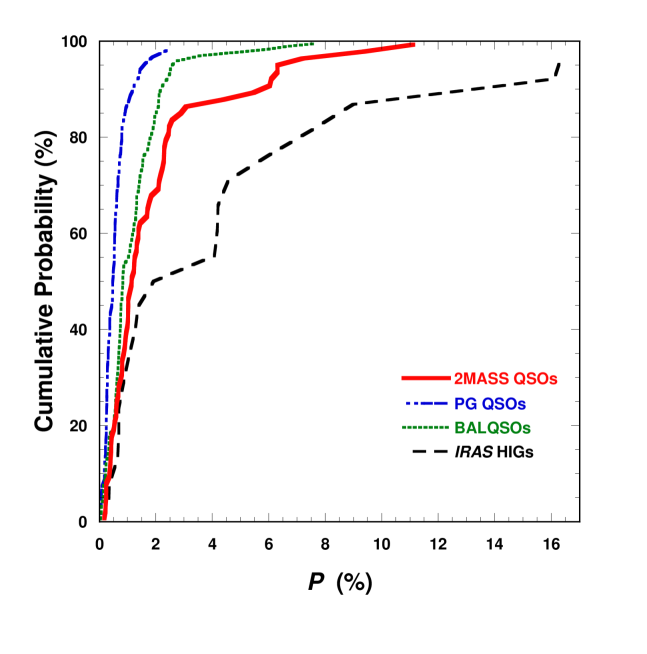
Broad-band optical polarization surveys exist for the BALQSOs and IRAS HIGs that help place the new 2MASS sample in context with current ideas concerning AGN. In Figure 7 we plot the cumulative distributions of optical polarization for these two samples along with those of the 2MASS and PG QSOs. Results of Kolomagorov-Shmirnov (KS) tests on the distributions are given in Table 6, where it can be seen that the observed differences between the PG QSOs and the other three samples are far larger than would be expected if the samples were drawn from the same parent population.
Schmidt & Hines (1999) have shown that the polarization distributions for the PG QSOs and BALQSOs can be made similar if for the PG sample is multiplied by 2.4. That is, the higher polarization observed in BALQSOs can be explained if the direct, unpolarized nuclear light from these objects is attenuated in our line of sight by 1 mag above that experienced by a typical PG QSO. This interpretation is in keeping with evidence that low-ionization BALQSOs are reddened by dust (Sprayberry & Foltz, 1992) and with detailed spectropolarimetry that implies a covering factor for the absorbing gas and material partially obscuring the nucleus (e.g., Glenn, Schmidt, & Foltz, 1994; Hines & Wills, 1995; Goodrich & Miller, 1995; Cohen et al., 1995; Goodrich, 1997). The implications of the broad-band polarimetry are not changed by the addition of the observations of Hutsemékers, Lamy, & Remy (1998) and Lamy & Hutsemékers (2000) that increases the BALQSO sample to 85 objects.
The cumulative distributions of the 2MASS QSOs and BALQSOs (Figure 7) follow each other closely for low polarization levels (%). Schmidt & Hines (1999) have shown that the larger statistical bias associated with the higher average observational uncertainty of the fainter BALQSOs does not explain the generally higher levels of polarization observed for BALQSOs relative to the PG sample for –2%. Because the mean observational uncertainties of the 2MASS QSO and BALQSO polarization measurements are similar, the divergence of the 2MASS and PG QSO distributions at low polarization levels also cannot be an artifact of statistical bias in the measurements. Therefore, the 2MASS QSO sample is not distinguished from the PG QSO sample simply by the addition of a small fraction (10–15%) of highly polarized objects. Like the BALQSOs, the 2MASS QSO sample as a whole exhibits higher polarization than the PG QSOs.
The congruence of the 2MASS QSO and BALQSO distributions at low polarization levels suggests a possible relationship between these two samples. In fact, despite a divergence at high polarization, a KS test yields a reasonable probability that the samples could be drawn from the same parent population (P). Of the four known high-redshift () AGN found by 2MASS, one shows broad Mg II absorption (Cutri et al., 2001). It is possible that the 2MASS QSO sample is made up in part of objects that are low-redshift analogs to the high- BALQSOs, but there are some effects that must be taken into account to properly compare the polarization properties of the two samples.
First, the BALQSOs tend to be at a much higher redshift () than the 2MASS QSOs (). As a result, optical polarimetry of most BALQSOs measures in the rest-frame ultraviolet. Any general wavelength dependence in the continuum polarization between the optical and near-UV will result in a systematic difference between the samples. Possibly more important is the effect of host galaxy starlight. Unlike the 2MASS objects, polarization measurements of BALQSOs are unlikely to be affected by the host galaxy because of the overwhelming brightness of the nucleus and the fact that the observations are made blueward of the Ca H and K break where the flux from galaxies is diminished.
Correcting the polarimetry of 2MASS QSOs for host galaxy starlight will result in a greater differentiation between the polarization distributions of the 2MASS and BALQSO samples. We have attempted to measure the effect on of the host galaxy in several 2MASS QSOs using the imaging polarimetry data. Various digital apertures were tried to explore the dependence of on aperture size. However, with an image scale of 05 pixel-1, even the smallest practical apertures admit a large fraction of the total stellar flux, and in no case is the expected trend of decreasing with increasing aperture size unambiguously observed.
A final difference to be noted between the polarization properties of 2MASS QSOs and BALQSOs is presented by spectropolarimetry. Schmidt & Hines (1999) summarize the general spectropolarimetric properties found for BALQSOs from various studies which imply that scattering produces the observed polarization (see also, Ogle et al., 1999). In most cases, the broad emission lines are not as highly polarized as the continuum, and in several instances there is no evidence for broad emission lines in the polarized flux spectrum at all. Spectropolarimetry of highly polarized 2MASS QSOs, on the other hand, shows that the broad Balmer lines tend to be polarized to about the same level as the continuum (Smith et al., 2000a, b). This is consistent with the view that the continuum source is more heavily obscured than the BLR in BALQSOs, but the two are attenuated by about the same amount in the 2MASS objects.
Future ultraviolet spectroscopy will provide a direct test of the possible relationships between the 2MASS QSOs and BALQSOs. Determining the fraction of near-IR selected QSOs that show broad absorption lines and comparing the UV properties of 2MASS QSOs with other samples will likely yield important information about the structure of luminous, obscured AGN and about the role that orientation plays in the selection and identification of these objects. In a similar vein, soft X-ray observations of 2MASS QSOs can measure the X-ray absorption in the line of sight and these values can be compared to the absorbing column densities exhibited by other AGN samples (see e.g., Mathur, Elvis, & Singh, 1995; Brandt, Laor, & Wills, 2000; Gallagher et al., 2001; Green et al., 2001). Results from the Chandra X-ray Observatory suggest that 2MASS QSOs exhibit column densities, cm-2 (Wilkes et al., 2001).
The HIGs are another important QSO sample (Cutri et al., 1994) that may be closely related to objects found from their near-IR colors. Like the 2MASS sample, the HIGs are composed of AGN of various optical spectral types and show larger infrared-to-optical flux ratios than are observed for UV/optically selected QSOs. Hines (1994) and Wills & Hines (1997) have found that the IRAS HIGs as a class are optically highly polarized (see Figure 7). Spectropolarimetry of the most luminous HIGs with Type 2-like spectra has revealed that these objects are powered by QSOs obscured in our line of sight (Hines et al., 1995; Goodrich et al., 1996).
The small IRAS sample occupies a larger region of redshift space (–2.3) than do the 2MASS QSOs (), and it is the high-redshift (most luminous) HIGs that tend to be the most highly polarized. This resembles the trend between and near-IR luminosity found for the 2MASS QSOs (§3.3). Another parallel between the two samples is that objects with the highest infrared-to-optical flux ratios (as measured by for the 2MASS sample and for the HIGs) tend to be the most highly polarized. These trends in the polarization properties suggest that the HIGs may represent the high-luminosity tail of the dust-obscured QSO population. The Type 2 IRAS HIGs are among the most luminous objects known and are highly polarized (see e.g., Hines et al., 1995, 1999), whereas the lower luminosity Type 2 2MASS QSOs do not show high optical broad-band polarization. We ascribe this difference to the dominance of the scattered light over host galaxy starlight in the HIGs, and to the fact that the polarimetry of the 2MASS QSOs does not measure the polarization in the rest-frame UV.
5 Summary and Conclusions
The broad-band optical polarization of QSOs selected by their near-IR colors are consistent with the view that many of these objects are obscured to some degree by dust. Over 10% of a sample of 70 “red” QSOs discovered by 2MASS (Cutri et al., 2001) shows high polarization (%), and values range up to 11%. These high levels of polarization are not present among objects in standard UV-excess catalogs of QSOs except for OVVs and a small number of BALQSOs. The polarization of 2MASS QSOs is correlated with near-IR luminosity and color, and with near-IR–to–optical flux ratio in the sense that more luminous and redder objects tend to show high polarization. These trends suggest that the polarization arises from the scattering of nuclear light by material located close to a partially obscured AGN. Spectropolarimetry of two highly polarized 2MASS QSOs confirms that scattering is the dominant polarizing mechanism in these objects with the scattering material located close to, or within, the NLR (Smith et al., 2000a). Determining the nature of the scattering material (either dust and/or electrons), however, likely awaits careful modeling of high-quality spectropolarimetry at UV, optical, and infrared wavelengths (see e.g., Hines et al., 2001).
The near-IR color selection of the 2MASS AGN survey is unbiased with regard to optical spectral type, and we find that high polarization is found among nearly all types, especially those classified as Type 1.5–1.9 by Cutri et al. (2001). Like optically selected QSOs, few of the broad emission line-dominated (Type 1) QSOs have %. This is presumably because the obscuration of direct AGN light is sufficiently low that the relative contribution of any scattered component is small. High polarization is not observed in Type 2 QSOs in this sample, although their colors and luminosities are consistent with these objects being among the most heavily obscured in the sample. Dilution of scattered, polarized light by starlight from the host galaxy is suggested as the reason for low observed optical polarization in this case. This assertion is consistent with the fact that most Seyfert 2 galaxies that are highly polarized in the UV show % for Å. Ultraviolet polarimetry and high quality imaging provide obvious tests of the effect of host galaxy starlight on the polarization of 2MASS QSOs.
The distribution of optical polarization for the 2MASS QSOs further substantiates the trend that higher polarization is seen in QSO samples that have higher apparent IR–to–optical luminosity ratios (). The 2MASS objects are not as extreme in as the IRAS HIGs, and neither is their general level of polarization. On the other hand, the 2MASS sample is much more highly polarized than the PG QSOs, which generally have the lowest . This is presumably because our view of the nuclear region is not hindered by dust in UV-excess AGN. Although the 2MASS and BALQSO distributions in are fairly similar, corrections for starlight and for differing observing bandpasses are likely to better differentiate these two samples and thereby increase the significance of the correlation between and . This correlation implies that orientation effects and/or the dust covering factor are largely responsible for differences in the optical and IR properties between various samples of high-luminosity AGN. Alternatively, the near-IR–selected QSOs may represent a different evolutionary stage than the optically selected, UV-excess QSOs. Further orientation-independent investigations of these samples, such as imaging of host galaxies and environments, extended radio emission, and IR observations using SIRTF will be necessary to distinguish between evolutionary and orientation effects.
Finally, the polarization properties of the 2MASS QSOs suggests that this new near-IR–selected sample may include a large proportion of low-redshift BALQSOs. Ultraviolet observations can directly test this possibility, and together with X-ray measurements, investigate the nature of the obscuring material.
References
- Angel et al. (1976) Angel, J. R. P., Stockman, H. S., Woolf, N. J., Beaver, E. A., & Martin, P. G. 1976, ApJ, 206, L5
- Antonucci & Miller (1985) Antonucci, R. R. J., & Miller, J. S. 1985, ApJ, 297, 621
- Bahcall et al. (1997) Bahcall, J. N., Kirkakos, S., Saxe, D. H., & Schneider, D. P. 1997, ApJ, 479, 642
- Becker, White, & Helfand (1995) Becker, R. H., White, R. L., & Helfand, D. J. 1995, ApJ, 450, 559
- Beichman et al. (1998) Beichman, C. A., Soifer, B. T., Helou, G., Chester, T. J., Neugebauer, G., Gillett, F. C., & Low, F. J. 1986, ApJ, 308, L1
- Berriman (1989) Berriman, G. 1989, ApJ, 345, 713
- Berriman et al. (1990) Berriman, G., Schmidt, G. D., West, S. C., & Stockman, H. S. 1990, ApJS, 74, 869
- Brandt, Laor, & Wills (2000) Brandt, W. N., Laor, A., Wills, B. J. 2000, ApJ, 528, 637
- Cohen et al. (1999) Cohen, M. H., Ogle, P. M., Tran, H. D., Goodrich, R. W., & Miller, J. S. 1999, AJ, 118, 1963
- Cohen et al. (1995) Cohen, M. H., Ogle, P. M., Tran, H. D., Vermeulen, R. C., Miloler, J. S., Goodrich, R. W., & Martel, A. R. 1995, ApJ, 448, L77
- Condon et al. (1998) Condon, J. J., Cotton, W. D., Greisen, E. W., Yin, Q. F., Perley, R. A., Taylor, G. B., & Broderick, J. J. 1998, AJ, 115, 1693
- Cutri et al. (2001) Cutri, R. M., Nelson, B. O., Kirkpatrick, J. D., Skrutskie, M. F., & Huchra, J. P. 2001, in preparation
- Cutri et al. (1994) Cutri, R. M., Huchra, J. P., Low, F. J., Brown, R. L., & Vanden Bout, P. A. 1994, ApJ, 424, L65
- di Serego Alighieri, Cimatti, & Fosbury (1994) di Serego Alighieri, S., Cimatti, A., & Fosbury, R. A. E. 1994, ApJ, 431, 123
- Gallagher et al. (2001) Gallagher, S. C., Brandt, W. N., Laor, A., Elvis, M., Mathur, S., Wills, B. J., & Iyomoto, N. 2001, ApJ, 546, 795
- Glenn, Schmidt, & Foltz (1994) Glenn, J., Schmidt, G. D., & Foltz, C. B. 1994, ApJ, 434, L47
- Goodrich (1997) Goodrich, R. W. 1997, ApJ, 474, 606
- Goodrich & Miller (1995) Goodrich, R. W., & Miller, J. S. 1995, ApJ, 448, L73
- Goodrich et al. (1996) Goodrich, R. W., Miller, J. S., Martel, A., Cohen, M. H., Tran, H. D., Ogle, P. M., & Vermeulen, R. C. 1996, ApJ, 456, L12
- Green et al. (2001) Green, P. J., Aldcroft, T. J., Mathur, S., Wilkes, B. J., & Elvis, M. 2001, ApJ, 558, 109
- Hines (1994) Hines, D. C. 1994, PhD Dissertation, University of Texas
- Hines et al. (2001) Hines, D. C., Schmidt, G. D., Gordon, K. D., Smith, P. S., Wills, B. J., Allen, R. G., & Sitko, M. L. 2001, ApJ, in press
- Hines et al. (1995) Hines, D. C., Schmidt, G. D., Smith, P. S., Cutri, R. M., & Low, F. J. 1995, ApJ, 450, L1
- Hines et al. (1999) Hines, D. C., Schmidt, G. D., Wills, B. J., Smith, P. S. & Sowinski, L. G. 1999, ApJ, 512, 145
- Hines & Wills (1995) Hines, D. C., & Wills, B. J. 1995, ApJ, 448, L69
- Hutsemékers, Lamy, & Remy (1998) Hutsemékers, D., Lamy, H., & Remy, M. 1998, A&A, 340, 371
- Impey & Tapia (1990) Impey, C. D., & Tapia, S. 1990, ApJ, 354, 124
- Jannuzi et al. (1995) Jannuzi, B. T., Elston, R., Schmidt, G. D., Smith, P. S., & Stockman, H. S. 1995, ApJ, 454, L111
- Lamy & Hutsemékers (2000) Lamy, H., & Hutsemékers, D. 2000, A&AS, 142, 451
- Low et al. (1989) Low, F. J., Cutri, R. M., Kleinmann, S. G. & Huchra, J. P. 1989, ApJ, 340, L1
- Low et al. (1988) Low, F. J., Huchra, J. P., Kleinmann, S. C., & Cutri, R. M. 1988, ApJ, 327, L41
- Mathur, Elvis, & Singh (1995) Mathur, S., Elvis, M., & Singh, K. P. 1995, ApJ, 455, L9
- McLeod & Rieke (1994) McLeod, K. K., & Rieke, G. H. 1994, ApJ, 420, 58
- Miller & Antonucci (1983) Miller, J. S., & Antonucci, R. R. J. 1983, ApJ, 271, L7
- Miller & Goodrich (1990) Miller, J. S., & Goodrich, R. W. 1990, ApJ, 355, 456
- Moore, Schmidt, & West (1987) Moore, R. L., Schmidt, G. D., & West, S. C. 1987, ApJ, 314, 176
- Moore & Stockman (1981) Moore, R. L., & Stockman, H. S. 1981, ApJ, 243, 60
- Moore & Stockman (1984) Moore, R. L., & Stockman, H. S. 1984, ApJ, 279, 465
- Neugebauer et al. (1987) Neugebauer, G., Green, R. F., Matthews, K., Schmidt, M., Soifer, B. T., & Bennett, J. 1987, ApJS, 63, 615
- Ogle et al. (1999) Ogle, P. M., Cohen, M. H., Miller, J. S., Tran, H. D., Goodrich, R. W., & Martel, A. R. 1999, ApJS, 125, 1
- Sanders & Mirabel (1996) Sanders, D. B., & Mirabel, I. F. 1996, ARA&A, 34, 749
- Schmidt, Elston, & Lupie (1992) Schmidt, G. D., Elston, R, & Lupie, O. L. 1992, AJ, 104, 1563
- Schmidt & Hines (1999) Schmidt, G. D., & Hines, D. C. 1999, ApJ, 512, 125
- Schmidt, Stockman, & Smith (1992) Schmidt, G. D., Stockman, H. S., & Smith, P. S. 1992, ApJ, 398, L57
- Schmidt & Green (1983) Schmidt, M., & Green, R. F. 1983, ApJ, 269, 352
- Sitko, Schmidt, & Stein (1985) Sitko, M L., Schmidt, G. D., & Stein, W. A. 1985, ApJS, 59, 323
- Skrutskie et al. (1997) Skrutskie, M. F., et al. 1997, in The Impact of Large Scale Near-IR Surveys, F. Garzon et al. eds., p. 25
- Smith et al. (1992) Smith, P. S., Hall, P. B., Allen, R. G., & Sitko, M. L. 1992, ApJ, 400, 115
- Smith et al. (2000a) Smith, P. S., Schmidt, G. D., Hines, D. C., Cutri, R. M., Nelson, B. O. 2000a, ApJ, 545, L19
- Smith et al. (2000b) Smith, P. S., Schmidt, G. D., Hines, D. C., Cutri, R. M., Nelson, B. O. 2000b, BAAS, 32, 1456
- Sprayberry & Foltz (1992) Sprayberry, D., & Foltz, C. B. 1992, ApJ, 390, 39
- Stockman, Moore, & Angel (1984) Stockman, H. S., Moore, R. L., & Angel, J. R. P. 1984, ApJ, 279, 485
- Tran (1995a) Tran, H. D. 1995a, ApJ, 440, 565
- Tran (1995b) Tran, H. D. 1995b, ApJ, 440, 578
- Tran (1995c) Tran, H. D. 1995c, ApJ, 440, 597
- Tran, Cohen, & Villar-Martin (2000) Tran, H. D., Cohen, M. H., & Villar-Martin, M. 2000, AJ, 120, 562
- Veron-Cetty & Veron (2001) Veron-Cetty, M. P., & Veron, P. 2001, A&A, 374, 92
- Wardle & Kronberg (1974) Wardle, J. F. C., & Kronberg, P. P. 1974, ApJ, 194, 249
- Wilkes et al. (2001) Wilkes, B. J., Schmidt, G. D., Cutri, R. M., Ghosh, H., Hines, D. C., Nelson, B., & Smith, P. S. 2001, ApJ Letters, in press
- Wilkes et al. (1995) Wilkes, B. J., Schmidt, G. D., Smith, P. S., Mathur, S., & McLeod, K. K. 1995, ApJ, 455, L13
- Wills & Hines (1997) Wills, B. J., & Hines, D. C. 1997, in Mass Ejection from Active Galactic Nuclei, N. Arav, I. Shlosman, and R. J. Weymann, eds. p. 99
- Wills et al. (1992) Wills, B. J., Wills, D., Evans II., N. J., Thompson, K. L., Berger, M., & Sitko, M. L. 1992, ApJ, 400, 96
- Young et al. (1996) Young, S., Hough, J. H., Efstathiou, A., Wills, B. J., Bailey, J. A., Ward, M. J., & Axon, D. J. 1996, MNRAS, 281, 1206
| Object | aaRedshift and spectral classification are taken from Cutri et al. (2001). Classification L = LINER and S = Starburst. Type 1.x refers to objects with broad H emission lines, but show no evidence of an H emission line. Type 1.b refers to objects that show broad H, but the spectra do not extend far enough to the blue to reach H. | TypeaaRedshift and spectral classification are taken from Cutri et al. (2001). Classification L = LINER and S = Starburst. Type 1.x refers to objects with broad H emission lines, but show no evidence of an H emission line. Type 1.b refers to objects that show broad H, but the spectra do not extend far enough to the blue to reach H. | bbData are from the 2MASS Point Source Catalog. | bbData are from the 2MASS Point Source Catalog. | bbData are from the 2MASS Point Source Catalog. | UT Date | ccThe listed degree of linear polarization has not been corrected for statistical bias. | Commentsdd2H60: Unfiltered observation obtained with the Two-Holer photo-polarimeter using a 4″ aperture at the SO Mt. Lemmon 1.5 m (60-inch) telescope. 2H90: Unfiltered observation obtained with the Two-Holer instrument using a 29 aperture at the Bok (90-inch) telescope. spol: Optical spectropolarimetry of 2MASSI J151653.2+190048 and 2MASSI J165939.7+183436 is reported by Smith et al. (2000a). | ||||
|---|---|---|---|---|---|---|---|---|---|---|---|---|
| (2MASSI J) | (yymmdd) | (%) | (%) | (∘) | (∘) | |||||||
| 000703.6+155423 | 0.114 | 1.8 | 13.10 | 2.13 | 4.30 | 25.42 | 991011 | 0.99 | 0.81 | 2H90 | ||
| 000810.8+135452 | 0.185 | 2 | 14.40 | 2.10 | 5.70 | 25.29 | 000107 | 0.79 | 0.47 | 101.9 | 22.6 | |
| 002614.5+184612 | 0.319 | 1 | 14.56 | 2.15 | 3.94 | 26.57 | 991012 | 1.01 | 1.27 | 2H90 | ||
| 002924.5+242430 | 0.370 | 1 | 14.29 | 2.16 | 3.11 | 27.25 | 991012 | 1.70 | 0.88 | 89.2 | 18.5 | 2H90 |
| 004118.7+281640 | 0.194 | 1 | 12.50 | 2.04 | 3.40 | 27.29 | 990909 | 2.16 | 0.27 | 103.5 | 3.5 | 2H60 |
| 005010.1+280619 | 0.277 | S | 15.13 | 2.64 | 5.87 | 25.84 | 991016 | 2.28 | 0.75 | 49.2 | 9.5 | |
| 005055.7+293328 | 0.136 | 2 | 13.22 | 2.11 | 5.68 | 25.72 | 990911 | 2.47 | 0.49 | 98.8 | 5.7 | 2H60 |
| 010230.1+262337 | 0.194 | 1.x | 13.83 | 2.25 | 6.87 | 26.03 | 991016 | 2.11 | 0.61 | 120.5 | 8.3 | |
| 010607.7+260334 | 0.411 | 1 | 14.61 | 2.69 | 6.39 | 27.58 | 991016 | 6.49 | 0.89 | 117.0 | 3.9 | |
| 000108 | 5.79 | 0.69 | 112.2 | 3.4 | ||||||||
| ave. | 6.03 | 0.54 | 114.1 | 2.6 | ||||||||
| 010835.1+214818 | 0.285 | 1.9 | 13.46 | 2.75 | 6.54 | 27.64 | 990913 | 4.45 | 1.92 | 116.9 | 14.4 | 2H60 |
| 991011 | 5.93 | 1.15 | 119.7 | 5.6 | 2H90 | |||||||
| ave. | 5.45 | 0.99 | 119.1 | 5.2 | ||||||||
| 012031.5+200327 | 0.087 | S | 12.47 | 3.85 | 5.63 | 25.66 | 990912 | 3.65 | 1.54 | 125.9 | 14.0 | 2H60 |
| 991012 | 0.74 | 1.67 | 2H90 | |||||||||
| 000108 | 0.65 | 0.27 | 128.9 | 13.8 | ||||||||
| ave. | 0.74 | 0.26 | 128.5 | 11.3 | ||||||||
| 015721.0+171248 | 0.213 | 1.x | 13.16 | 2.70 | 7.34 | 27.09 | 991012 | 1.17 | 2.09 | 2H90 | ||
| 000107 | 1.50 | 0.48 | 65.5 | 9.2 | ||||||||
| ave. | 1.44 | 0.47 | 66.6 | 9.9 | ||||||||
| 022150.6+132741 | 0.140 | 1.8 | 13.25 | 2.38 | 5.65 | 25.82 | 991011 | 1.06 | 1.72 | 2H90 | ||
| 000107 | 0.40 | 0.25 | 12.1 | 23.7 | ||||||||
| ave. | 0.39 | 0.24 | 13.6 | 24.0 | ||||||||
| 023430.6+243835 | 0.310 | 1.5 | 13.75 | 2.20 | 7.25 | 27.33 | 991011 | 2.57 | 0.46 | 99.1 | 5.1 | 2H90 |
| 024807.3+145957 | 0.072 | 1 | 12.65 | 2.16 | 1.85 | 24.79 | 000108 | 0.37 | 0.15 | 75.7 | 13.6 | |
| 032458.2+174849 | 0.328 | 1 | 12.82 | 2.37 | 4.18 | 28.49 | 990912 | 1.23 | 0.38 | 119.2 | 8.8 | 2H60 |
| 034329.6+132519 | 0.314 | 1 | 14.28 | 2.12 | 3.42 | 26.79 | 991012 | 1.38 | 0.76 | 0.8 | 20.1 | 2H90 |
| 034857.6+125547 | 0.210 | 1.x | 13.60 | 3.30 | 6.10 | 26.82 | 991016 | 2.23 | 0.73 | 69.5 | 9.4 | |
| 081652.2+425829 | 0.235 | 1 | 13.73 | 2.11 | 3.57 | 26.57 | 991012 | 1.13 | 0.56 | 169.3 | 17.4 | 2H90 |
| 082311.3+435318 | 0.182 | 1.5 | 12.85 | 2.08 | 3.65 | 26.80 | 991012 | 1.31 | 0.71 | 73.6 | 19.7 | 2H90 |
| 085045.3+172003 | 0.343 | 1.5 | 14.46 | 2.22 | 3.74 | 26.91 | 000106 | 2.09 | 0.23 | 100.3 | 3.2 | |
| 085116.8+120028 | 0.370 | 1 | 14.71 | 2.26 | 3.89 | 26.89 | 000106 | 0.61 | 0.36 | 93.3 | 22.1 | |
| 091602.6+210617 | 0.422 | 1.5 | 14.99 | 2.06 | 3.32 | 26.86 | 000107 | 0.81 | 0.31 | 1.9 | 12.2 | |
| 091848.6+211717 | 0.149 | 1.5 | 12.55 | 2.25 | 5.95 | 26.65 | 000107 | 6.30 | 0.14 | 154.1 | 0.6 | |
| 092049.0+190320 | 0.156 | 1.b | 14.92 | 2.06 | 5.78 | 24.34 | 000107 | 1.15 | 0.52 | 19.9 | 15.5 | |
| 092151.2+175855 | 0.356 | 1.5 | 14.79 | 2.06 | 2.71 | 26.59 | 000107 | 0.40 | 0.32 | |||
| 094636.4+205610 | 0.280 | 1.5 | 13.72 | 2.08 | 3.98 | 27.03 | 000107 | 0.22 | 0.24 | |||
| 094927.7+314110 | 0.308 | 1.x | 13.28 | 2.09 | 3.22 | 27.72 | 000107 | 0.44 | 0.16 | 148.8 | 12.0 | |
| 095504.5+170556 | 0.139 | 1 | 13.44 | 2.03 | 3.96 | 25.54 | 000108 | 0.34 | 0.18 | 87.2 | 18.6 | |
| 100121.1+215011 | 0.248 | S | 14.68 | 2.18 | 5.52 | 25.79 | 000505 | 2.12 | 0.98 | 138.0 | 15.7 | |
| 000509 | 0.95 | 0.62 | 124.7 | 25.1 | ||||||||
| ave. | 1.25 | 0.52 | 130.9 | 13.8 | ||||||||
| 101400.4+194614 | 0.110 | 1.5 | 12.37 | 2.01 | 4.13 | 26.05 | 000108 | 0.67 | 0.12 | 98.7 | 5.2 | |
| 101649.3+215435 | 0.257 | 1 | 13.94 | 2.03 | 3.16 | 26.56 | 000108 | 0.24 | 0.18 | |||
| 102724.9+121920 | 0.231 | 1.5 | 13.22 | 2.06 | 5.28 | 27.02 | 000107 | 1.83 | 0.31 | 141.2 | 4.9 | |
| 105144.2+353930 | 0.158 | L | 13.54 | 2.11 | 5.06 | 25.77 | 000108 | 0.54 | 0.29 | 47.8 | 19.0 | |
| 125807.4+232921 | 0.259 | 1 | 13.45 | 2.07 | 3.85 | 27.09 | 000108 | 1.22 | 0.13 | 105.8 | 3.0 | |
| 130005.3+163214 | 0.080 | 1.x | 11.86 | 2.20 | 5.24 | 25.84 | 000108 | 1.68 | 0.14 | 43.9 | 2.3 | |
| 130700.6+233805 | 0.275 | 1.b | 13.45 | 3.34 | 7.58 | 27.79 | 000505 | 1.58 | 0.96 | 29.1 | 23.1 | |
| 000508 | 3.18 | 0.83 | 40.9 | 7.5 | ||||||||
| ave. | 2.45 | 0.63 | 37.7 | 7.3 | ||||||||
| 132917.5+121340 | 0.203 | 1 | 14.12 | 2.02 | 4.58 | 25.78 | 000505 | 2.30 | 0.37 | 38.3 | 4.6 | |
| 134915.2+220032 | 0.062 | 1.5 | 12.24 | 2.21 | 3.27 | 24.87 | 000505 | 2.88 | 0.22 | 105.4 | 2.2 | |
| 140251.2+263117 | 0.187 | 1 | 12.67 | 2.11 | 3.83 | 27.05 | 000505 | 0.21 | 0.21 | |||
| 145331.5+135358 | 0.139 | 1.x | 13.09 | 2.23 | 4.51 | 25.93 | 000505 | 0.81 | 0.29 | 73.4 | 11.4 | |
| 145406.6+195028 | 0.260 | 1.5 | 14.71 | 2.37 | 5.69 | 25.96 | 000505 | 0.92 | 0.44 | 58.3 | 16.6 | |
| 145410.1+195648 | 0.243 | 1.9 | 14.17 | 2.23 | 5.33 | 26.27 | 000505 | 0.42 | 0.70 | |||
| 145608.6+275008 | 0.250 | 1 | 13.38 | 2.01 | 2.92 | 27.04 | 000505 | 0.17 | 0.31 | |||
| 150113.1+232908 | 0.258 | 1.x | 13.46 | 2.48 | 5.84 | 27.24 | 000505 | 3.07 | 0.46 | 154.1 | 4.2 | |
| 151621.1+225944 | 0.190 | 1.b | 14.12 | 2.11 | 5.28 | 25.64 | 000508 | 1.02 | 0.28 | 150.7 | 8.0 | |
| 151653.2+190048 | 0.190 | 1 | 11.41 | 2.12 | 4.39 | 28.35 | 000508 | 9.37 | 0.08 | 103.5 | 0.3 | spol |
| 151901.5+183804 | 0.187 | 1 | 14.25 | 2.15 | 4.65 | 25.48 | 000508 | 0.67 | 0.22 | 131.7 | 10.5 | |
| 152151.0+225120 | 0.287 | 1.x | 14.30 | 2.33 | 6.20 | 26.62 | 000509 | 1.02 | 0.48 | 117.5 | 16.3 | |
| 154307.7+193751 | 0.228 | 1.5 | 12.74 | 2.29 | 3.86 | 27.55 | 000505 | 1.33 | 0.26 | 29.6 | 5.6 | |
| 163700.2+222114 | 0.211 | 1.x | 13.59 | 2.10 | 5.41 | 26.44 | 990913 | 4.91 | 1.89 | 111.0 | 12.4 | 2H60 |
| 000505 | 2.27 | 0.41 | 101.2 | 5.1 | ||||||||
| ave. | 2.34 | 0.40 | 102.1 | 4.9 | ||||||||
| 163736.5+254302 | 0.277 | 1.9 | 14.17 | 2.34 | 5.23 | 26.66 | 991012 | 5.05 | 3.25 | 109.3 | 25.4 | 2H90 |
| 000508 | 0.60 | 0.39 | 53.3 | 25.6 | ||||||||
| 000509 | 1.34 | 0.41 | 158.5 | 8.7 | ||||||||
| ave. | 0.39 | 0.28 | ||||||||||
| 165939.7+183436 | 0.170 | 1.5 | 12.91 | 2.17 | 5.29 | 26.59 | 990913 | 6.30 | 0.73 | 162.4 | 3.3 | 2H60;spol |
| 170003.0+211823 | 0.596 | 1.5 | 14.88 | 2.46 | 7.21 | 28.30 | 000508 | 11.11 | 0.80 | 109.3 | 2.0 | |
| 170536.6+210137 | 0.271 | 1.x | 14.31 | 2.48 | 5.99 | 26.52 | 991011 | 0.90 | 1.43 | 2H90 | ||
| 171442.7+260248 | 0.163 | 1 | 13.08 | 2.25 | 3.82 | 26.34 | 990911 | 0.86 | 0.33 | 64.5 | 12.1 | 2H60 |
| 171559.7+280717 | 0.524 | 1.8 | 14.63 | 2.46 | 6.37 | 28.14 | 000509 | 6.08 | 1.28 | 6.8 | 6.0 | |
| 222202.2+195231 | 0.366 | 1.5 | 13.30 | 2.88 | 6.20 | 28.60 | 991011 | 7.19 | 1.14 | 109.1 | 4.5 | 2H90 |
| 222221.1+195947 | 0.211 | 1 | 12.92 | 2.11 | 4.58 | 27.10 | 990911 | 0.95 | 0.23 | 138.9 | 7.0 | 2H60 |
| 222554.2+195837 | 0.147 | 2 | 13.49 | 2.15 | 5.31 | 25.65 | 990911 | 1.38 | 0.56 | 58.6 | 13.4 | 2H60 |
| 223742.6+145614 | 0.277 | 1 | 14.00 | 2.05 | 3.40 | 26.71 | 990913 | 1.37 | 1.07 | 2H60 | ||
| 990914 | 2.26 | 1.97 | 2H60 | |||||||||
| 991012 | 0.65 | 0.87 | 2H90 | |||||||||
| ave. | 0.60 | 0.64 | ||||||||||
| 223946.0+192955 | 0.194 | S | 14.67 | 2.12 | 4.23 | 25.15 | 991011 | 0.60 | 1.33 | 2H90 | ||
| 230304.3+162440 | 0.289 | 2/S | 14.67 | 2.35 | 5.73 | 26.28 | 991011 | 1.11 | 1.43 | 2H90 | ||
| 000108 | 0.22 | 0.55 | ||||||||||
| ave. | 0.24 | 0.51 | ||||||||||
| 230307.2+254503 | 0.331 | 1.5 | 14.50 | 2.09 | 6.21 | 26.70 | 991011 | 4.38 | 1.16 | 140.0 | 7.6 | 2H90 |
| 230442.4+270616 | 0.237 | 1.5 | 14.77 | 2.13 | 5.03 | 25.57 | 991011 | 0.25 | 1.90 | 2H90 | ||
| 000108 | 0.29 | 0.57 | ||||||||||
| ave. | 0.24 | 0.55 | ||||||||||
| 232250.4+261845 | 0.328 | 1 | 14.36 | 2.12 | 3.25 | 26.83 | 990913 | 1.68 | 1.83 | 2H60 | ||
| 991012 | 1.82 | 1.22 | 2H90 | |||||||||
| ave. | 1.76 | 1.02 | 135.9 | 25.2 | ||||||||
| 232745.6+162434 | 0.364 | ? | 14.48 | 2.41 | 5.62 | 27.16 | 991011 | 3.43 | 4.73 | 2H90 | ||
| 991016 | 1.05 | 0.57 | 90.6 | 19.8 | ||||||||
| ave. | 1.08 | 0.57 | 90.0 | 18.9 | ||||||||
| 233200.6+291423 | 0.301 | 1.5 | 14.67 | 2.09 | 3.63 | 26.27 | 991012 | 2.29 | 1.46 | 77.4 | 24.7 | 2H90 |
| 234259.3+134750 | 0.299 | 1.5 | 14.19 | 2.02 | 4.02 | 26.70 | 990911 | 0.51 | 0.46 | 2H60 | ||
| 234449.5+122143 | 0.199 | 1 | 12.91 | 2.07 | 4.49 | 26.95 | 990911 | 1.01 | 0.24 | 127.2 | 6.7 | 2H60 |
| Object | aaRedshift and spectral classification are taken from Cutri et al. (2001). Classification L = LINER and S = Starburst. Type 1.x refers to objects with broad H emission lines, but show no evidence of an H emission line. Type 1.b refers to objects that show broad H, but the spectra do not extend far enough to the blue (or red) to include H. | TypeaaRedshift and spectral classification are taken from Cutri et al. (2001). Classification L = LINER and S = Starburst. Type 1.x refers to objects with broad H emission lines, but show no evidence of an H emission line. Type 1.b refers to objects that show broad H, but the spectra do not extend far enough to the blue (or red) to include H. | bbData are from the 2MASS Point Source Catalog. | bbData are from the 2MASS Point Source Catalog. | bbData are from the 2MASS Point Source Catalog. | UT Date | ccThe listed degree of linear polarization has not been corrected for statistical bias. | Commentsdd2H60: Unfiltered observation obtained with the Two-Holer photo-polarimeter using a 4″ aperture at the SO Mt. Lemmon 1.5 m (60-inch) telescope. 2H90: Unfiltered observation obtained with the Two-Holer instrument using a 29 aperture at the Bok (90-inch) telescope. | ||||
|---|---|---|---|---|---|---|---|---|---|---|---|---|
| (2MASSI J) | (yymmdd) | (%) | (%) | (∘) | (∘) | |||||||
| 004117.7+155129 | 0.080 | L | 13.91 | 1.52 | 2.70 | 23.70 | 000107 | 0.29 | 0.22 | |||
| 004125.3+134335 | 0.033 | 2/L | 14.32 | 1.50 | 2.88 | 21.31 | 000108 | 0.42 | 0.35 | |||
| 004930.9+153216 | 0.240 | 1 | 14.01 | 1.83 | 3.69 | 26.24 | 991011 | 0.93 | 0.80 | 2H90 | ||
| 005219.9+170241 | 0.250 | 1.b | 14.19 | 1.90 | 3.01 | 26.19 | 991012 | 1.28 | 1.08 | 2H90 | ||
| 005812.8+160201 | 0.211 | 1.b | 13.30 | 1.92 | 3.60 | 26.66 | 990909 | 0.67 | 0.28 | 15.2 | 13.8 | 2H60 |
| 024026.6+123715 | 0.321 | 1.5 | 13.90 | 1.91 | 3.80 | 27.23 | 990909 | 0.79 | 0.70 | 2H60 | ||
| 024140.3+163322 | 0.278 | 2 | 15.06 | 1.79 | 6.64 | 25.55 | 991016 | 0.37 | 0.81 | 2H60 | ||
| 030750.1+160931 | 0.325 | 1.8 | 14.84 | 1.72 | 2.96 | 26.12 | 990111 | 3.04 | 2.96 | 2H90 | ||
| 000107 | 0.64 | 0.44 | ||||||||||
| ave. | 0.64 | 0.44 | ||||||||||
| 031302.2+210714 | 0.094 | L | 13.84 | 1.90 | 4.05 | 24.18 | 000107 | 1.53 | 0.43 | 147.5 | 8.0 | |
| 092145.7+191812 | 1.800 | 1.b | 14.55 | 2.20 | 6.45 | 32.27 | 000108 | 3.45 | 3.19 | |||
| 095430.4+145250 | 0.173 | 2/L | 14.47 | 1.85 | 4.53 | 24.99 | 000108 | 0.78 | 0.42 | 123.8 | 19.6 | |
| 135852.5+295413 | 0.113 | 1.b | 12.85 | 1.80 | 4.15 | 25.58 | 000505 | 4.83 | 0.24 | 18.5 | 1.4 | |
| 142834.0+213014 | 0.285 | 1 | 14.84 | 1.69 | 2.86 | 25.78 | 000505 | 0.22 | 0.36 | |||
| 145744.9+202809 | 0.069 | 2/L | 14.87 | 1.40 | 3.93 | 22.39 | 000505 | 0.72 | 0.68 | |||
| 154443.6+271850 | 0.172 | 2 | 14.67 | 1.59 | 4.63 | 24.70 | 000508 | 0.44 | 0.40 | |||
| 155059.3+212808 | 0.373 | 1 | 14.31 | 1.80 | 2.99 | 27.04 | 000508 | 0.66 | 0.24 | 83.3 | 12.7 | |
| 170056.0+243928 | 0.509 | 1.5 | 14.26 | 1.71 | 2.54 | 27.86 | 990911 | 1.56 | 0.29 | 83.4 | 5.4 | 2H60 |
| 225902.5+124646 | 0.199 | 1.x | 14.11 | 1.93 | 4.49 | 25.71 | 990913 | 1.90 | 1.18 | 132.2 | 23.7 | 2H60 |
| 991011 | 0.39 | 1.03 | 2H90 | |||||||||
| ave. | 1.03 | 0.78 | ||||||||||
| 234905.2+183315 | AGN? | 14.05 | 2.37 | 8.09 | 991016 | 4.30 | 1.24 | 157.6 | 8.2 |
| Field | Object | RA (J2000) | Dec (J2000) | aaThe listed degree of linear polarization has not been corrected for statistical bias. | |||
|---|---|---|---|---|---|---|---|
| (2MASSI J) | (::) | (::) | (%) | (%) | (∘) | (∘) | |
| 004118.7+281640 | GSC 1744-2794 | 00:41:25.6 | +28:15:43 | 0.74 | 0.08 | 117.1 | 3.2 |
| 005010.1+280619 | field galaxy | 00:50:10.5 | +28:06:24 | 2.40 | 0.92 | 139.8 | 12.3 |
| 005055.7+293328 | GSC 1745-651 | 00:50:45.3 | +29:33:36 | 0.73 | 0.06 | 114.7 | 2.3 |
| 023430.6+243835 | GSC 1771-1156 | 02:34:28.3 | +24:37:04 | 1.07 | 0.26 | 114.1 | 6.9 |
| 030750.1+160931 | 03:07:53.7 | +16:10:09 | 0.74 | 0.20 | 143.3 | 7.6 | |
| 031302.2+210714 | 03:13:02.6 | +21:07:44 | 1.28 | 0.50 | 115.9 | 12.5 | |
| 032458.2+174849 | 03:25:02.8 | +17:49:28 | 0.87 | 0.25 | 117.0 | 8.1 | |
| 034857.6+125547 | 03:48:58.6 | +12:55:36 | 1.65 | 0.12 | 53.0 | 2.0 | |
| 095504.5+170556 | 09:55:03.5 | +17:05:55 | 1.28 | 0.53 | 84.4 | 13.7 | |
| 234449.5+122143 | GSC 1173-752 | 23:44:43.0 | +12:20:41 | 0.60 | 0.06 | 111.0 | 2.7 |
| Number | aaKendall’s : A value of 0 indicates no correlation between parameters. Values of +1 or 1 indicate a complete correlation or anticorrelation, respectively. | PbbThe probability of measuring this value of if there is no association between parameters. | |
|---|---|---|---|
| , | 70 | 0.23 | |
| , | 70ccA magnitude of is adopted for four objects that are not detected on the DSS. | 0.30 | |
| , | 70 | 0.25 |
| Number | aaThe median value of the sample is listed. | aaThe median value of the sample is listed. | aaThe median value of the sample is listed. | Number with | NVSS or FIRST | IRAS | |
|---|---|---|---|---|---|---|---|
| % | detections | detections | |||||
| 2MASS QSOs | 70 | 26.6 | 2.1 | 4.8 | 9 | 33 | 15 |
| Type 1 | 22 | 26.9 | 2.1 | 3.8 | 2 | 3 | 1 |
| Type 1.5 | 19 | 26.7 | 2.1 | 4.1 | 5 | 12 | 6 |
| Type 1.8–2 | 15 | 25.8 | 2.2 | 5.6 | 2 | 9 | 1 |
| Type 1.?bbThis category includes 13 objects with broad H emission lines, but either no detected H emission (10 objects), or the H spectral region was not covered in the spectra obtained by Cutri et al. (2001) (3 objects). One object (2M232745) has an ambiguous classification. | 14 | 26.6 | 2.3 | 5.8 | 0 | 9 | 7 |
| PG QSOs () | 75 | 26.7 | 1.8 | 3.1 | 0 | 38 | 19 |
| Type 1ccSpectral classification is from Veron-Cetty & Veron (2001). | 63 | 26.7 | 1.8 | 3.1 | 0 | 32 | 13 |
| Type 1.5ccSpectral classification is from Veron-Cetty & Veron (2001). | 12 | 25.9 | 1.7 | 3.2 | 0 | 6 | 6 |
| SampleaaPolarization data are from Berriman et al. (1990) (PG), Hines (1994) (IRAS HIGs), Schmidt & Hines (1999), Hutsemékers, Lamy, & Remy (1998), and Lamy & Hutsemékers (2000) (BALQSO). | Number | Range in | PKSbbThe probability determined from a KS test that the two samples are drawn from the same parent population. | ||
|---|---|---|---|---|---|
| (%) | (%) | (%) | |||
| 2MASS | 70 | 1.9 | 0.5 | 0.2–11.1 | |
| PG | 75 | 0.6 | 0.2 | 0.1–2.5 | |
| 2MASS | 70 | 1.9 | 0.5 | 0.2–11.1 | |
| BALQSO | 85 | 1.2 | 0.4 | 0.1–7.6 | |
| 2MASS | 70 | 1.9 | 0.5 | 0.2–11.1 | |
| IRAS HIGs | 19 | 4.3 | 0.4 | 0.3–16.4 | |
| PG | 75 | 0.6 | 0.2 | 0.1–2.5 | |
| BALQSO | 85 | 1.2 | 0.4 | 0.1–7.6 | |
| PG | 75 | 0.6 | 0.2 | 0.1–2.5 | |
| IRAS HIGs | 19 | 4.3 | 0.4 | 0.3–16.4 | |
| BALQSO | 85 | 1.2 | 0.4 | 0.1–7.6 | |
| IRAS HIGs | 19 | 4.3 | 0.4 | 0.3–16.4 |