The Soft Gamma-Ray Spectral Variability of Cygnus X-1
Abstract
We have used observations of Cygnus X-1 from the Compton Gamma-Ray Observatory (CGRO) and BeppoSAX to study the variation in the MeV -ray emission between the hard and soft spectral states, using spectra that cover the energy range 20 keV up to 10 MeV. These data provide evidence for significant spectral variability at energies above 1 MeV. In particular, whereas the hard X-ray flux decreases during the soft state, the flux at energies above 1 MeV increases, resulting in a significantly harder -ray spectrum at energies above 1 MeV. This behavior is consistent with the general picture of galactic black hole candidates having two distinct spectral forms at soft -ray energies. These data extend this picture, for the first time, to energies above 1 MeV. We have used two different hybrid thermal/non-thermal Comptonization models to fit broad band spectral data obtained in both the hard and soft spectral states. These fits provide a quantitative estimate of the electron distribution and allow us to probe the physical changes that take place during transitions between the low and high X-ray states. We find that there is a significant increase (by a factor of ) in the bolometric luminosity as the source moves from the hard state to the soft state. Furthermore, the presence of a non-thermal tail in the Comptonizing electron distribution provides significant constraints on the magnetic field in the source region.
1 Introduction
High energy emission from galactic black hole candidates (GBHCs) is characterized by variability on time scales ranging from msec to months. In the case of Cygnus X-1, it has long been recognized that, on time scales of several weeks, the soft X-ray emission ( keV) generally varies between two discrete levels (e.g., Priedhorsky et al., 1983; Ling et al., 1983; Liang & Nolan, 1983). The source seems to spend most () of its time in the so-called low X-ray state, characterized by a relatively low flux of soft X-rays and a relatively high flux of hard X-rays ( keV). This state is sometimes referred to as the hard state, based on the nature of its soft X-ray spectrum. On occasion, it moves into the so-called high X-ray state, characterized by a relatively high soft X-ray flux and a relatively low hard X-ray flux. This state is sometimes referred to as the soft state, based on the nature of its soft X-ray spectrum. There are, however, some exceptions to this general behavior. For example, HEAO-3 observed, in 1979, a relatively low hard X-ray flux coexisting with a low level of soft X-ray flux (Ling et al., 1983, 1987). Ubertini et al. (1991) observed a similar behavior in 1987.
Observations by the BATSE, OSSE, COMPTEL and EGRET instruments on the Compton Gamma-Ray Observatory (CGRO), coupled with observations by other high-energy experiments (e.g., SIGMA, ASCA and RXTE) have provided a wealth of new information regarding the emission properties of galactic black hole candidates. One important aspect of these high energy radiations is spectral variability, observations of which can provide constraints on models which seek to describe the global emission processes. Based on observations by OSSE of seven transient galactic black hole candidates at soft -ray energies (i.e., below 1 MeV), two -ray spectral shapes have been identified that appear to be well-correlated with the soft X-ray state (Grove et al., 1997, 1998; Grove, 1999). In particular, these observations define a breaking -ray spectrum that corresponds to the hard (low) X-ray state and a power-law -ray spectrum that corresponds to the soft (high) X-ray state.
A thorough understanding of the nature of these systems requires modeling that cannot only explain the individual spectra, but can also explain the transitions between the various spectral states (e.g., Grove et al., 1998; Liang, 1998; Poutanen, 1998a). In recent years, a general theoretical picture of the accretion flow in Cygnus X-1 has emerged which appears to provide a reasonable explanation of the spectral data in both the low and high X-ray states. This model includes an inner optically-thin, geometrically-thick advection-dominated accretion flow (ADAF) surrounded by an outer, geometrically-thin, optically-thick accretion disk (Esin et al., 1998). The outer disk is characterized by a blackbody spectrum. ADAF flows (e.g., Narayan, 1996) are characterized by their relatively low radiative efficiencies and by a two-temperature structure, with the ions nearly virial at K and the electrons at K. The high temperature of the ADAF leads to an extended, quasi-spherical geometry. Hot optically-thin ADAFs exist only below a certain critical accretion rate. The transition radius between the ADAF and the thin disk therefore depends on the accretion rate. At higher accretion rates, where it is more difficult to support the ADAF, the transition radius moves to smaller radii, closer to the black hole. The ADAF region is largely responsible for the hard X-ray flux ( keV), while the outer thin disk is generally responsible for the soft X-ray flux ( keV).
In the context of this general model, the spectral state of Cygnus X-1 depends on the accretion rate. At low accretion rates, the inner ADAF extends out to a transition radius of Schwarzschild radii (Esin et al., 1998). In this configuration, the ADAF region makes a significant contribution to the hard X-ray flux. At higher accretion rates, it becomes more difficult to support the ADAF. The ADAF region therefore shrinks, and the transition radius moves inward, although there may exist a low-density ADAF corona surrounding the thin disk (Narayan et al., 1998). The level of hard X-ray flux decreases due to the smaller volume of the ADAF region, while the level of soft X-ray flux increases due to the larger size of the thin disk region. In this scenario, the hard state corresponds to a relative low accretion rate, with the spectrum dominated by the ADAF region, and the soft state corresponds to a relatively high accretion rate, with the spectrum dominated by the blackbody of the outer thin disk region. Small changes in the accretion rate (on the order of 10–15%) may be sufficient to trigger a transition between the hard and soft states (Esin et al., 1998).
The ADAF model described above provides a consistent framework for understanding the essential dynamics and spectra of black hole accretion flows. In the context of this framework, however, simple thermal Comptonization models appear unable to account for all of the spectral features, especially the hard power-law tail that is seen at energies above keV (Gierliński et al., 1999). Poutanen & Coppi (1998) used a geometry similar to that described above (Poutanen et al., 1997) and assumed some (unspecified) source of non-thermal electrons that remains constant during the spectral state transitions. This suggests that the non-thermal component may play a more significant role, especially at higher energies, during the high X-ray state, where the ADAF contribution is suppressed.
Hybrid thermal/non-thermal plasmas have often been successfully used to model the observed data (e.g., Gierliński et al., 1999; Poutanen & Coppi, 1998). Based on the assumption that the spectrum results from inverse Compton scattering of a thermal photon spectrum by energetic electrons, the underlying electron population could be described as a combination of a thermal Maxwellian and a power-law tail extending to higher energies. The presence of a non-thermal component is often assumed a priori, without any specific model to explain the origin, although the existence of such distributions is clearly established in the case of solar flares (e.g., Coppi, 1999) and it is therefore natural to expect that similar distributions exist elsewhere in the universe (e.g., Crider et al., 1997; Gierliński et al., 1997; Poutanen & Svensson, 1996; Poutanen, 1998a; Poutanen & Coppi, 1998; Coppi, 1999). Others have considered physical mechanisms by which non-thermal electron distributions might be developed. For example, both stochastic particle acceleration (Dermer et al., 1996; Li et al., 1996) and MHD turbulence (Li & Miller, 1997) have been proposed as mechanisms for directly accelerating the electrons. The ion population might also contribute to the non-thermal electron distribution in the case where a two-temperature plasma develops (e.g., Dahlbacka et al., 1974; Shapiro et al., 1976; Chakrabarti & Titarchuk, 1995). With ion population temperatures approaching K, production from proton-proton interactions may take place (e.g., Eilik, 1980; Eilik & Kafatos, 1983; Mahadevan et al., 1997). The component may then lead, via photon-photon interactions between the -decay photons and the X-ray photons, to production of energetic (nonthermal) pairs. Jordain & Roques (1994) used this concept to fit the hard X-ray tails of not only Cygnus X-1, but also GRO J0422+32 and GX 339-4, as measured by both SIGMA and OSSE. While retaining a standard thermal Comptonization spectrum (Sunyaev & Titarchuk, 1980) to explain the emission at energies below 200 keV, they used production to generate the nonthermal pairs needed to fit the spectrum at energies above keV.
The power-law spectra seen in the high X-ray state have also been modeled as resulting from bulk-motion Comptonization (e.g., Ebisawa et al., 1996b; Titarchuk et al., 1997; Laurent & Titarchuk, 1999). In this model, the flow becomes quasi-spherical within the inner-most stable orbit. The nearly relativistic flow of the free-falling electrons gives rise to the Comptonization of ambient photons. This model predicts power-law spectra, with a slope that depends on the mass acretion rate. The difficulty with this model is that it predicts spectral sharp cutoffs below 500 keV, a result that is clearly inconsistent with the observed spectra. Although we cannot rule out bulk motion Comptonization as a contributor to the spectrum at lower energies, it is clearly not capable of accounting for the high energy emission.
Improvements in the theoretical modeling of spectral state transitions can be expected to arise from improved observations at energies above 600 keV. It will be important to understand how this part of the spectrum, most likely dominated by non-thermal emission, changes during the spectral transition. Of particular interest will be observations that can discern a clear cutoff in the spectra at high energies. The precise energy of the cutoff is a function of the compactness of the source region, since it is influenced by opacity. A measure of the cutoff energy, possibly coupled with measurements of the 511 keV annihilation line, will help constrain the compactness of the region responsible for the emission and determine the extent to which pairs may play a role in the emission region (Poutanen, 1998a).
Using hard state data collected during the first three years of the CGRO mission, McConnell et al. (2000a) compiled a broad-band hard state spectrum of Cygnus X-1 using contemporaneous data from all four instruments on CGRO (BATSE, OSSE, COMPTEL and EGRET). Unlike previous broad-band studies, these data provided a measurement of the spectrum at energies above 1 MeV. The resulting spectrum showed evidence for significant levels of non-thermal emission at energies out to 5 MeV. The spectral shape, although consistent with the so-called breaking spectral state (Grove et al., 1997, 1998) of the -ray emission, was clearly not consistent with standard Comptonization models. The hybrid thermal/non-thermal model of Poutanen & Svensson (1996) was used to fit the hard state data, with fits that indicated a thermal electron population with a temperature of keV and a high energy power-law electron component with a spectral index of .
In May of 1996, a transition of Cyg X-1 into a soft state was observed by RXTE, beginning on May 10 (Cui, 1997). The 2–12 keV flux reached a level of 2 Crab on May 19, four times higher than its normal value. Meanwhile, at hard X-ray energies (20-200 keV), BATSE measured a significant decrease in flux (Zhang et al., 1997). Motivated by these dramatic changes, a target-of-opportunity (ToO) for CGRO, with observations by OSSE and COMPTEL began on June 14 (CGRO viewing period 522.5). Here we report on the results from an analysis of the CGRO data from this ToO observation, incorporating the high energy results from COMPTEL. This includes a comparison with results obtained from an updated analysis of CGRO soft state data, making use of the same data studied previously by McConnell et al. (2000a). In 2 we describe the CGRO observations of Cygnus X-1 in its hard state. The data analysis is described in 3, followed by a discussion of those results in 4.
2 Observations
During its nine-year lifetime (1991–2000), the instruments on CGRO obtained numerous observations of the Cygnus region. The COMPTEL experiment (Schönfelder et al., 1993), imaging the energy range from about 750 keV up to 30 MeV, collected an extensive set of data, in part due to its rather large ( steradian) field-of-view. The COMPTEL data currently provide the best available source of data for studies of Cygnus X-1 at energies above 1 MeV.
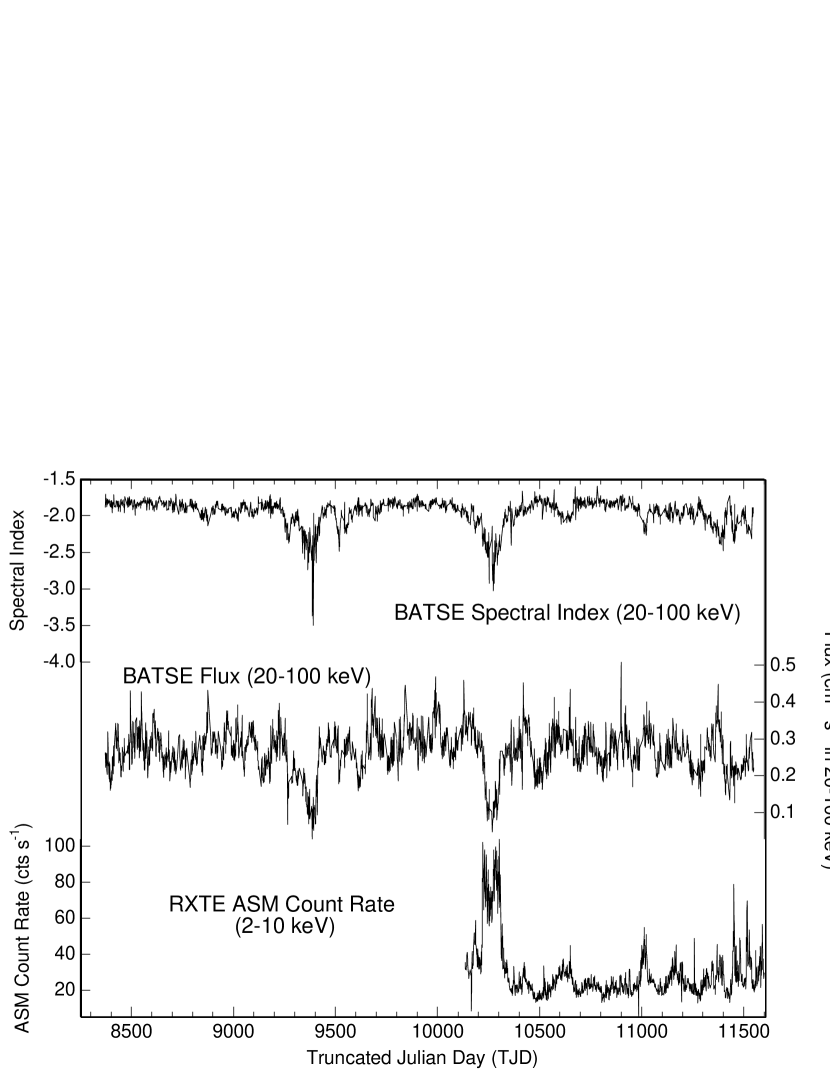
The 20–100 keV time history of Cygnus X-1, as derived from BATSE occultation data, is shown in the center panel of Figure 1. The top panel of Figure 1 shows the 20–100 keV power-law spectral index, as derived from the BATSE occultation data. These data cover most of the CGRO mission, from the launch in April of 1991 until the end of 1999. During the first few months of the CGRO mission (up until October of 1991), all-sky monitoring data from Ginga (1–20 keV) was available, showing that the source was in its low X-ray state during this period (Kitamoto et al., 2000). From October of 1991 until December of 1995, there were only sporadic pointed X-ray observations of the soft X-ray flux from Cygnus X-1. It was not until the launch of RXTE, in December of 1995, that continuous data on the soft X-ray flux once again became available. The data from the RXTE All-Sky Monitor (ASM) are shown in the lower panel of Figure 1, in the form of the 2–10 keV count rate.
The data shown in Figure 1 dramatically demonstrate the general X-ray behavior of Cygnus X-1. During the CGRO mission, Cygnus X-1 spent about 90% of its time in the hard state. In this state, the soft X-ray flux (2–10 keV) is relatively low, while the hard X-ray flux (20–100 keV) is relatively high. The spectral shape in the 20–100 keV energy band is a relatively hard power-law spectrum with a photon spectral index, , near . The soft state was clearly observed during the CGRO mission on only two occassions. In each case, the soft state period lasted about 5 months. The soft state is characterized by a relatively high level of soft X-rays (2–10 keV), a relatively low level of hard X-rays (20–100 keV) and a relatively soft spectrum in the 20–100 keV energy band (photon spectral index ). The soft state was first observed by CGRO in January of 1994, at a time (prior to the launch of RXTE) when there was no soft X-ray monitoring data available. (This transition is clearly seen in Figure 1 near TJD 9400.) A CGRO target-of-opportunity was declared (CGRO viewing period 318.1) so that all four CGRO instruments (not just BATSE) could collect data. Observations by COMPTEL showed no detectable level of emission. This null result, however, was consistent with an extrapolation of the power-law spectrum measured at hard X-ray energies by both BATSE (Ling et al., 1997) and OSSE (Phlips et al., 1996).
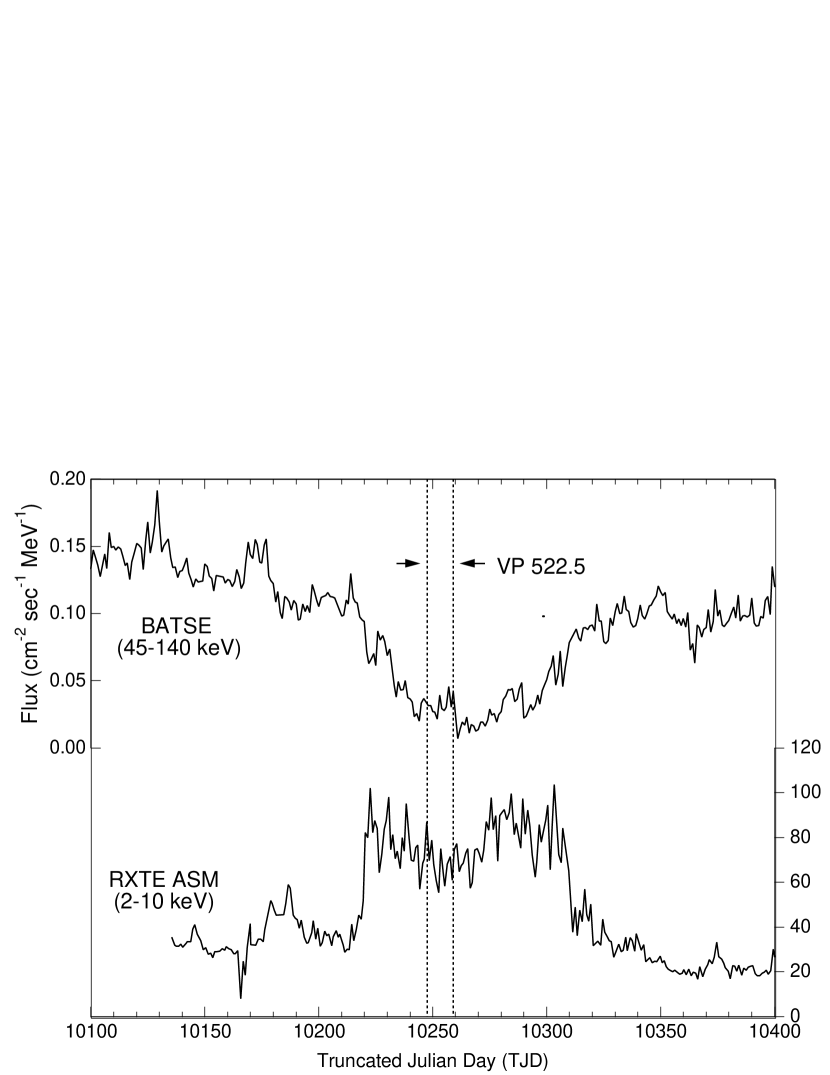
The second observation of a soft state took place in May of 1996. The transition was first observed by RXTE, beginning on May 10 (Cui, 1997). The 2–12 keV flux reached a level of 2 Crab on May 19, four times higher than its normal value. Meanwhile, at hard X-ray energies (20-200 keV), BATSE measured a significant decrease in flux (Zhang et al., 1997). Motivated by these dramatic changes, a ToO for CGRO was declared and observations by OSSE and COMPTEL began on June 14 (CGRO viewing period 522.5). (Unfortunately, the EGRET experiment was turned off during this viewing period, as part of an effort to conserve its supply of spark chamber gas.) During the ToO, COMPTEL collected 11 days of data (from June 14 to June 25) at a favorable aspect angle of 5.3∘. The X-ray flux time histories near the time interval associated with VP 522.5 are shown in Figure 2.
An early preliminary analysis of COMPTEL data from this second high-state observation revealed some unusual characteristics (McConnell et al., 2000b). The 1–3 MeV image (Figure 3) showed an unusually strong signal from Cygnus X-1 when compared with other observations of similar exposure. The flux level was significantly higher than the average flux seen from earlier observations (McConnell et al., 1994, 2000a). In the 1–3 MeV energy band, the flux had increased by a factor of 2.5, from cm-2s-1 MeV-1 to cm-2 s-1 MeV-1. The observed change in flux is significant at a level of . In addition, unlike in previous measurements, there was no evidence for any emission at energies below 1 MeV. This fact is explained, in part, by a slowly degrading sensitivity of COMPTEL at energies below 1 MeV due to increasing energy thresholds in the lower (D2) detection plane. Part of the explanation, however, appears to be the presence of a much harder source spectrum. OSSE data collected during this period showed a photon spectrum similar to that observed in 1994 (i.e., a power-law with an index of ), but at a higher intensity level, about a factor of two higher in overall normalization. The extrapolation of this more intense power-law spectrum is entirely consistent with the positive detection by COMPTEL.
3 Data Analysis
A more detailed description of the COMPTEL data analysis is given in McConnell et al. (2000a). Here we provide only a brief overview. The COMPTEL image shown in Figure 3 is a maximum likelihood map derived from VP 522.5 data integrated over the energy loss range of 1–3 MeV. The contours represent constant values of the quantity , where is the likelihood ratio. In a search for single point sources, has a chi-square distribution with 3 degrees of freedom. (For instance, a detection corresponds to = 14.2.) Cygnus X-1 is clearly visible. The likelihood reaches a value of at the position of Cygnus X-1, which corresponds to a detection significance of . These same data were used to derive the , and location confidence contours shown in Figure 4, which demonstrate the ability of COMPTEL to locate the source of emission. In defining constraints on the source location, has a chi-square distribution with 2 degrees of freedom. So the , and location confidence contours correspond to a change in likelihood of 2.3, 6.2, and 11.8, respectively. The contours reflect only the statistical uncertainties; systematic effects are not included. The COMPTEL flux results for VP 522.5 are shown in Table 1.
The analysis of COMPTEL data for a weak source (such as Cygnus X-1) involves generating an image for each of several energy bands, deriving the source flux in each energy band, and subsequently combining these results into a spectrum (e.g., McConnell et al., 2000a). The image generation process, in turn, requires an instrument point-spread-function (PSF) that is dependent on some assumed form for the incident photon spectrum. Because the spectrum extraction relies on an assumed source spectrum (we typically assume an power-law spectrum), it is not possible to analyze the COMPTEL data using a simple response function to relate measured energy-loss count rates to the incident photon flux. We have therefore resorted to spectral fitting of COMPTEL data in photon space. We have previously shown (McConnell et al., 2000a) that this approach to COMPTEL spectral analysis works fine for the range of spectra considered for Cygnus X-1. In other words, for the range of parameters considered here, there is no evidence of any significant level of spectral compliance in the COMPTEL spectral analysis.
In previous work (McConnell et al., 2000a), we analyzed a contemporaneous set of CGRO data corresponding to the hard state of Cygnus X-1. That analysis was performed entirely in photon space, using one deconvolved spectrum each for BATSE, OSSE and COMPTEL. The BATSE spectrum had been generated using the JPL Enhanced BATSE Occultation Package (EBOP; Ling et al., 1996, 2000), while the OSSE spectrum was based on the results of Phlips et al. (1996). The analysis was performed within XSPEC (Arnaud 1996) to take advantage of the XSPEC analysis tools. In this case, however, the spectral data (pha files) were generated in units of photons cm-2 s-1 and the response function matrices (rsp files) were generated as unit matrices. With these data, the spectral fits were effectively being performed in photon space. This approach greatly simplified the analysis effort.
The analysis employed here for the soft state data from VP 522.5 represents a significant improvement over that performed previously in generating a broad-band gamma-ray spectrum for the hard state. Although the limitations of the COMPTEL data analysis remain, we have utilized more complete spectral response information for both BATSE and OSSE, using proper XSPEC pha and rsp files. The fundamental nature of the COMPTEL data (in particular, its reliance on an assumed PSF for extracting source counts) still precludes a proper XSPEC analysis of the COMPTEL data.
Since the BATSE EBOP processing has not been carried out for data collected after 1994, EBOP data for VP 522.5 is not available. Instead, we have used data derived from the BATSE team’s standard Earth occultation analysis (Harmon et al., 2002). The final BATSE spectrum represents a weighted average of the four forward-facing detectors.
For consistency, in order to make a more useful comparison with the soft state data, we have repeated the earlier hard state analysis (McConnell et al., 2000a) following the same procedures as we have used here for the VP 522.5 data. In particular, the updated hard state analysis now also used BATSE data derived from the standard Earth occultation technique (Harmon et al., 2002). Data from nine separate CGRO viewing periods were used (see Table 1 in McConnell et al., 2000a). In each case a weighted average spectrum was derived from the data for use in the final analysis.
Finally, our most recent analysis incorporates the BATSE data down to 20 keV and OSSE data down to 50 keV. Previously, we had used only those data above 200 keV. The lower energy threshold of this analysis improves the ability of our fits to constrain the spectral models. At the same time, the lower threshold may also make the analysis more sensitive to systematic uncertainties in the low energy response of both BATSE and OSSE. The OSSE (Johnson et al. 1993) data include energy-dependent systematic errors (estimated from the uncertainties in the low-energy calibration and response of the detectors using both in-orbit and prelaunch calibration data), which are most important at the lowest energies, at 50 keV, decreasing to at keV. To the BATSE data, we added a 5% systematic error. The COMPTEL data have relatively large statistical errors, and thus no systematic error was added.
3.1 The Average Hard (Low) State Spectrum
X-rays from Cygnus X-1 in the hard state are well modeled by thermal Comptonization and Compton reflection (Gierliński et al. 1997; Di Salvo et al. 2001; Frontera et al. 2001). Thus, we fit the joint data by this model, but also allowing for a tail at high electron energies rather than the Maxwellian cutoff. This is similar to the approach used in McConnell et al. (2000a), except that here we have added the Compton reflection component, which is important at energies below a few hundred keV.
We first fit the data using the Comptonization model (compps)111available at ftp://ftp.astro.su.se/pub/juri/XSPEC/COMPPS of Poutanen & Svensson (1996), assuming a spherical source geometry. The electrons have the total Thomson optical depth of . Their distribution in this model is Maxwellian with an electron temperature, , up to a Lorentz factor, , above which it is a power law with an index, . The power law extends to a large Lorentz factor, . The precise value of , however, has little effect on the fit to our data as long as times the seed photon energy is MeV. Given that the seed photons peak at a fraction of keV (Ebisawa et al., 1996a; Di Salvo et al., 2001), we assume . The Comptonization spectrum is then Compton-reflected from a cold slab (presumably an accretion disk) subtending a solid angle, (Magdziarz & Zdziarski 1995). A disk inclination of is assumed (as in Gierliński et al., 1997; Frontera et al., 2001). For this model, we found is not constrained by our data and we kept it fixed at a typical value (Gierliński et al., 1997; Gilfanov et al., 1999; Di Salvo et al., 2001). This value also follows from our fit below using another theoretical model. The seed photons for Comptonization are assumed to be a (multicolor) blackbody emission of the disk with the maximum blackbody temperature of keV, which approximately corresponds to a single blackbody temperature of –0.15 keV obtained in the fits of Ebisawa et al. (1996a) and Di Salvo et al. (2001).
During the data analysis, we find some residual discrepancies between the different data sets, as expected for different instruments. First, the BATSE spectrum has a slightly higher normalization than the OSSE one, and thus we allow their relative normalization to be free in the fits. Furthermore, the BATSE spectrum is systematically slightly softer, by (where is the photon power law index), than the OSSE spectrum. We find that multiplying the BATSE model by an additional power law with that leads to a reduction of from 71/48 to 37/47, which is highly significant at the level, using the F-test (Bevington & Robinson 1992). Thus, we apply this correction, fixing hereafter at the best-fit value. The best-fit ratio of the BATSE and OSSE fluxes at 100 keV is then 1.26 (but higher and lower at higher energies and lower energies, respectively). Furthermore, we find that the COMPTEL data at MeV appear to have somewhat higher normalization than the BATSE and OSSE ones. The best-fit relative normalization is , consistent with results for the soft state (see below). Given the limited statistics of the COMPTEL hard-state data, we fix that relative normalization at 1.5. We note that this yields a conservative estimate of the amplitude of the nonthermal tail in Cygnus X-1.
The compps fit results are given in Table 2. They are similar to the preliminary results of McConnell et al. (2000a), who neglected Compton reflection. We note that the fitted electron distribution is allowed to be significantly different from a pure Maxwellian, with a power law tail beginning at a rather low energy. This reflects the fact that an arbitrary electron distribution peaked at low energies yields Comptonization spectra relatively similar to those from a pure Maxwellian (Ghisellini et al., 1993), apart from the high-energy tail in the former case.
We then fit the same data using a different hybrid Comptonization model, eqpair (Coppi, 1992, 1999; Poutanen & Coppi, 1998; Gierliński et al., 1999). Unlike compps, which assumed the form of the steady-state electron distribution, eqpair calculates that distribution self-consistently assuming instead the electron acceleration to be a power law with an index, between and . The accelaration takes place in a background thermal plasma with a Thomson optical depth of ionization electrons, . The steady-state electron distribution consists then of a Maxwellian at the temperature, , calculated from the balance of Compton and Coulomb gains and losses, and the optical depth, , with due to the pair production. The nonthermal steady-state electron distribution is calculated from Coulomb and Compton losses of both the accelerated electrons and pairs produced at nonthermal energies. That distribution, in general, does not have a power law form. Unlike compps, the electron distribution is now a sum of the Maxwellian and the nonthermal part (rather than being a Maxwellian up to and then nonthermal). We assume and . Unlike the case of compps, where the value of determined the transition from the Maxwellian to the power law, that value has relative little effect on the fit now.
The rates of microscopic processes per unit light travel time across the source depend in general on the plasma compactness, , where is a power supplied to the hot plasma, is its characteristic size, and is the Thomson cross section (e.g., Svensson 1987). We then define a hard compactness, , corresponding to the power supplied to the electrons, and a soft compactness, , corresponding to the power in soft seed photons irradiating the plasma (which are assumed to be emitted by a blackbody disk). The compactnesses corresponding to the electron acceleration and to a direct plasma heating (i.e., in addition to Coulomb energy exchange with nonthermal and Compton heating) of the thermal are denoted as and , respectively, and . Details of the model are given in Gierliński et al. (1999).
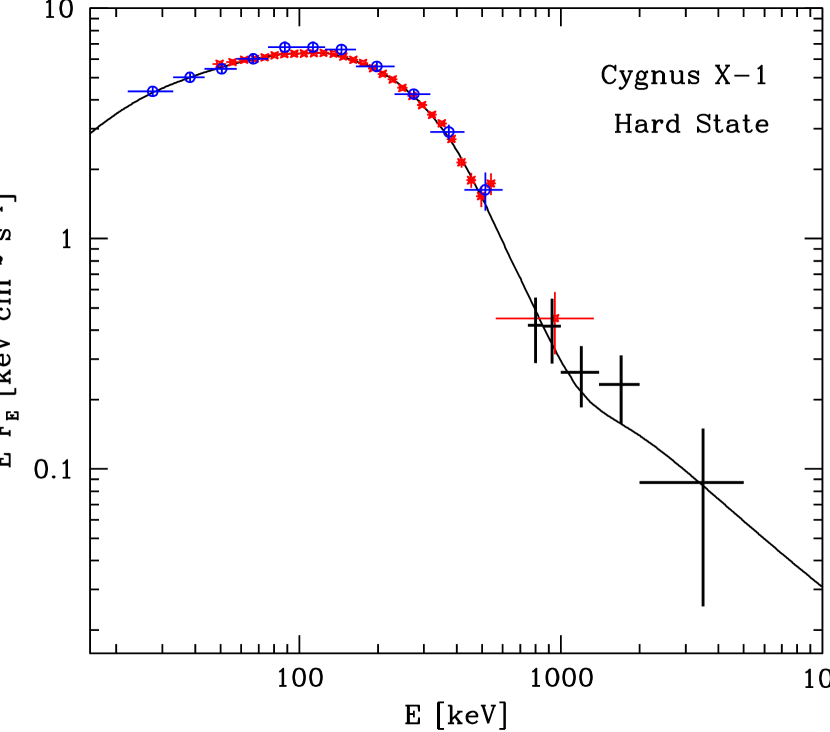
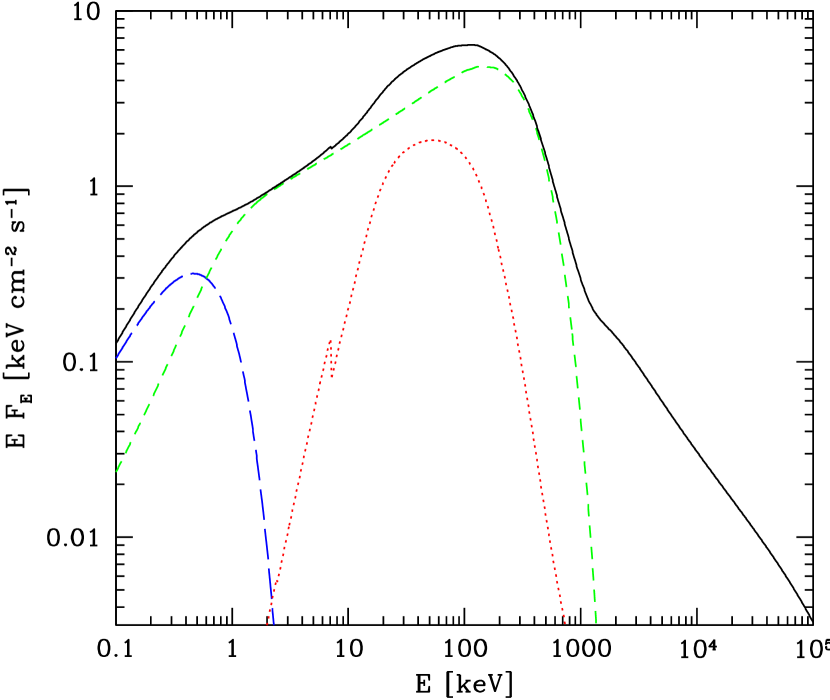
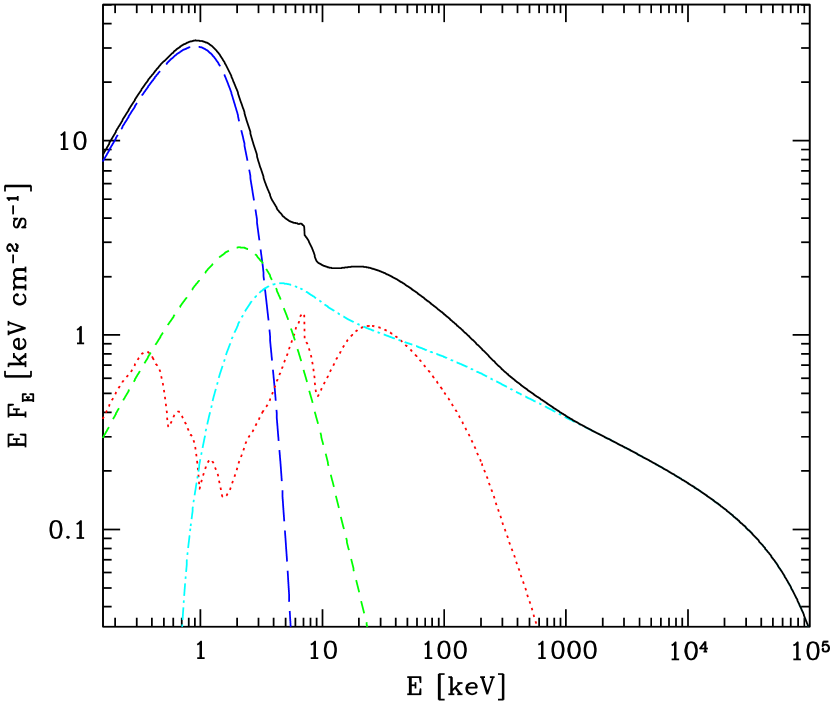
The eqpair fit results are given in Table 2. Figure 5 shows the spectrum. Figure 6 shows the model spectral components over the broad energy range from 0.1 keV to 100 MeV. The nonthermal high-energy tail starts at MeV.
The bolometric flux derived from the eqpair model is very similar to that in the compps model. Some differences between the values of and may be attributed to the different treatment of the microphysics (see above). Also, the eqpair model gives a somewhat better fit to the data than the compps model. In addition, the eqpair model provides a better constraint on the value of (Table 2). The better fit most likely reflects the fact that more physical processes are accounted for by eqpair than by compps.
In particular, pair production is important at the best fit of the eqpair model, which accounts for in Table 2, and the associated injection of nonthermal at low energies. The latter effect leads to a softening of the nonthermal spectra (Svensson 1987) and explains the relatively low value of (without pair production and in the Thomson regime, would be , e.g., Blumenthal & Gould 1970). On the other hand, at the lowest allowed by the data, , the plasma compactness is so small that we find basically no pair production, i.e., . Thus, the present data do not resolve the issue of the role of pair production conclusively.
The bolometric luminosity of the average hard-state spectrum, , equals of the Eddington luminosity, erg s-1, assuming isotropy, a black-hole mass of and a distance of 2 kpc (see discussion and references in Gierliński et al. 1999). The best-fit total compactness, , corresponds to the characteristic dimension of the plasma of under the assumptions as above. The X-ray spectrum is rather hard, with the amplification of the seed photons by the factor . Only a small fraction of the power supplied to the plasma, , is used for nonthermal electron acceleration.
3.2 Broad-Band Spectrum in the Soft (High) State
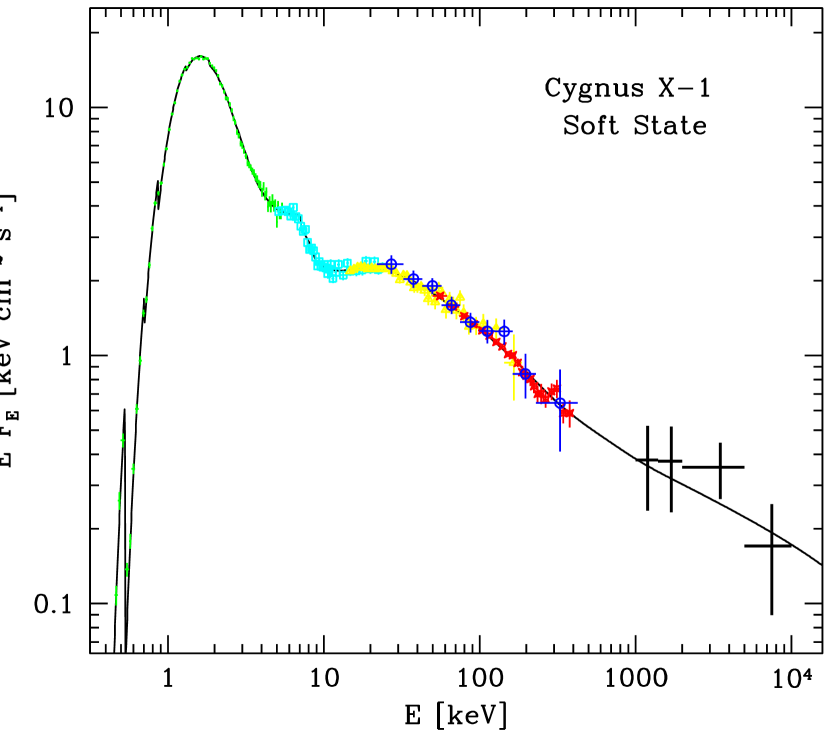
As in the case of the hard state, the broad-band spectrum of Cygnus X-1 in the soft state is well fit by emission from a blackbody disk, Compton scattering by thermal and nonthermal electron components, and Compton reflection with the accompanying Fe K fluorescence line (Gierliński et al., 1999; Frontera et al., 2001). However, unlike the hard state, the CGRO data alone ( keV) cannot determine the parameters of the thermal electron distribution. The reason for this is that, whereas scattering by the thermal electrons dominates up to several hundred keV in the hard state (see above, also Gierliński et al. 1997), it dominates only up to keV in the soft state (Gierliński et al., 1999, see below). Then, in the CGRO energy range, the spectrum is entirely due to the emission of the nonthermal electrons and Compton reflection.
Thus, in order to determine the parameters of the electron distribution (including its thermal part) implied by the CGRO data in the soft state, we combine them with the BeppoSAX data from 1996 June 22 (Frontera et al., 2001). These data cover roughly a 90 minute time span during the much longer 11-day CGRO observation (June 14–25). For the BeppoSAX observation, data from three instruments, LECS, HPGSPC and PDS, are usable (Frontera et al., 2001), extending the measured energy range down to 0.5 keV. We allow for a free relative normalization of each set of spectral data with respect to that of OSSE. All the normalization factors are found to be .
We use the same two models (compps and eqpair) as for the hard state. However, since our data extend now down to keV, we let free. For the same reason, we need to include the fluorescent Fe K emission, present in both states of Cygnus X-1. Since the line is produced by Compton reflection, we need to relate its flux to the strength of Compton reflection. We follow here results of George & Fabian (1991) and Życki & Czerny (1994) and tie the line flux to in such a way that the equivalent width with respect to the total continuum is eV when . Both the line and the reflection continuum are assumed to come from an accretion disk extending down to (e.g., Gierliński et al., 1999) and with the reflection/fluorescence emissivity following that of a standard thin disk (Shakura & Sunyaev 1973). This results in a relativistic smearing (Fabian et al. 1989) of both of those spectral components. The reflecting surface is allowed to be ionized (Gierliński et al., 1999; Di Salvo et al., 2001), with the degree of ionization characterized by the ionization parameter, (where is the ionizing flux and is the reflector density), and at the temperature of . The elemental abundances are of Anders & Ebihara (1982).
Both compps and eqpair models provide very good descriptions of our broad-band spectrum. Table 2 gives the fit results and Figure 7 shows the spectrum for the eqpair model. Figure 8 shows the spectral components of the eqpair fit to the spectrum. Both models predict the power-law–like emission extending with no cutoff up to 10 MeV, in agreement with the data.
Strong Compton reflection with is seen, similar to the results of Frontera et al. (2001) and those from RXTE (Gilfanov et al. 1999). A likely cause of is relativistic anisotropy of Compton scattering (see a discussion in Gierliński et al., 1999). Scattering by nonthermal electrons, forming a power-law like component, dominates a peaked component from thermal scattering at energies above several keV (as found by Gierliński et al., 1999).
Pair production is unimportant at the best fit. Thus, both models give results fully consistent with each other. The values of are virtually identical, and the small difference in the values of is an artifact of the different treatment of the radiative transfer, and (as expected for dominant Compton cooling in the Thomson regime, see §3.1).
The bolometric luminosity is about 4 times that in the hard state, and it is under the same assumptions as in §3.1. In contrast to the hard state, only a small fraction of the total luminosity, , is emitted by the plasma outside the optically-thick accretion disk, although part of the disk emission is due to reprocessing of the hard, plasma, emission (see discussion of the energy balance in Gierliński et al., 1999). Also in contrast to the hard state, most, , of the power supplied to the plasma is used for nonthermal acceleration. Although the electron temperature is very similar in both states, the optical depth in the soft state is that in the hard state.
4 Discussion
The COMPTEL data alone can be used to draw some important conclusions regarding the MeV variability of Cyg X-1. Most importantly, the flux measured by COMPTEL at energies above 1 MeV was observed to be higher (by a factor of 2.5) during the soft state (in May of 1996) than it was during the hard state (as averged over several CGRO observations). This is in contrast to the lower flux level observed at hard X-ray energies (i.e., near 100 keV) during the soft state. The lack of any detectable emission by COMPTEL below 1 MeV (i.e., in the 750 keV to 1 MeV energy band) further suggests a hardening of the -ray spectrum during the soft state.
Inclusion of the BATSE and OSSE spectra adds considerably more information regarding the spectral variability. Whereas the low-state CGRO spectrum shows the breaking type spectrum that is typical of most high-energy observations of Cyg X-1 (e.g., McConnell et al., 2000a), the high-state CGRO spectrum shows the power-law type spectrum that is characteristic of black hole candidates in their high X-ray state. Our analysis of the soft state data from BATSE, OSSE and COMPTEL shows that the spectrum at these energies can be described by a single power-law with a best-fit photon spectral index of . A similar spectrum had already been reported for this same time period (VP 522.5) based on independent studies with data from both BATSE (Zhang et al., 1997) and OSSE (Gierliński et al., 1997, 1999). A detailed study of the broadband soft state spectrum, based on data from ASCA, RXTE and CGRO/OSSE, was reported by Gierliński et al. (1999), but they did not include the higher energy COMPTEL data. The inclusion of the COMPTEL data in the high state spectrum provides evidence, for the first time, of a continuous power-law (with a photon spectral index of 2.6) extending beyond 1 MeV, up to MeV. No clear evidence for a cutoff in the power-law spectrum can be discerned from these data.
A power-law spectrum had also been observed by both OSSE and BATSE during the high X-ray state of February, 1994 (CGRO VP 318.1; Phlips et al., 1996; Ling et al., 1997). These earlier data correspond to the low level of hard X-ray flux near TJD 9400 in Figure 1. The spectrum observed during the 1994 high state showed a similar photon spectral index ( vs. for the 1996 high state spectrum), but the overall intensity of the power law was considerably lower (Gierliński et al., 1999). Near 1 MeV, for example, the spectral amplitude was about 3 times lower in 1994 than it was in 1996. This explains why Cygnus X-1 was not observed by COMPTEL during the 1994 high state. The extrapolation of the lower-intensity power-law fell below the sensitivity limit of COMPTEL. On the other hand, the intensity observed in 1996 was sufficiently high to allow for a measurement of the spectrum by COMPTEL.
We have used two different hybrid thermal/non-thermal Comptonization models (compps and eqpair) to fit broad band spectral data obtained in both the hard and soft spectral states. For the hard state analysis, we used data from CGRO covering 20 keV up to 10 MeV. For the soft state analysis, we augmented the CGRO data with lower energy data from BeppoSAX to provide improved constraints on the spectrum at energies down to 0.5 keV. These fits provide a quantitative estimate of the electron distribution and allow us to probe the physical changes that take place during transitions between the low and high X-ray states. Hybrid Comptonization models have also been used to model the spectra of other black hole binaries in their soft state, such as GRS 1915+105 (Zdziarski et al., 2001).
The high energy spectrum of Cygnus X-1 cannot be described by the bulk-motion Comptonization model alone, which predicts a sharp cutoff above keV (Laurent & Titarchuk 1999). The hybrid comptonization models provide an adequate fit to the data without requiring any contribution from bulk-motion Comptonization. Furthermore, the bulk-motion Comptonization power-law for corresponding to the soft state of Cygnus X-1 (see below), was found by Laurent & Titarchuk (1999) to be very soft, with at , i.e., much softer than the observed (Gierliński et al., 1999; Frontera et al., 2001). (See also the discussion in Zdziarski 2000.) Note that the XSPEC model of bulk-motion Comptonization, bmc (Shrader & Titarchuk 1998), does not include any high-energy cutoff and thus cannot be applied to our data (or any data extending to keV).
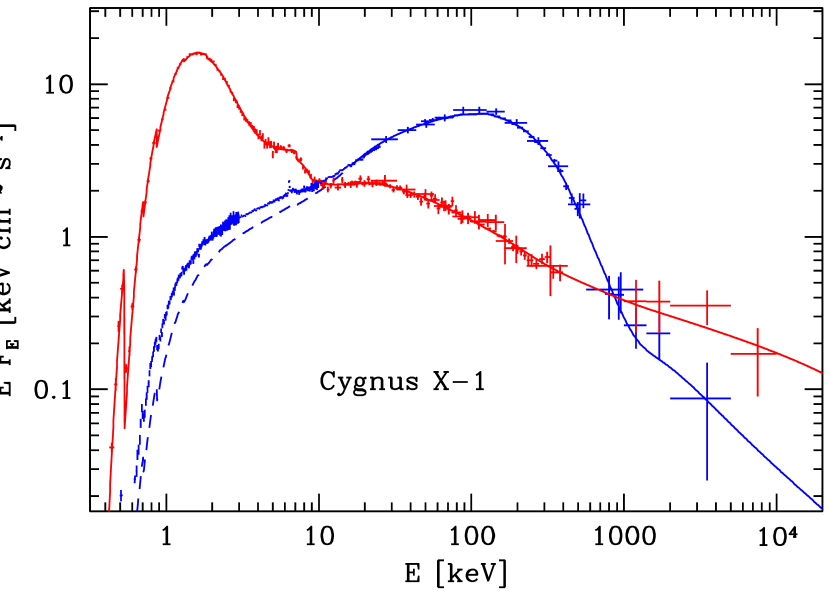
Figure 9 shows a comparison of the spectra in the two states. For the hard state, we also show a typical spectrum at energies keV (BeppoSAX data from Di Salvo et al., 2001). We see that the two broad-band spectra cross each other at keV and MeV. The dashed curve shows the model obtained by fitting the hard-state data from CGRO only (§3.1), and assuming cm-2. We see that this model predicts the low-energy BeppoSAX data relatively well, underestimating somewhat the observed spectrum only at keV due to the presence of a pronounced soft X-ray excess present in the hard state (Ebisawa et al., 1996a; Frontera et al., 2001; Di Salvo et al., 2001), which is neglected in our model fitted to the data at keV.
The bolometric flux or luminosity ratio between the soft state in June 1996 and the average for the hard state is . This value is much more than the rough estimate of based on the ASM and BATSE occultation results (Zhang et al., 1997), but is consistent with the results of Frontera et al. (2001), based on studies with BeppoSAX. Such a large value makes models of the state transition based on a change of accretion rate plausible. Given the larger luminosity in the soft state, the characteristic dimension of the hot plasma in the soft state based on the compactness fit is similar to that in the hard state, .
These data tend to support the general picture that the transition between the hard and soft states results from a change in the disk transition radius between a hot inner corona (ADAF) and a cooler outer thin disk (e.g., Esin et al., 1998; Narayan et al., 1998; Poutanen, 1998a, b; Poutanen & Coppi, 1998). In the hard state, this transition radius is relatively far from the black hole (at Schwarzschild radii). The spectrum is dominated by Comptonization off the thermal electrons in the hot inner corona. Radio emission is also more pronounced in this state (Fender, 2001), with evidence for a radio emitting relativistic jet (Stirling et al., 2001). As the transition radius moves inward, perhaps due to an increase in the accretion rate, the optically thick cool disk intercepts a larger fraction of the energy. The thermal energy dissipation in the corona is reduced considerably and the blackbody disk component (the principal component at soft X-ray energies) becomes more pronounced.
Although our data tend to support the above picture, we have not attempted to model the geometry in detail, since the precise geometrical configuration of the emitting region is largely unknown. Furthermore, our new data cover the energy range near 1 MeV where geometry effects are difficult to study. One of the primary goals of the present paper is to determine the electron distribution of the radiating plasma. Our assumption of a spherical source geometry provides the necessary physics that is required to extract information on the electron spectrum. We have further presumed that the thermal and nonthermal electrons are in the same physical region. This assumption is based, in part, on the observations that show a negative correlation between the thermal and nonthermal components. This need not be the case in reality, however, but the present data cannot be used to determine the extent to which the two populations are co-located. A more detailed discussion of geometrical effects in the context of the eqpair model, including Compton reflection and energy balance, can be found in Gierliński et al. (1999).
The shape of the electron distribution and its high energy tail can best be determined by measurements that extend into the MeV energy region. The high-energy cutoff is related to the compactness of the source region, since it depends, in part, on the influence of pair production. If pair production is an important source of opacity, this would imply the presence of a significant level of pairs in the source region. In this way, a measure of the high-energy cutoff can help determine the nature of the emitting plasma ( or ). Although a measure of annihilation radiation can also serve as a diagnostic of a pair plasma, it is likely that any annihilation radiation that may be present would be considerably broadened (and perhaps blue-shifted), and hence may not be readily observable. Measurements to date with HEAO-3 (Ling & Wheaton, 1989) and with OSSE (Phlips et al., 1996) provide only upper limits, or, at best, a marginal () detection (Ling & Wheaton, 1989) to the level of annihilation radiation. This further underscores the need to define the high-energy cutoff as perhaps the best means for constraining the source compactness and the nature of the emitting region. If INTEGRAL, with its improved line sensitivity, succeeds in measuring an annihilation feature, then constraints on the high-energy cutoff will be even more valuable.
The presence of a non-thermal tail in the electron distribution can also provide constraints on the strength of the magnetic field in the source region. As pointed out by Wardziński & Zdziarski (2001), the presence of even a weak nonthermal electron tail increases strongly the emissivity of the cyclo-synchrotron process with respect to the pure thermal case. If the Compton-scattering electrons in Cygnus X-1 were purely thermal, that process appears in general to be too inefficient to provide all of seed photons for the Comptonization under simple assumptions of equipartition (Wardziński & Zdziarski 2000). Since we do see a blackbody component at low energies (Ebisawa et al., 1996a; Di Salvo et al., 2001), this inefficiency is consistent with the seed photons for Comptonization provided by the blackbody rather than by the cyclo-synchrotron photons. On the other hand, the tail parameters obtained by McConnell et al. (2000a) yielded such a copious supply of cyclo-synchrotron seed photons that the corresponding luminosity would become times that observed (Wardziński & Zdziarski 2001). This conclusion is confirmed for the tail parameters fitted here (G. Wardziński, private communication). Thus, either the magnetic field in Cygnus X-1 is substantially below equipartition (at least an order of magnitude) or the observed photon tail has a different origin than that due to a high energy electrons. In either case, this has important implications for models of the accretion flow in Cygnus X-1.
These studies also have implications that go beyond that of studying individual black hole sources. Given the close spectral similarity between black-hole binaries in the hard state and Seyferts (e.g., Zdziarski 2000), it is possible that similar tails are present in the spectra of the latter objects. Stecker et al. (1999) have suggested that the hard tail emission seen in sources like Cygnus X-1 might account for an important component of the cosmic diffuse background radiation in the 200 keV – 3 MeV energy band (see also Stecker, 2001). Note, however, that the tail of Cygnus X-1 above 1 MeV contains relatively little flux, 1.3% of the bolometric (model) flux, for the fit with eqpair. If a similar value is characteristic of Seyferts, the combined emission from their high energy tails may be too weak to account for the observed extragalactic MeV background, perhaps arguing against the proposal by Stecker et al. (1999).
The next major satellite for this energy range, INTEGRAL, is expected to have only slightly better continuum sensitivity than COMPTEL at energies near 1 MeV with both its IBIS and SPI experiments (Schönfelder et al., 2001). Furthermore, the much narrower FoV of the INTEGRAL instruments () will mean that there will likely be only a limited number of observations of Cygnus X-1. This is in stark contrast to the COMPTEL situation, in which the large FoV of COMPTEL () resulted in many weeks of exposure, most of which were obtained during the low X-ray state. Given the large low-state exposure of CGRO, it is quite likely that INTEGRAL may not be able to offer any significant improvement in our knowledge of the hard state continuum spectrum at MeV energies. The CGRO data may therefore provide the best view of the hard state MeV continuum for many years to come. However, COMPTEL is very limited in the data that it collected for the soft state spectrum. Additional soft state observations with INTEGRAL could therefore prove valuable. An important goal would be to search for a cutoff in the energy spectrum. Pinning down the energy of this cutoff would be a very important next step in our understanding of the high energy spectrum of Cygnus X-1. In this regard, INTEGRAL may be an extremely useful tool for collecting additional soft state spectral data, providing that suitable target-of-opportunity observations can be acquired.
References
- Anders & Ebihara (1982) Anders, E., & Ebihara, M. 1982, Geochim. Cosmochim. Acta, 46, 2363
- Arnaud (1996) Arnaud, K. A. 1996, in ASP Conf. Series 101, Astronomical Data Analysis Software and Systems V, ed. G. H. Jacoby & J. Barnes (San Francisco: ASP), 17
- Bevington & Robinson (1992) Bevington, P. R., & Robinson, K. D. 1992, Data Reduction and Error Analysis for the Physical Sciences (New York: McGraw-Hill), 2nd Ed.
- Blumenthal & Gould (1970) Blumenthal, G. R., & Gould, R. J. 1970, Rev. Mod. Phys., 42, 237
- Chakrabarti & Titarchuk (1995) Chakrabarti, S. K., & Titarchuk, L. G. 1995, ApJ, 455, 623
- Crider et al. (1997) Crider, A., Liang, E. P., Smith, I. A., Lin, D., & Kusnose, M. 1997, in AIP Conf. Proc. 410, Proceedings of the Fourth Compton Symposium, ed. C. D. Dermer, M. S. Strickman, & J.D. Kurfess (New York: AIP), p. 868
- Coppi (1992) Coppi, P. S. 1992, MNRAS, 258, 657
- Coppi (1999) Coppi, P. S. 1999, in ASP Conf. Ser. 161, High Energy Processes in Accreting Black Holes, ed. J. Poutanen & R. Svensson (San Francisco: ASP), p. 375
- Cui (1997) Cui, W. et al. 1997, ApJ, 474, L57
- Dahlbacka et al. (1974) Dahlbacka, G. H., Chapline, G. F., & Weaver, T. A. 1974, Nature, 250, 36
- Dermer & Liang (1989) Dermer, C. D., & Liang, E. P. 1989, ApJ, 339, 512
- Dermer et al. (1996) Dermer, C. D., Miller, J. A., & Li H. 1996, ApJ, 456, 106.
- Di Salvo et al. (2001) Di Salvo, T., Done, C., Życki, P. T., Burderi, L., & Robba, N. R. 2001, ApJ, 547, 1024
- Ebisawa et al. (1996a) Ebisawa, K., Ueda, Y., Inoue, H., Tanaka, Y., & White, N. E. 1996a, ApJ, 467, 419
- Ebisawa et al. (1996b) Ebisawa, K., Titarchuk, L., Chakrabarti, S. K. 1996b, PASJ, 48, 59
- Eilik (1980) Eilik, J. 1980, ApJ, 236, 664
- Eilik & Kafatos (1983) Eilik, J., & Kafatos, M. 1983, ApJ, 271, 804
- Esin et al. (1998) Esin, A. A., Narayan, R., Cui, W., Grove, J. E., & Zhang, S.-N. 1998, ApJ, 505, 854
- Fabian et al. (1989) Fabian, A. C., Rees, M. J., Stella, L., & White, N. E. 1989, MNRAS, 238, 729
- Fender (2001) Fender, R. P. 2001, MNRAS, 322, 31.
- Frontera et al. (2001) Frontera, F., et al. 2001, ApJ, 546, 1027
- George & Fabian (1991) George, I. M., & Fabian, A. C. 1991, MNRAS, 249, 352
- Ghisellini et al. (1993) Ghisellini, G., Haardt, F., & Fabian, A.C. 1993, MNRAS, 263, L9
- Gierliński et al. (1997) Gierliński, M., Zdziarski, A. A., Done, C., Johnson, W. N., Ebisawa, K., Ueda, Y., Haardt, F., & Phlips, B. F. 1997, MNRAS, 288, 958
- Gierliński et al. (1999) Gierliński, M., Zdziarski, A.A., Poutanen, J., Coppi, P.S., Ebisawa, K. & Johnson, W.N., 1999, MNRAS, 309, 496
- Gilfanov et al. (1999) Gilfanov, M., Churazov, E., & Revnivtsev, M. 1999, A&A, 352, 182
- Grove (1999) Grove, J. E., 1999, in ASP Conf. Ser. 161, High Energy Processes in Accreting Black Holes, ed. J. Poutanen & R. Svensson (San Francisco: ASP), p. 54
- Grove et al. (1997) Grove, J.E. et al., 1997, in AIP Conf. Proc. 410, Proceedings of the Fourth Compton Symposium, ed. C.D. Dermer, M.S. Strickman, and J.D. Kurfess (New York: AIP), p. 122
- Grove et al. (1998) Grove, J. E., Johnson, W. N., Kroeger, R. A., McNaron-Brown, K., Skibo, J. G., & Phlips, B. F. 1998, ApJ, 500, 899
- Harmon et al. (2002) Harmon, B. A., et al. 2002, ApJS, 138, 149
- Johnson et al. (1993) Johnson, W. N., et al. 1993, ApJS, 86, 693
- Jordain & Roques (1994) Jourdain, E., & Roques, J. P. 1994, ApJ, 426, L11
- Kitamoto et al. (2000) Kitamoto, S., Egoshi, W., Miyamoto, S., Tsunemi, H., Ling, J. C., Wheaton, W. A., & Paul, B. 2000, ApJ, 531, 546
- Kuiper et al. (1998) Kuiper, L., Hermsen, W., Bennett, K., Carramiñana, A., McConnell, M., & Schönfelder, V. 1998, A&A, 337, 421
- Laurent & Titarchuk (1999) Laurent, P., & Titarchuk, L. 1999, ApJ, 511, 289
- Li & Miller (1997) Li, H., & Miller, J. A. 1997, ApJ, 478, L67
- Li et al. (1996) Li, H., Kusunose, M., & Liang, E. P. 1996, ApJ, 460, L29
- Liang (1998) Liang, E. P. 1998, Phys. Rep., 302, 67
- Liang & Nolan (1983) Liang, E. P., & Nolan, P. L. 1983, Space Sci. Rev., 38, 353
- Ling et al. (1983) Ling, J. C., Mahoney, W. A., Wheaton, W. A., Jacobsen, A. S., & Kaluzienski, L. 1983, ApJ, 275, 307
- Ling et al. (1987) Ling, J. C., Mahoney, W. A., Wheaton, W. A., & Jacobsen, A. S., 1987, ApJ, 321, L117
- Ling & Wheaton (1989) Ling, J. C., & Wheaton, W. A. 1989, ApJ, 343, L57
- Ling et al. (1996) Ling, J. C., Wheaton, W. A., Mahoney, W. A., Skelton, R. T., Radocinski, R. G., and Wallyn, P. 1996, A&AS, 120, C677
- Ling et al. (1997) Ling, J. C., et al. 1997, ApJ, 484, 375
- Ling et al. (2000) Ling, J. C., et al. 2000, ApJS, 127, 79
- Magdziarz & Zdziarski (1995) Magdziarz, P., & Zdziarski, A. A. 1995, MNRAS, 273, 837
- Mahadevan et al. (1997) Mahadevan, R., Narayan, R., & Krolik, J. 1997, ApJ, 486, 268
- McConnell et al. (1994) McConnell, M. L., et al. 1994, ApJ, 424, 933
- McConnell et al. (2000a) McConnell, M.L. et al. 2000a, ApJ, 543, 928
- McConnell et al. (2000b) McConnell, M. L. et al. 2000b, in AIP Conf. Proc. 510, The Fifth Compton Symposium, ed. M. L. McConnell & J. M. Ryan (New York: AIP), p. 114
- Narayan (1996) Narayan, R. 1996, ApJ, 462, 136
- Narayan et al. (1998) Narayan, R., Mahadevan, R. & Quataert, E. 1998, in Theory of Black Hole Accretion Disks, eds. M. A. Abramowicz, G. Björnsson & J. E. Pringle (Cambridge Univ. Press: New York), p. 148
- Phlips et al. (1996) Phlips, B., et al. 1996, ApJ, 465, 907
- Poutanen (1998a) Poutanen, J. 1998a, in Theory of Black Hole Accretion Disks, eds. M. A. Abramowicz, G. Björnsson & J. E. Pringle (Cambridge Univ. Press: New York), p. 100
- Poutanen (1998b) Poutanen, J. 1998b, in AIP Conf. Proc. 431, Accretion Processes in Astrophysical Systems: Some Like it Hot!, ed. S. Holt & S. Kallman (New York: AIP), p. 89
- Poutanen & Svensson (1996) Poutanen, J., & Svensson, R. 1996, ApJ, 470, 249
- Poutanen et al. (1997) Poutanen, J., Krolik, J. H., & Ryde, F. 1997, MNRAS, 292, L21
- Poutanen & Coppi (1998) Poutanen, J., & Coppi, P. 1998, Physica Scripta, T77, 57
- Priedhorsky et al. (1983) Priedhorsky, W. C., Terrell, J., & Holt, S. S. 1983, ApJ, 270, 233
- Schönfelder et al. (1993) Schönfelder, V., et al. 1993, ApJS, 86, 629
- Schönfelder et al. (2001) Schönfelder, V., 2001, in AIP Conf. Proc. 587, GAMMA 2001 - Gamma-Ray Astrophysics 2001, ed. S. R. Ritz, N. Gehrels & C. R. Shrader (New York: AIP), p. 809
- Shakura & Sunyaev (1973) Shakura, N. I., & Sunyaev, R. A. 1973, A&A, 24, 337
- Shapiro et al. (1976) Shapiro, S. L., Lightman, A. P., & Eardley, D. M. 1976, ApJ, 204, 187
- Shrader & Titarchuk (1998) Shrader, C., & Titarchuk, L. 1998, ApJ, 499, L31
- Stecker et al. (1999) Stecker, F. W., Salamon, M. H., & Done, C. 1999, astro-ph/9912106
- Stecker (2001) Stecker, F. W. 2001, in AIP Conf. Proc. 587, GAMMA 2001 - Gamma-Ray Astrophysics 2001, ed. S. R. Ritz, N. Gehrels & C. R. Shrader (New York: AIP), p. 432
- Stirling et al. (2001) Stirling, A. M., Spencer, R. E., de la Force, C. J., Garrett, M. A., Fender, R. P., & Ogley, R.N. 2001, MNRAS, 327, 1273
- Sunyaev & Titarchuk (1980) Sunyaev, R. A., & Titarchuk, L. G. 1980, A&A, 86, 121
- Svensson (1987) Svensson, R. 1987, MNRAS, 227, 403
- Titarchuk et al. (1997) Titarchuk, L., Mastichiadis, A., & Kylafas, N. D. 1997, ApJ, 487, 834
- Ubertini et al. (1991) Ubertini, P., et al. 1991, ApJ, 366, 544
- Wardziński & Zdziarski (2000) Wardziński, G., & Zdziarski, A. A. 2000, MNRAS, 314, 183
- Wardziński & Zdziarski (2001) Wardziński, G., & Zdziarski, A. 2001, MNRAS, 325, 963 (Erratum: 327, 351)
- Zdziarski (2000) Zdziarski, A. A. 2000, in IAU Symp. 195, Highly Energetic Physical Processes and Mechanisms for Emission from Astrophysical Plasmas, ed. P. C. H. Martens, S. Tsuruta & M. A. Weber (San Francisco: ASP), p. 153
- Zdziarski et al. (2001) Zdziarski, A. A., Grove, J. E., Poutanen, J., Rao, A. R., & Vadawale, S. V. 2001, ApJ, 554, L45
- Zhang et al. (1997) Zhang, S. N. et al. 1997, ApJ, 477, L95
- Życki & Czerny (1994) Życki, P. T., & Czerny, B. 1994, MNRAS, 266, 653


| Energy | Counts in | Source | Flux |
|---|---|---|---|
| (MeV) | Dataspace | Counts | (cm-2 s-1 MeV-1) |
| 0.75 – 1.0 | 33,066 | ||
| 1.0 – 1.4 | 88,086 | ||
| 1.4 – 2.0 | 107,010 | ||
| 2.0 – 5.0 | 157,457 | ||
| 5.0 – 10.0 | 30,158 | ||
| 10.0 – 30.0 | 7,967 |
| , | ||||||||||||||
|---|---|---|---|---|---|---|---|---|---|---|---|---|---|---|
| hard state, compps | ||||||||||||||
| 6f | 0.2f | – | – | – | – | 0.5f | – | 3.38 | 1.62 | 37/48 | ||||
| hard state, eqpair | ||||||||||||||
| 6f | 0.2f | 1.5f | 90aaThe electron temperature and total optical depth calculated from energy and pair balance for the best-fit model (i.e., not free parameters). | 1.45aaThe electron temperature and total optical depth calculated from energy and pair balance for the best-fit model (i.e., not free parameters). | – | 3.56 | 1.70 | 31/46 | ||||||
| soft state, compps | ||||||||||||||
| – | – | – | – | 13.1 | 6.3 | 199/239 | ||||||||
| soft state, eqpair | ||||||||||||||
| 1.5f | 65aaThe electron temperature and total optical depth calculated from energy and pair balance for the best-fit model (i.e., not free parameters). | 0.11aaThe electron temperature and total optical depth calculated from energy and pair balance for the best-fit model (i.e., not free parameters). | 13.2 | 6.3 | 199/238 | |||||||||
Note. — , , and are in units of cm-2, keV, and erg cm s-1, respectively. , the unabsorbed model bolometric flux using the normalization of the OSSE spectrum, and , the corresponding luminosity assuming isotropy and a distance of 2 kpc are in units of erg cm-2 s-1 and erg s-1, respectively. Parameters fixed in the fit are denoted by ‘f’. The single-parameter uncertainties correspond to a 90% confidence, i.e., .