The kinematics of lopsided galaxies
Abstract
Lopsidedness is a common feature in galaxies, both in the distribution of light and in the kinematics. We investigate the kinematics of a model for lopsided galaxies that consists of a disc lying off-centre in a dark halo, and circling around the halo centre. We search for families of stable, closed, non-crossing orbits, and assume that gas in our galaxies moves on these orbits. Several of our models show strong lopsided gas kinematics, especially the ones in which the disc spins around its axis in a retrograde sense compared to its motion around the halo centre. We are able to reproduce the Hi velocity map of the kinematically lopsided galaxy NGC 4395.
The lopsidedness in our models is most pronounced in the models where the halo provides a relatively large fraction of the total mass at small radii. This may explain why the gas shows lopsidedness more frequently in late-type galaxies, which are dominated by dark matter. Surfaces of section show large regions of irregular orbits in the models where the halo density is low. This may indicate that these models are unstable.
keywords:
galaxies: formation – galaxies: individual: NGC 4395 – galaxies: kinematics and dynamics – galaxies: structure – dark matter1 Introduction
It has been known for a long time that many disc galaxies are lopsided. Baldwin, Lynden-Bell & Sancisi [1980] were among the first to note that many galaxies show large-scale asymmetries in the optical images and the gas distributions. Richter & Sancisi [1994] examined a large sample of about 1700 global Hi-profiles, and concluded that at least 50% of all disc galaxies show significant asymmetries. This result has recently been confirmed by Haynes et al. [1998], who studied 104 Hi-profiles of spiral galaxies. Matthews, Van Driel & Gallagher [1998] studied Hi-profiles of 30 extreme late-type spiral galaxies. These authors found that about 75% of the galaxies in their sample have more or less asymmetric profiles, and inferred that lopsidedness is more common among these very late-type spirals.
Swaters [1999] studied a sample of 75 late-type galaxies in Hi and red light, finding a high incidence of lopsidedness in both the distribution of gas and its kinematics. Swaters et al. [1999] presented global profiles, rotation curves and velocity fields for two of these, DDO 9 and NGC 4395 (of type Im and Sm respectively), which are both kinematically lopsided, although neither has nearby companions. In these and other kinematically lopsided galaxies, the rotation curves level off at a constant velocity on one side of the galaxy, while they keep on rising on the other side. The contours of the velocity fields are more strongly curved on the side with the flat rotation curve, and the Hi-profile is asymmetric too.
Many galaxies are also lopsided in their light distribution. Rix & Zaritsky [1995, hereafter R&Z] studied K-band images of 18 disc galaxies and found that about one third of them were significantly lopsided. R&Z argue that lopsidedness should be more common in the Hi-distribution than in the stars, because of the longer dynamical timescales in the outer part of the disc. Zaritsky & Rix [1997] followed up with I-band imaging of a larger sample of 60 galaxies, finding of them to be lopsided. Rudnick & Rix [1998] explored earlier-type systems of type S0 to Sab, and found roughly 20% of lopsided disks.
The relation between lopsidedness in the distribution of starlight or gas and an asymmetric velocity field is not at all clear. NGC 891 shows a strongly lopsided gas distribution, with gas extending much further from the center on the southern than on the northern side. But up to the radius where the Hi stops on the northern side, the kinematics are almost perfectly symmetric with no obvious deviations from circular motion; beyond that, the rotation curve on the south side remains flat [1979, 1997, Fig. 2]. By contrast, both the stellar light and the Hi distribution in DDO 9 and NGC 4395 are fairly symmetric, but the velocity fields are quite lopsided [1999]. Kornreich et al. [2000, 2001] compare morphological and kinematical lopsidedness in two samples, each of nine spiral galaxies, and find little or no correlation between the different parameters they measured. In the latter paper, they state that ‘normal morphology is not an indicator of normal kinematics and, conversely, that perturbed kinematics do not necessarily manifest as perturbed optical morphology’. Swaters [1999] looked at the Hi-distribution and kinematics of 73 late-type dwarf galaxies, and found 19 galaxies with stronger kinematical than morphological asymmetries, 18 where the lopsidedness is stronger in the density, and 5 with comparable asymmetries in both (Chapter 3, Table A2).
The origin and persistence of lopsidedness in galaxies have not yet been explained in a satisfactory way. In both the radio and near-infrared surveys, the asymmetries affect large parts of the discs; they are not small, localized irregularities. The fact that so many galaxies, including isolated systems, are lopsided argues against transient effects. Lopsidedness may be a general and intrinsic feature of disc galaxies.
Baldwin et al. [1980] suggested a model in which the gas and stars of a lopsided disc move in an axisymmetric potential on a series of initially aligned elliptical orbits. Due to differential precession, this lopsidedness will wind up into a single leading spiral arm and slowly disappear. These authors estimate that the asymmetry in their model can persist for about 5 Gyr, but claim that this lifetime is too short to explain the observed frequency of lopsidedness in nature. Another drawback is that, since the orbiting gas conserves its angular momentum, the inferred rotation curve must be significantly higher on the ‘short’ side of the disk.
The only stellar-dynamical models of disc galaxies that develop strong lopsided asymmetries are models with many counter-rotating particles [1978, 1988, 1994]. However, counter-rotation is only rarely observed in disc galaxies (see e.g. Kuijken, Fisher & Merrifield 1996). Syer & Tremaine [1996] present fluid models for thin, scale-free, lopsided disks; their solutions are gravitationally self-consistent, and the distortion is stationary in inertial space. Galli et al. [2001] show that these configurations are secularly stable. In these disks, a lopsided surface density implies lopsided kinematics. Earn & Lynden-Bell [1996] reach a similar conclusion in their work on self-gravitating lopsided disks: the velocity field of a lopsided disk should itself be asymmetric. Such a model cannot account for the symmetric rotation curves of systems such as NGC 891.
Zaritsky & Rix [1997, hereafter Z&R] tried to explain lopsidedness as a result of recent accretion of small satellite galaxies on the parent galaxy. Using results of N-body simulations by Walker, Mihos & Hernquist [1996], Z&R conclude that lopsidedness can be caused by accretion of a satellite within the last 1 Gyr. Using this lifetime and the observed frequency of lopsidedness, they obtain an upper limit on the accretion rate. However, the accretion rate can be much lower if the lopsidedness is more persistent, or if there are other mechanisms responsible for it. In particular, R&Z point out that the winding problem is avoided if the potential of the galaxy is lopsided itself, with the gas and stars just responding; they do not address the question of how to get a lopsided potential in the first place.
Recently, attention has been drawn to models in which the dark halo accounts for an asymmetry in the overall galaxy potential. Weinberg and collaborators [1991, 1994, 2000] have shown that lopsided modes of oscillation in a spherical system may have very long decay times, so that asymmetries in the galactic halo can persist long after the original disturbance.
Jog [1997] showed that even a small lopsided perturbation of the galaxy halo can cause strong asymmetry in the density of disk gas, in a sense opposing the perturbation in the halo. Investigating the self-consistent response of the disk, Jog [1999] showed that the disk’s gravity indeed opposes the lopsidedness of the halo. As a result, the disk becomes strongly lopsided only in its outer parts, where the halo is dynamically dominant. However, Jog does not show model rotation curves.
Levine & Sparke [1998, hereafter L&S] presented a model to explain lopsidedness, with the disc lying off-centre in the dark halo and orbiting around its centre. This model has some aspects in common with that presented by de Vaucouleurs & Freeman [1973] for off-centre bars in galaxies such as the Large Magellanic Cloud. The N-body simulations by L&S showed that when the rotation of the disc is retrograde with respect to its motion around the centre of the halo, the disc can remain off-centre for many rotation periods. The retrograde disc appears to settle into a circular orbit close to the core radius of the halo, inside which the halo density is roughly constant; a prograde disc drifted slowly inward towards the centre of the halo.
This paper will explore particle orbits in the L&S model; we investigate the kinematics of gas moving in such a model galaxy. We explain our model potential in section 2. In section 3, we present surfaces of section, rotation curves, and velocity fields. We show that orbits in this model can account both for disks with a lopsided surface density but symmetric kinematics, and for objects like NGC 4395, in which the velocity field is more distorted than the surface density. We also explore the effects of changing the basic model parameters. In section 4 we present a discussion of our conclusions.
2 Kinematics of a lopsided model
L&S presented N-body simulations of a model for lopsided galaxies, consisting of a disc of particles rotating around the centre of a massive dark halo, represented by a fixed spherical potential. Here, we compute stable, closed, non-crossing periodic orbits in an analytical representation of the potential of this model. Assuming that the gas in the disc moves on those orbits, we find the resulting velocity-field and rotation curves. We expect the disc particles to follow paths that oscillate about these stable periodic orbits, and use surfaces of section to explore the regions of trapped orbits. Although L&S found that the retrograde-spinning disc remained off-centre in the halo longer than the prograde disc, we consider both cases.
2.1 A model for the gravitational potential
Our model consists of a flat disc and a spherical halo. We confine our attention to orbits in the plane of the disc. The disc is an axisymmetric Kuzmin-Toomre disc of mass , lying in the - plane. Its potential at distance from the disc centre in that plane is given by
| (1) |
where G is the gravitational constant, and the scale length of the disc. We define our units such that and . In the simulations of L&S, the disc was truncated at radius . Its total mass is then given by:
| (2) |
The halo is spherically symmetric and has a pseudo-isothermal form. The density at distance from its centre is given by
| (3) |
where is the central density and the core radius of the halo, the radius where the density falls to half the central value. The velocity of a circular orbit at radius in this halo is given by:
| (4) |
The circular velocity rises linearly in the centre, and approaches the asymptotic velocity at large radii:
| (5) |
The halo described by equation 3 has infinite mass, but L&S truncated the halo at . Its total mass is then given by:
| (6) |
We define our unit of mass such that the total mass in the truncated model (disc + halo) is unity. We define as the fraction of the total mass that is in the truncated disc (). The mass of the truncated halo is then . We also need to know the contribution from the halo to the mass in the inner regions of the disc. We define as the fraction of the total mass within a sphere of radius from the disc centre that belongs to the halo. While the halo as a whole is much more massive than the disc, the disc dominates within these inner parts.
For and a total mass of , our time unit corresponds to and our velocity unit to .
The halo is centered at the origin, while the disc centre is placed at a distance on the positive -axis. The combined potential in the - plane is then given by:
| (7) |
where is the halo potential. The halo is much more massive than the disc, so we let the whole system rotate around the origin at an angular velocity equal to the circular rotation velocity in the halo potential at the radius of the disc centre:
| (8) |
Now, we look for orbits that are closed in the corotating frame. Defining the angular momentum vector , the equation of motion in this frame is:
| (9) |
where the second and third term on the right side are the Coriolis and centrifugal forces respectively. The effective potential is defined as the sum of the gravitational potential and a ‘centrifugal potential’. Orbits in this system admit an isolating integral of motion, the Jacobi integral:
| (10) |
(see Binney & Tremaine 1987, section 3.3.2).
2.2 Finding orbits for gas flow
We assume that gas in our model moves in stable, closed and non-crossing orbits. The flow is then smooth and laminar, without major shock fronts. We used the method of surfaces of section to find closed orbits (see e.g. Binney & Tremaine 1987, sections 3.2 to 3.5). For a range of values of , we integrated orbits with different initial conditions, such that we probe the entire phase-space. Each time the orbit crosses the -axis with , we mark its -coordinate and -velocity in an -diagram. The simple closed orbits that we seek always cross the -axis at the same point, with the same velocity; they will appear in the diagram as single points.
We then check if the orbits are stable, using a method first proposed by Hénon [1965]. Also, we check that orbits do not cross each other. We can then imagine filling with gas all the stable orbits that do not cross each other, to make a model velocity field or a rotation curve. Gas would not generally be found on unstable orbits or orbits that cross each other, so we ignored those orbits. However, stars could still be trapped around stable crossing orbits.
For the integrations, we used a variable-order, variable-step Adams method, implemented in Fortran77. This method maintains high accuracy during the long integrations needed to make the surfaces of section. We made use of subroutines from the NAG-library, using double precision variables, and a tolerance of ; a smaller tolerance slowed down the calculations and did not improve the accuracy of the integrations.
3 Model rotation curves and velocity fields
The parameters of our seven models are given in table 1. The disc scale length is 1 by definition, and the disc and halo truncation radii and are 10 and 20 respectively.
| Model | |||||||
|---|---|---|---|---|---|---|---|
| A | 0.092 | 1 | 2 | 2.5 | 10 | 20 | 19% |
| B | 0.092 | 1 | 2 | 1.5 | 10 | 20 | 25% |
| C | 0.092 | 1 | 2 | 5 | 10 | 20 | 8% |
| D | 0.186 | 1 | 2 | 2.5 | 10 | 20 | 9% |
| E | 0.046 | 1 | 2 | 2.5 | 10 | 20 | 33% |
| F | 0.092 | 1 | 1 | 1.5 | 10 | 20 | 37% |
| G | 0.092 | 1 | 4 | 4 | 10 | 20 | 8% |
For all models, we consider both orbits that circulate the disc centre in a prograde and retrograde sense with respect to the disc’s motion around the halo centre.
3.1 The starting model
Model A was inspired by one of the most successful runs in L&S. They found that a retrograde spinning disc sank towards the halo centre until the most tightly-bound particles of the disc orbited at a radius close to the halo core radius. We chose , and , so that the disc centre lies just outside the halo core. The halo contributes 19% of the total mass within a distance from the disc centre. Fig. 1 shows a contour-plot of the effective potential in the co-rotating coordinates.

In the region near , the potential is clearly dominated by the disc.
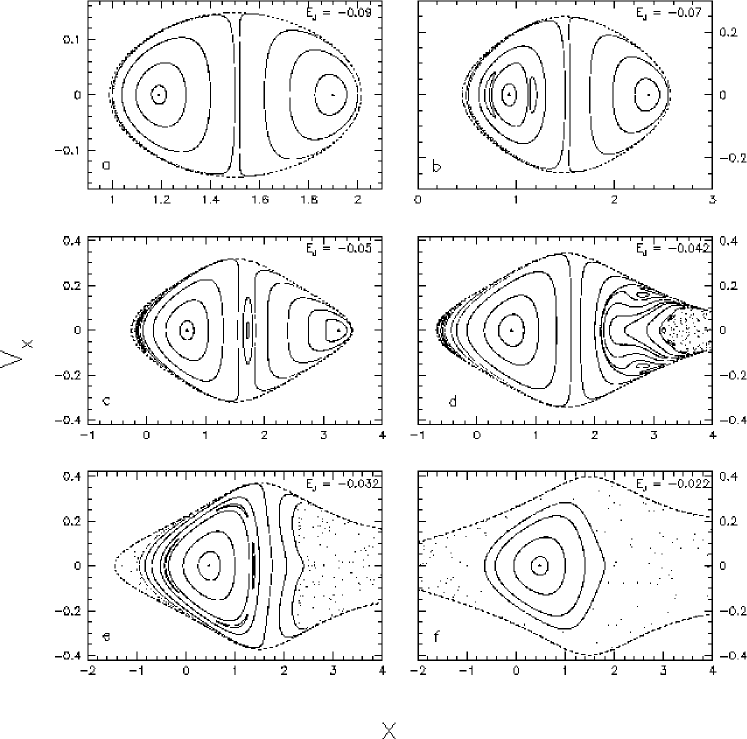
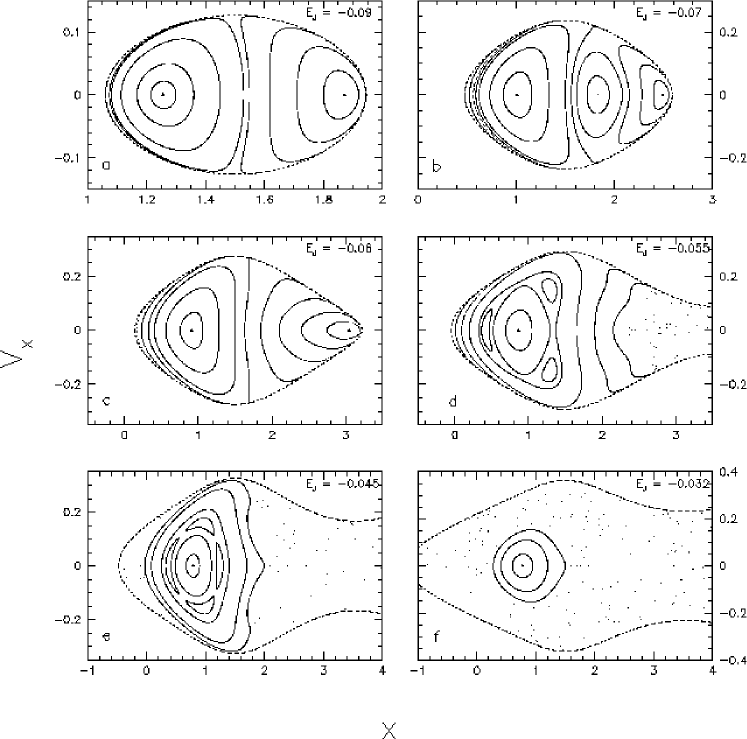
When the Jacobi integral is low, the surfaces of section in Fig. 2 show two simple closed orbits.
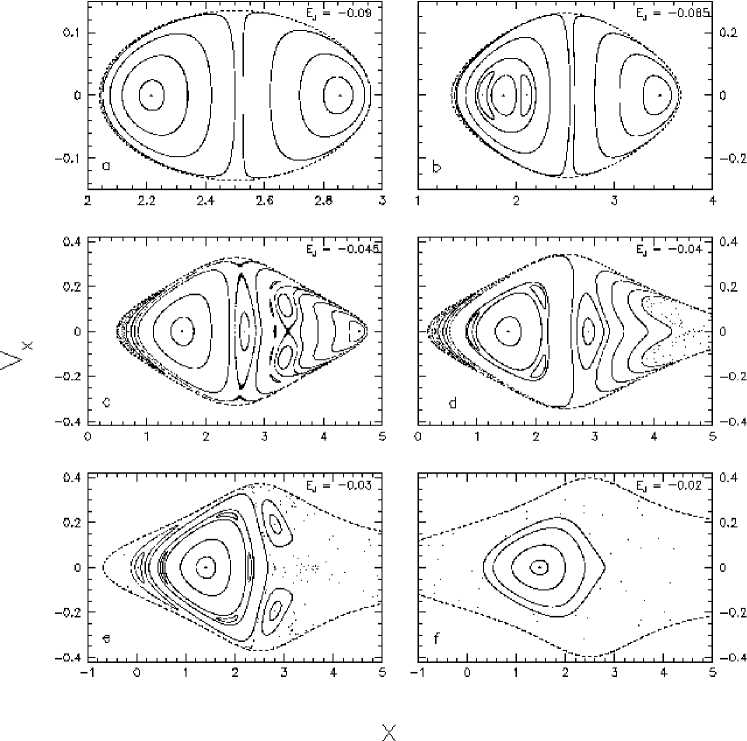
One crosses the -axis at , and circles the disc centre in a prograde sense with respect to the motion of the disc around the halo centre. The other is a retrograde orbit, and crosses the -axis at . Both these orbits are stable and surrounded by a family of non-closed but regular orbits. Those appear as the concentric curves, nested around the closed orbits.
As the Jacobi integral is increased, most of the retrograde orbits remain regular, and regular orbits trapped about the simple closed orbit continue to occupy a large area to the left. There are some ‘islands’ of orbits that close after multiple circuits; see for example in panel b, near and , an orbit that closes after two circuits. These do not occupy a large region in phase space. The structure of the prograde orbits becomes quite complicated. We see many small ‘islands’ of multi-periodic orbits and we also find irregular or chaotic orbits; they fill a two-dimensional area in the diagrams and produce ‘fuzzy’ regions such as that to the right of in panel d. For , the closed prograde orbit has shifted all the way to the edge of the surface of section; for and higher, there is no closed, simply-periodic prograde orbit at all.
When , the zero velocity curve is not closed, so orbits are no longer bound to the disc and particles could in principle escape from the system. But regular retrograde orbits keep occupying a substantial region of phase space, until the Jacobi integral rises slightly above , when no regular orbits exist in the disc anymore. This helps to explain why the retrograde-spinning disc could remain stable in an orbit just outside the halo core in the simulations of L&S; even at high values of , many regular orbits trapped around the closed periodic orbits were available to the simulation particles. In the prograde disc, although closed orbits persist to larger radii than in the retrograde case (see Fig. 3), even at (panel c) only a small part of the phase space is occupied by orbits trapped around them. Thus it would be much more difficult to populate the prograde disc self-consistently with simulation particles.
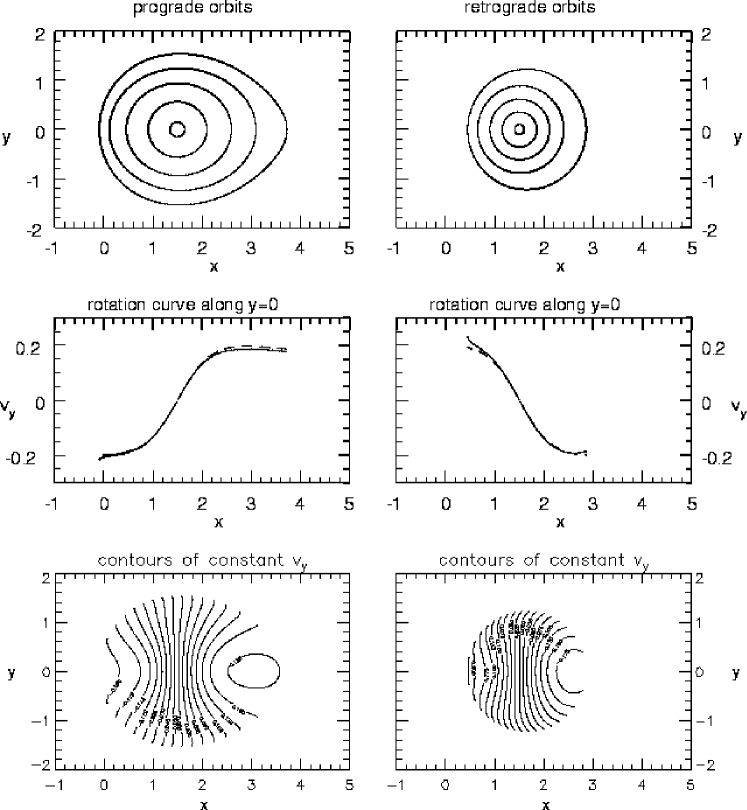
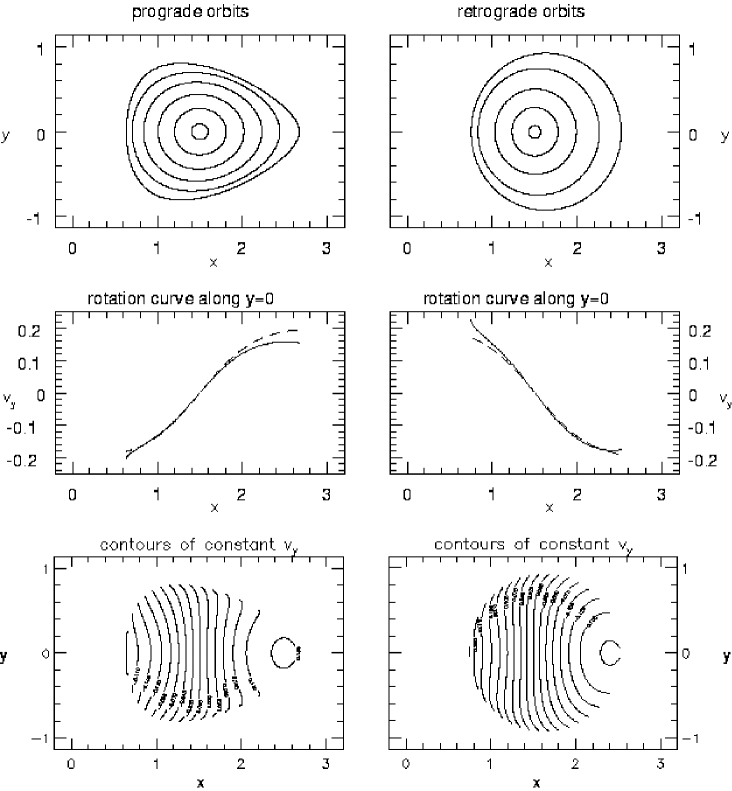
In the top panels in Fig. 3, we show the families of stable simply-closed orbits, both prograde and retrograde, as seen in the frame corotating with the disc, out to the radius where the closed orbits begin to cross each other.
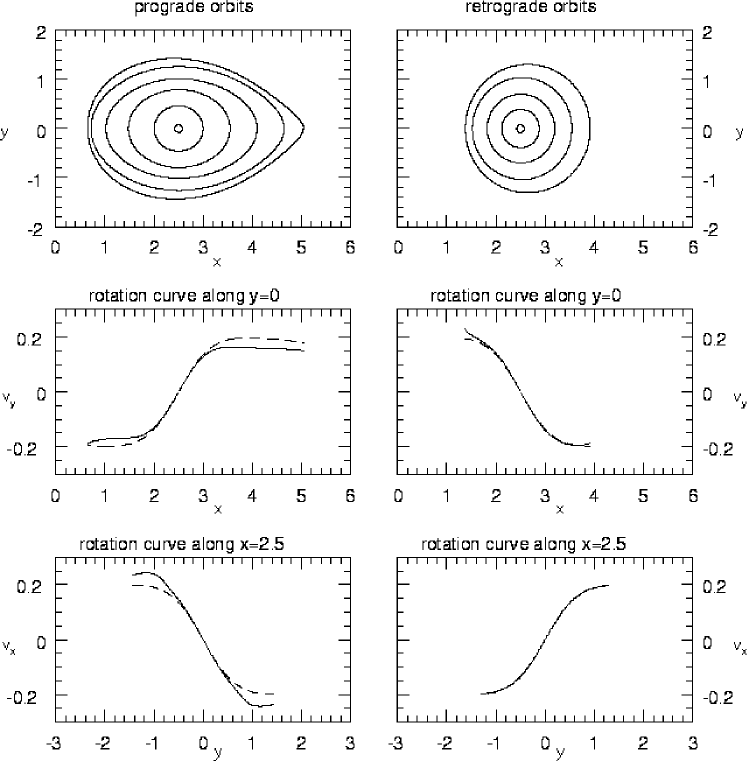
Near the disc centre, where the potential of the system is dominated by the axisymmetric potential of the disc itself, the orbits are nearly circular. At larger radii, the prograde orbits become elongated in the -direction. The retrograde orbits remain quite circular, but the geometric centre shifts to larger -values, away from the halo centre.
In the middle panels, we plot the rotation curves along the -axis, as they would be measured by an inertial observer, relative to the velocity of the centre of the disc. The dashed curves correspond to circular orbits in the disc alone, without the halo present. For the prograde orbits, the rotation curve is fairly symmetric, but it always lies below the one in the isolated disc; if the mass of the galaxy were calculated from this rotation curve, it would be under-estimated. The retrograde curve shows the interesting feature that on the side closer to the halo centre, it rises all the way to the last non-intersecting orbit, while on the other side it becomes flat. The expected shape of the global profiles in Hi will depend on how much gas is present on these orbits. Generically, the peak on the side where the rotation curve is flat will be higher, while the side with the lower peak has a sloping ‘shoulder’ to high velocity.
In the panels at the bottom, we plot the rotation curves along the minor axis of the system, perpendicular to the axis of symmetry. These curves are exactly symmetric. The prograde curve now rises significantly above the one for an isolated disc, while the retrograde curve is almost indistinguishable from it.
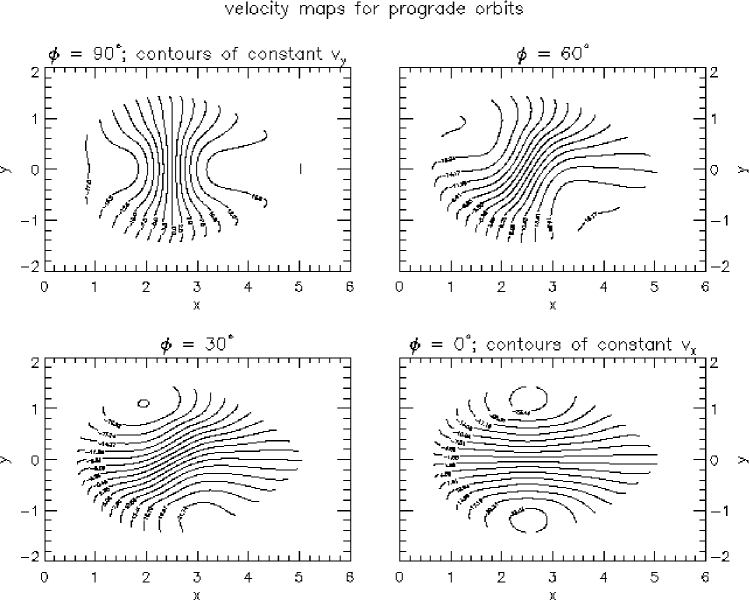
These figures would correspond to velocity-maps if the galaxies were observed with the line of sight parallel to these directions. The numbers on the contours are the actual velocities along the orbits; an observer would measure all velocities multiplied by a factor , with the inclination angle. The prograde maps (Fig. 4) show clear signs of the elongation of the outer orbits, but the overall asymmetries are mild and affect mainly the outer parts.
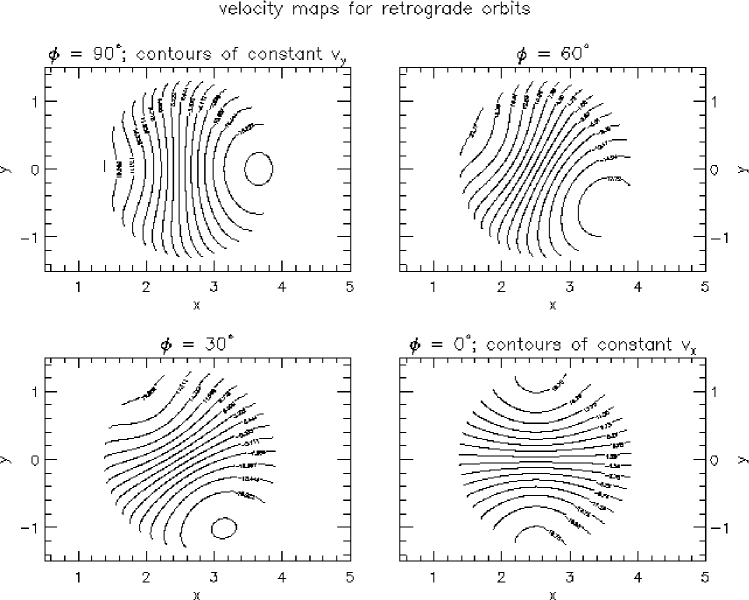
The retrograde maps (Fig. 5) however, show strong signs of lopsidedness. Except when the line of sight is parallel to the -axis (bottom right), the contours in these maps are quite straight on one side, and strongly curved outwards on the other side. In Fig. 6, we show the velocity-field of the lopsided galaxy NGC 4395, as presented by Swaters et al.[1999].
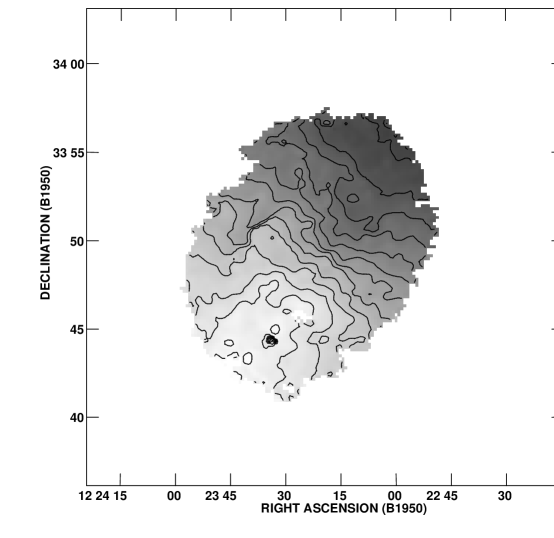
The similarity between this velocity-field and the two upper panels in our Fig. 5 is striking.
From Figures 3 to 5, we conclude that asymmetries in the overall galaxy potential do not necessarily produce strong signals in the rotation curves or velocity fields; depending on the viewing angle, the lopsidedness can be hidden. Conversely, a symmetric rotation curve or velocity-field does not guarantee a near-symmetric potential.
3.2 Changing the distance from the disc to the halo centre
In the simulations by L&S, the spinning disc continued to sink towards the halo centre, as long as it was outside the core radius. The prograde disc sank further inwards than the retrograde one. To investigate whether the orbital structure of our model could explain why the disc does not stay far outside the halo core, we changed the separation between the disc and halo centres, keeping all other parameters the same as in model A.
Model B:
In this model, the disc lies inside the halo core, so the halo now contributes a larger fraction, 25%, of the total mass within from the disc centre. In Fig. 7, we show the surfaces of section.
We chose the values for such that the zero velocity curves in each panel have approximately the same size and shape as in the respective panels in Fig. 2. At low values for the Jacobi integral, the surfaces of section show qualitatively the same behavior as in model A; there are two orbit families, one prograde (on the right of the surfaces of section) and one retrograde (on the left), and almost all orbits are regular. As the Jacobi integral is increased, the closed prograde orbit again shifts to the edge of the surface of section, while the closed retrograde orbit remains in the centre of its family. Compared to model A, orbits trapped around the closed prograde orbit continue to occupy more of the phase space on the right side of the figures, almost until the zero-velocity surface becomes open to the right of the figure. There are only very few islands of multi-periodic orbits and even at larger , the only irregular orbits are the ones that are not bound to the disc. This probably explains why also the prograde disc in L&S becomes stable within the halo core radius, and does not sink much further into the core. The retrograde side again remains regular up till high values of .
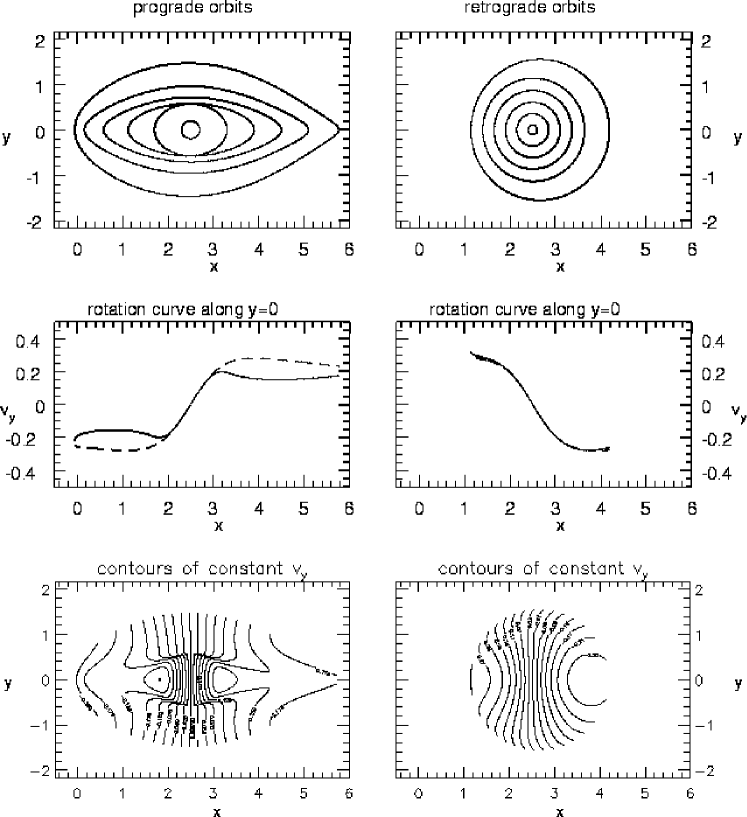
In Fig. 8, we show the closed orbits together with the rotation curves along the -axis and the contours of , which show the most pronounced asymmetries.
The prograde orbits are now less elongated than in model A, and their rotation curve lies close to the curve of the isolated disc. Note that in this case, the prograde rotation curve along the -axis also becomes flat on the side furthest from the halo centre, and keeps rising on the other side. The model velocity-map of is fairly symmetric. The rotation curve along the minor axis (at ) rises only slightly above the curve for an isolated disc.
The retrograde orbits are slightly more lopsided than in model A, and the asymmetry in the rotation curve along the -axis and in the velocity-map of , is more distinct.
Model C:
In model C we put the disc at , far outside the halo core. This model shows similar behavior to models D and G, and we refer the reader to Fig. 9 for an impression of the surfaces of section. The prograde side shows highly irregular behavior, even well before the zero-velocity curve becomes open. Large areas in the surfaces of section are occupied by multiply-periodic and irregular orbits. The region occupied by regular orbits trapped around the closed retrograde orbit also starts shrinking at relatively low values of , when all orbits are still bound to the disc. The irregularity of the surfaces of section probably explains why L&S found that even the retrograde disc is not stable when far out of the halo centre. Too few of their simulation particles could follow orbits trapped around the simple closed orbits.
The rotation curves and velocity-maps are like those of
Fig. 10. The prograde closed orbits become highly
elongated along the -axis at large radii, showing high velocity
gradients where the orbits change from circular to elongated.
Overall, they are fairly symmetric.
The retrograde orbits are only slightly lopsided, and the asymmetries in the
rotation curves and velocity-maps are mild.
We conclude that changing the offset of the disc from the halo centre affects the prograde orbits most strongly. As we increase the offset, the outer orbits become highly elongated, and high velocity gradients develop where the orbits change from circular to elongated. The prograde side of the surfaces of section becomes complicated, with few regular orbits trapped around the closed orbits. Hence a prograde disc is unlikely to survive unless it is well within the halo core.
The retrograde orbits and rotation curves are less affected, and become only slightly less asymmetric as we increase the offset. At low separations, the velocity map of is highly asymmetric, while increasing the offset makes the asymmetry less pronounced. As the disc is moved away from the halo core, fewer retrograde orbits are trapped around the closed periodic orbit.
3.3 Changing the disc mass
Changing the mass of the disc in our models has similar effects on the kinematics as changing the offset of the disc from the halo centre. We expect a model with a heavy disc to produce qualitatively the same behavior as a model with the disc far out from the halo centre. Indeed, the strength of the asymmetries in our model kinematics appears closely related to the relative densities of the disc and the halo, that is, to the parameter .
Model D:
In model D, the disc is twice as heavy as in the previous models. The offset between disc and halo centre is the same as in model A: . The halo now has a much smaller influence on the inner parts of the disc, with . The potential well of the disc is much deeper now, so we need to examine lower values for to see similar orbits.

Again, most retrograde orbits are regular up till high values for . The prograde side of the plots becomes distorted, with a large irregular region starting from . For a limited range in , there is an additional prograde family of closed orbits, visible in Fig. 9c near . Orbits trapped around these closed orbits occupy only a small region in phase space and are not expected to play an important role in any realistic model.
The same reasoning that we used in discussing model C leads us to suspect that a massive prograde disc will not be stable, and that it will sink towards the halo centre rapidly. By contrast, a retrograde disc might be stable when orbiting just outside the halo core.
In Fig. 10, we show the orbits, the rotation curves along the -axis and the contours of in this model. Non-crossing periodic orbits extend to larger distances from the disc centre than they did in model A. The prograde orbits become highly elongated at larger radii, and their major-axis rotation curve lies far below the curve for an isolated disc. The contours of show strong velocity gradients in this region, but are overall quite symmetric. The rotation curve along the minor axis is symmetric, but shows a large, abrupt rise in velocity at the radius where the orbits change from circular to elongated.
The retrograde orbits look similar to the ones in the previous models. The asymmetries in the rotation curve along the -axis, and in the velocity-map of , are less severe than in models A and B.
Model E:
Model E, with a low-mass disc of , shows many similarities with our model B. Its surfaces of section show few irregular orbits, with many orbits trapped around the closed orbits. Because of the regularity of the surfaces of section, we expect that a low-mass disc with either prograde or retrograde spin will be stable near the halo core radius in N-body simulations.
The closed prograde orbits are only slightly elongated; the rotation curve along the -axis becomes flat on the side more distant from the halo centre, and keeps rising on the other. The velocity-maps are only mildly asymmetric. The rotation curve along the -axis for the retrograde orbits is again clearly lopsided, and the velocity-maps are generally highly asymmetric.
3.4 Changing the halo core radius
L&S noted that when the halo core radius was small (), both the prograde and retrograde disc sank towards the halo centre rapidly. Decreasing the core radius of the halo has the effect of compressing the material in the halo, and thus of increasing its central density.
Model F:
In model F, the halo core radius is , half the size as in model A and equal to the disc scale length. The disc centre lies at , just outside of the halo core. The halo now contributes 37% of the total mass within from the disc centre.
In Fig. 11 we show the surfaces of section.
There are again very few irregular orbits. In panel a, we recognize the two familiar families of prograde and retrograde orbits. In panel b, the original prograde family has shifted to the right, and a large portion of the prograde side, around , is now occupied by a third family of orbits. These orbits have a loop that appears as an additional, narrow island in the far left corner of this panel, near . At (panel c), the original prograde family has disappeared; meanwhile, the third orbit family has lost its loop on the left side of the surface of section, and has now become simple-periodic itself. Because these orbits are simple-periodic only for a limited range in the Jacobi integral, within which they cross each other abundantly, we do not use them to make model rotation curves or velocity-maps. However, the fact that such a big part of phase-space is occupied by this family gives an indication why the prograde disc was not stable in the simulations by L&S. Only at low values for the Jacobi integral can many stars be on orbits trapped around the closed prograde orbit; as the Jacobi integral is increased, stars follow different orbits, resulting in strong mixing in the disc.
The retrograde side of the surfaces of section remains regular up to high values of . The range where we see closed retrograde orbits () is about twice as large as the range where the familiar closed prograde orbits exist (). This difference is more extreme than in the previous models.
In Fig. 12, we show orbits, rotation curves and velocity-maps in this model.
Neither the prograde or the retrograde closed orbits extend more than one scale length from the disc centre. This would explain why neither the prograde nor the retrograde disc was stable in the simulations of L&S; only particles in a small central part of the disc can be trapped near the simple closed orbits.
Both the prograde and the retrograde rotation curves along the -axis have a flat part on one side and a rising part on the other. The appearance is similar to the retrograde orbits in our models B and E, but with more extreme asymmetry. The minor-axis rotation curves deviate only slightly from the curve of an isolated disc. The velocity-maps are very asymmetric, especially the retrograde map.
Model G:
Model G, with a large halo (), shows similar behaviour
to our models C and D. The surfaces of section show many irregular orbits on
the prograde side, while the retrograde side again stays regular till high
values of .
As in model D, the prograde orbits become highly elongated along the -axis;
the rotation curves and velocity-maps look like the ones in
Fig. 10, with high velocity gradients where the orbits
change from circular to elongated.
The retrograde orbits are only slightly lopsided, and the rotation curves and
velocity-maps are hardly asymmetric.
The analysis of models with different sizes of the halo confirms our conjecture that the shape of the orbits and the velocity contours depends mainly on the relative densities of the disc and the halo, as given by the parameter . In model F, with a compact halo, the rotation curves and velocity-maps resemble those of models B and E, which both have a relatively high halo density too. The rotation curves along the -axis show a flat part on the far side from the halo core, and a rising side on the other side, for both the prograde and retrograde orbits. The retrograde velocity-maps of have strongly curved contours on the right side, but almost completely straight contours on the other side.
Model G, with a large, extended halo, shows the same behavior as models C and D, which also have a low halo density. The prograde side of the surfaces of section has large irregular regions, and the closed orbits become highly elongated at large radii, causing strong velocity gradients in the rotation curves and velocity-maps. The retrograde orbits, rotation curves and velocity-maps are only mildly asymmetric.
4 Discussion and conclusions
We have investigated an analytical model for lopsided galaxies, based on numerical simulations by Levine & Sparke [1998], in which a disc orbits off-centre within a ‘dark matter’ halo. We have constructed orbits, rotation curves and velocity-maps in the resulting gravitational potential; all these show significant asymmetries. The asymmetries show a clear correlation with the relative densities of the halo and the disc; they are stronger in the models where the halo contributes more of the mass in the inner regions of the disc (models B, E and F).
In the retrograde case, the orbits, and hence the expected distribution of stars or gas, are sometimes only slightly lopsided; but the rotation curves and velocity maps can be highly asymmetric. The rotation curves along the -axis, the symmetry axis of the lopsided system, keep rising on the side near the halo centre but become flat on the outer side. Correspondingly, velocity contours are straight on the side near the halo centre and curved on the outer side. Generically, the peak of the global Hi-profile on the side where the rotation curve is flat will be higher, while the side with the lower peak has a sloping ‘shoulder’ to high velocity. This characteristic asymmetry is similar to that in the velocity-map of the lopsided Sm galaxy NGC 4395 presented by Swaters et al. [1999]. This late-type system is one of the lowest-luminosity galaxies to have a Seyfert nucleus, which in turn is the faintest Seyfert 1 nucleus known [1989], with or [1999]. Presumably a central black hole is present in the nucleus.
The kinematics of our models are not unique but a general feature, in the sense that different combinations of parameters can give similar features in the rotation curves or velocity-maps. We can use the strength of the asymmetries to determine the parameter , the fraction of mass contributed by the halo within 2 scale lengths of the disc centre. For example, the velocity field of the galaxy NGC 4395 looks similar to some of our retrograde models. Comparing our Fig. 6 to the velocity-maps of models A, B, E and F, we estimate that this galaxy has a value for between 20 and 30%. The rotation curves of these models lie always close to the curves of the isolated disc (in other words, these models are ‘maximum disc’); we can use the total width of the rotation curve () as a measure of the disc mass. We infer a total mass for the disc of NGC 4395 of about within 8.5 kpc of the centre, taking Swaters’ distance of 3.8 Mpc and inclination . The blue magnitude of Matthews et al. [1999] implies a mass-to-light ratio , which is reasonable for the stellar population of a late-type disc.
Although the simulations of L&S showed that prograde-spinning discs sank more rapidly into the halo core than retrograde ones, we may still expect to observe some lopsided prograde discs as a transient phenomenon. In these, the gas distribution has a pronounced egg-shaped appearance; but the rotation curve can be very nearly the same on both sides of the galaxy, as is observed in some real galaxies. In models where the halo density is lower (models C, D and G), these prograde orbits become highly elongated, and strong velocity gradients develop. These orbits are probably not realistic for gas moving in such a galaxy.
It is interesting to compare our velocity fields to the ones found by Schoenmakers [1999, chapter 6]. He used epicycle theory to derive velocity fields in a model with an offset between the disc and halo centres. The mass ratio of his model is comparable to our model E (), but the offset is much smaller (). His velocity fields are less asymmetric than ours, even though the halo density in the inner parts of his model is higher than in any of our models. This difference is probably caused by the fact that Schoenmakers assumed that the offset between the disc and halo remained static in an inertial frame. Also, because of the small offset, the region where we expect to see a characteristic distortion of the velocity field is very small.
Our models explain the findings of Odewahn [1996] and Matthews et al. [1998] that lopsidedness is more common in discs of extreme late type (Sd and later). Broeils [1992, Figure 9b of Chapter 10] shows that the ratio of the dark halo’s core radius to the optical radius is for all but one of the systems of type Sd or later, while showing a large scatter for earlier types. Since our models show the most pronounced lopsidedness when the halo core is larger then the disk scale length, we expect most late-type disks, but a smaller fraction of the earlier types, to be highly susceptible to lopsidedness. Just as in the models of Jog [1997, 1999], we expect long-lived lopsidedness to be more severe, and thus more easily detected, in systems where the dark halo dominates the mass distribution.
We have calculated the closed orbits within the disk only until they begin to cross each other, or are no longer closed. These orbits are usually found only within scale lengths of the disk center. This is roughly the region probed by the optical studies of Zaritsky & Rix [1997] and Rudnick & Rix [1998], but does not extend as far out as some of the Hi studies of giant disk galaxies. Gas and stars may still circle the disc center outside our orbits; we would still expect lopsided kinematics there. Also, the disk would lie off-center with respect to any gas on orbits at larger distances that circle the halo center; but we do not make any detailed predictions for these cases.
We do not know whether an off-center disk can account for all types of lopsidedness. The best test is to examine both the velocity field and the distribution of stars and gas in the same galaxies. Neither Swaters [1999] nor Kornreich et al. [2000, 2001] found any appreciable correlation between morphological and kinematical lopsidedness. The models of Syer & Tremaine [1996], Earn & Lynden-Bell [1996] and Jog [1999], in which the centers of the disk and halo remain coincident, predict that photometrically-lopsided disks should also be kinematically lopsided. Our model can produce either photometric or kinematic lopsidedness, with very little of the other.
In all our models, the rotation curves perpendicular to the direction of lopsidedness (the -axis) are symmetric, and the velocity-maps of are only mildly asymmetric. Thus even a quite lopsided galaxy can look symmetric when seen from an unfavorable direction. In the retrograde models, velocity asymmetries are apparent for a fairly large range in viewing angles; an offset of from the -axis is usually enough. Kinematic asymmetries in the prograde discs are only visible for a small range of viewing angles, within of the most favorable direction. Naturally, the asymmetry in the prograde orbits themselves can be seen from any direction. The fact that lopsidedness can be hidden by an unfavorable viewing angle has important implications for the frequency with which it actually occurs in nature. The actual fraction of all galaxies that is lopsided may be higher than the 30–50% inferred from kinematic observations such as those of Richter & Sancisi [1994], Haynes et al. [1998] and Matthews et al. [1998].
The rotation curves for the prograde models often deviate far from the curves for an isolated disc of the same mass, even though they are usually quite symmetric (these models are not maximum disc); For example, in model A, where the prograde orbits are still well-behaved, the actual maximum in the rotation curve differs up to about 15% from that for the isolated disc, depending on the viewing angle. This effect will lead to incorrect estimates for the disc mass, and to scatter in the Tully-Fisher relation between rotation speed and luminosity of disc galaxies.
What might be the origin of lopsidedness? Generically, galaxies are widely believed to form by repeated mergers at early times, while much of the disk material may represent late infall. Walker, Mihos and Hernquist [1996], and Z&R [1997], proposed that merging a small galaxy with a larger disk system should produce a lopsided disk. If the fractions of dark and luminous matter are not the same for all fragments, we may expect the center of the disk to be displaced from that of the dark halo. As an example, if the small system is largely gaseous, and comes in with nonzero angular momentum, then once it has merged with the larger galaxy’s luminous disk, the center of the combined disk will orbit that of the halo.
Although the agreement of our model velocity fields with observations is promising, the stability of our models remains an important issue. For example, we have modelled the halo as a fixed potential, ignoring dynamical friction between the disc and whatever particles make up the unseen halo. However, it is not clear that dynamical friction must cause the lopsidedness to damp rapidly. Weinberg [1991, 1994] and Vesperini & Weinberg [2000] found that some spherical galaxy models have long-lived lopsided modes; once excited, these modes take many orbital times to decay. Taga & Iye [1998] have shown that a central massive object can wander away from the centre of an initially spherical stellar system. They found instability only when the central object had no more than 10% of the total mass; but Weinberg’s work implies that somewhat larger masses should suffer only weak damping. These indications are promising, but further calculations will be needed to explore the stability of our models.
Acknowledgments
We are grateful to R.A. Swaters for helpful discussions about observations of lopsided galaxies, and to our referee, whose reports helped us to clarify our presentation. E.N. wants to thank the Astronomy Department of UW-Madison for hospitality during the course of this work, and the Kapteyn-fonds and Utrecht University for financial support. We thank the US National Science Foundation for support under grant AST-9803114.
References
- [1980] Baldwin J.E., Lynden-Bell D., Sancisi R., 1980, MNRAS, 193, 313
- [1987] Binney J., Tremaine S., 1987, Galactic Dynamics. Princeton Univ. Press, Princeton
- [1992] Broeils A.H., 1992, PhD thesis, Groningen Univ.
- [1991] Casertano S., Van Gorkom J.H., 1991, AJ, 101, 1231
- [1973] De Vaucouleurs G., Freeman K.C., 1973, Vistas Astron., 14, 163
- [1996] Earn D.J.D., Lynden-Bell D., 1996, MNRAS, 278, 395
- [1989] Filippenko A.V., Sargent W.L., 1989, ApJ, 342, L11
- [2001] Galli D., Shu F.H., Laughlin G., Lizano S., 2001, ApJ, 551, 367
- [1998] Haynes M.P., Hogg D.E., Maddalena R.J., Roberts M.S., Van Zee L., 1998, AJ, 115, 62
- [1965] Hénon M., 1965, Ann. Astrophys., 28, 992
- [1997] Jog C.J., 1997, ApJ, 488, 642
- [1999] Jog C.J., 1999, ApJ, 522, 661
- [2000] Kornreich D.A., Haynes M.P., Lovelace R.V.E., Van Zee L., 2000, AJ, 120, 139
- [2001] Kornreich D.A., Haynes M.P., Jore P.J., Lovelace R.V.E., 2001, AJ, 121, 1358
- [1996] Kuijken K., Fisher D., Merrifield M.R., 1996, MNRAS, 283, 543
- [1998] Levine S.E., Sparke L.S., 1998, ApJ, 496, L13
- [1998] Matthews L.D., Van Driel W., Gallagher J.S., 1998, AJ, 116, 1169
- [1999] Matthews L.D. et al., 1999, AJ 118, 208
- [1996] Odewahn S.C., 1996, in ‘Barred Galaxies’, eds. R. Buta, D.A. Crocker, B. Elmegreen, ASP Conf. Ser. 91, p. 30
- [1996] Persic M., Salucci P., Stel F., 1996, MNRAS, 281, 27
- [1994] Richter O.G., Sancisi R., 1994, A&A, 290, L9
- [1995] Rix H.-W., Zaritsky D., 1995, ApJ, 447, 82
- [1998] Rudnick G., Rix H.-W., 1998, AJ, 116, 1163
- [1979] Sancisi R., Allen R.J., 1979, A&A, 74, 73
- [1988] Sawamura M., 1988, PASJ, 40, 279
- [1999] Schoenmakers R.H.M., 1999, PhD thesis, Groningen Univ.
- [1994] Sellwood J.A., Merritt D., 1994, ApJ, 425, 530
- [1999] Swaters R.A., 1999, PhD thesis, Groningen Univ.
- [1997] Swaters R.A., Sancisi R., Van der Hulst J.M., 1997, ApJ, 491, 140
- [1999] Swaters R.A., Schoenmakers R.H.M., Sancisi R., Van Albada T.S., 1999, MNRAS, 304, 330
- [1996] Syer D., Tremaine S., 1996, MNRAS, 281, 925
- [1998] Taga M., Iye M., 1998, MNRAS, 299, 111
- [2000] Vesperini E., Weinberg M.D., 2000, ApJ, 534, 598
- [1996] Walker I.R., Mihos J.C., Hernquist L., 1996, ApJ, 460, 121
- [1991] Weinberg M., 1991, ApJ, 368, 66
- [1994] Weinberg M., 1994, ApJ, 421, 481
- [1978] Zang T.A., Hohl F., 1978, ApJ, 226, 521
- [1997] Zaritsky D., Rix H.-W., 1997, ApJ, 477, 118