ECHA J0843.3–7905: Discovery of an ‘old’ classical T Tauri star in the Chamaeleontis cluster
Abstract
A limited-area survey of the Chamaeleontis cluster has identified 2 new late-type members. The more significant of these is ECHA J0843.3–7905 (= IRAS F08450–7854), a slowly-rotating ( d) M2 classical T Tauri (CTT) star with a spectrum dominated by Balmer emission. At a distance of 97 pc and cluster age of Myr, the star is a nearby rare example of an ‘old’ CTT star and promises to be a rewarding laboratory for the study of disk structure and evolution in pre-main sequence (PMS) stars. The other new member is the M4 weak-lined T Tauri (WTT) star ECHA J0841.5–7853, which is the lowest mass ( M⊙) primary known in the cluster.
keywords:
stars: activity — stars: pre-main-sequence — stars: rotation — circumstellar matter — open clusters and associations: individual: Chamaeleontis1 Introduction
The Chamaeleontis star cluster is a compact grouping of PMS stars at a distance of 97 pc (Mamajek, Lawson & Feigelson 1999, 2000). The cluster is one of the closest open clusters, and one of the nearest groups of PMS stars known. Analysis of Hertzsprung-Russell (HR) diagrams constructed using contemporary evolutionary models indicate an age of Myr (Lawson & Feigelson 2001), similar to other nearby groups of PMS stars such as the TW Hya association (Webb et al. 1999). The age of the cluster is intermediate between young PMS stars (ages of a few Myr) still associated with their parent molecular clouds and older post-T Tauri (ages of a few Myr) populations, and is thus at an interesting age for the study of science issues concerning early stellar evolution, e.g., angular momentum evolution, disk dissipation and planet formation, and magnetic activity evolution.
Mamajek et al. (1999) listed a population of 13 primaries; 12 of these are X-ray emitting stars detected during a ROSAT High-Resolution Imager (HRI) pointing (the RECX stars) and the 13th is the X-ray-quiet A star HD 75505. These 13 objects consist of 3 early-type systems ( Cha, RS Cha AB and HD 75505) and 10 WTT stars.
Completing the census of cluster members is important for studies examining the properties of a coeval population of PMS stars. Consideration of the cluster initial mass function (IMF) suggests that the stellar population may be the known number of primaries (Mamajek et al. 2000). In this paper we report the discovery of 2 new late-type cluster members residing within the ROSAT HRI region, following a search for stars with photometric chacteristics similar to the known members. In the following sections we detail our search and analysis methods.
2 Observations and Data Reduction
2.1 Photometric selection of candidate members
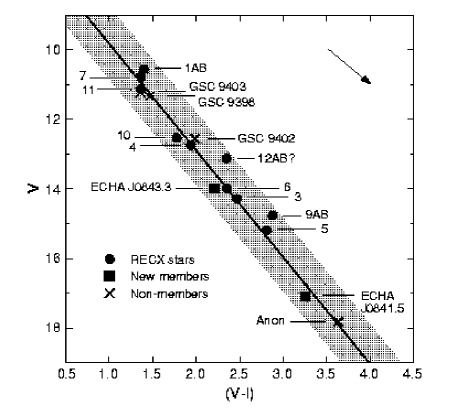
Compared to most field stars of similar colour (or temperature), members of the Cha cluster are elevated in magnitude (or luminosity) in the colour-mag (or HR) diagram, owing to a combination of youth, proximity and low interstellar reddening. [Westin (1985) found () = –0.004 for Cha, indicating that reddening is unimportant for the cluster.] Cluster members appear to be highly coeval (to Myr depending upon the adopted evolutionary model; see Lawson & Feigelson 2001), with most of the late-type RECX stars forming a near-linear sequence in the colour-magnitude diagram. Several RECX stars appeared elevated in brightness above the sequence due to suspected binarity, which has since been confirmed in 2 cases by Köhler (2001).
These characteristics can be used to select candidate cluster members with similar photometric properties to the known cluster stars. Spectroscopic study can then confirm signs of stellar youth, in particular enhanced lithium. Thus new members of the cluster can be found irrespective of their X-ray properties and without prior knowledge of their distances or proper motions. However, such a sample might suffer contamination from background giants and foreground stars. Mamajek et al. (2000; see their fig. 4) showed a colour-magnitude diagram for 21,000 stars within a 1o radius of the cluster based upon United States Naval Observatory (USNO) A2.0 photographic photometry (Monet et al. 1998). The RECX stars were elevated above the vast majority of stars, but a broad giant branch overlapped the region of the diagram occupied by the K-type RECX stars.
Lawson et al. (2001) used the 1-m telescope and 1k 1k SITe charge-coupled device (CCD) at the South African Astronomical Observatory (SAAO) to obtain multi-epoch differential -band observations and Cousins VRI photometry of the late-type members of the cluster. In addition to these data, fields neighbouring those containing the known members were observed to search for new members.
VRI frames were obtained with exposure times ranging from s to encompass the magnitude range of the late-type members, and to obtain photometry to fainter limits. The deepest frames obtained useful (few percent accuracy) photometry of stars of , or stars of spectral type M5 and mass M⊙ at the distance and age of the cluster according to the models of Siess, Dufour & Forestini (2000). These data were calibrated against equatorial and southern photometric standard stars. The SITe CCD has a field of view of 26 arcmin2 at the /16 Cassegrain focus of the 1-m telescope. 23 fields were observed, many over-lapping, for a total area of arcmin2 or 40% of the extent of the cluster as defined by Mamajek et al. (2000). Stars in each field were compared to the sequence of RECX stars in the () versus colour-magnitude diagram. Candidates were selected as those objects with mags that fell, for their () colour, within the range mag of the sequence of RECX stars (Fig. 1). This criterion accounted for the possibility of a greater spread of ages within the cluster than is apparent in the RECX stars, highly reddened stars or binary stars with elevated mags, and non-linearities in the colour-magnitude relationship for the cluster (Lawson & Feigelson 2001). Of stars measured, only 6 met the criterion (Table 1). Most stars in the fields were mag fainter than the sequence; in particular the 3 M-type candidates were the only stars with () , and with magnitudes that differed by mag from the extrapolated linear sequence.
The differential -band data were obtained with a 30 s exposure time, with observations of each field obtained during 1999 and during 2000. The methods used to reduce and analyse the calibrated and differential photometric data are discussed by Lawson et al. (2001).
| H EW | Li I EW | Sp. | |||||||
|---|---|---|---|---|---|---|---|---|---|
| Star | (h m s) | (d m s) | () | () | (Å ) | (Å ) | type | Comments | |
| GSC 9402_1003 | 08 36 40.7 | –78 54 58 | 12.55 | 0.96 | 1.98 | 0.9 | M2 | ||
| GSC 9398_0099 | 08 37 51.4 | –78 44 37 | 11.33 | 0.76 | 1.46 | 1.1 | 0.0 | K5 | |
| USNO Anon 1 | 08 41 30.6 | –78 53 07 | 17.07 | 1.52 | 3.25 | 0.9 | M4 | ECHA J0841.5–7853 | |
| USNO Anon 2 | 08 43 18.4 | –79 05 21 | 13.97 | 0.99 | 2.20 | 0.6 | M2 | ECHA J0843.3–7905 | |
| Anonymous | 08 48 34.9 | –78 53 52 | 17.81 | 1.69 | 3.63 | M5 | |||
| GSC 9403_0831 | 08 51 23.2 | –79 05 23 | 11.21 | 0.72 | 1.35 | 1.0 | 0.0 | K4 |
2.2 Spectroscopic confirmation
Optical spectroscopy of the 6 candidates was obtained on 2000 April 21 and 22 using the 2.3-m telescope and dual-beam spectrograph at Mount Stromlo and Siding Springs Observatories (MSSSO). In the red beam, the 1200R (1200 line mm-1) grating gave a 2-pixel resolution of 1.1 Å with coverage from Å. In the blue beam, the 600B (600 line mm-1) grating gave a 2-pixel resolution of 2.2 Å with coverage from Å. Exposure times ranged from 720 s to 3000 s, and yielded continuum signal-to-noise (S/N) ratios of in the red and, for the 4 brightest stars, in the blue. The spectra were calibrated using dome-flats, bias frames and Fe-Ar arc frames, making use of standard library routines such as ccdproc within IRAF.
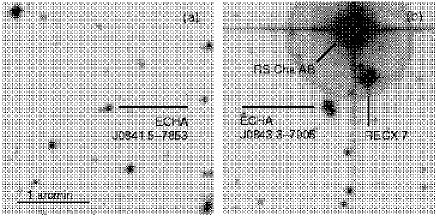
Analysis of the spectra showed 2 of these stars were active, lithium-rich late-type objects. One of these stars (listed as USNO Anon 1 in Table 1) has only a USNO-A2.0 catalogue entry. The other star (listed as USNO Anon 2 in Table 1) appears to be the optical counterpart of the IRAS Faint Source Catalogue (IRAS FSC; Moshir et al. 1989) object IRAS F08450–7854. The IRAS FSC position differs by 5 arcsec from the USNO position, with a arcsec error ellipse. The IRAS source had been mistakenly associated with the nearby early-type cluster member RS Cha AB. Neither star was detected by ROSAT HRI indicating X-ray luminosities log erg s-1 (Mamajek et al. 2000). These 2 stars (henceforth ECHA J0841.5–7853 and ECHA J0843.3–7905, respectively) are assigned an Cha cluster designation making use of J2000 coordinates. Identification fields for both stars, derived from the Second Palomar Observatory Sky Survey (POSS-II), are shown in Fig. 2. The other photometric candidates are discussed in Section 3.3.
3 Discussion
3.1 Spectroscopy of the new cluster members
3.1.1 ECHA J0841.5–7853
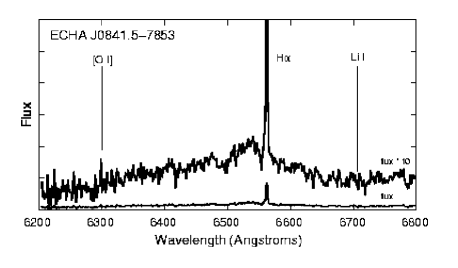
Spectroscopy of ECHA J0841.5–7853 (Fig. 3) shows the star to be of spectral type M4. The level of optical activity is typical for a late-M WTT star, with the H equivalent width (EW ) = Å. Li I absorption is strong (EW = 0.9 Å) and the spectrum also shows weak [OI] emission. The blue spectrum of the star (not shown) shows weak H and H emission; however the poor S/N ratio of the spectrum prevented reliable measurement of these lines. At and an inferred mass M⊙ from Siess et al. (2000) tracks, the star is the optically faintest and lowest mass primary known in the cluster.
3.1.2 ECHA J0843.3–7905
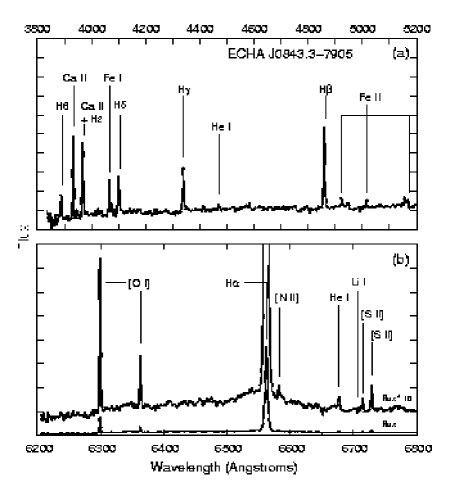
The more significant of the 2 new members is ECHA J0843.3–7905. The star is clearly a CTT star with an optical spectrum dominated by strong Balmer and Ca II emission (Fig. 4). The H Å, and the H Å. Also present in emission in the blue spectrum (Fig. 4a) is Fe I, He I and all three of the chromospheric lines of the Fe II (42) multiplet (, 5018 and 5169). The red spectrum (Fig. 4b) shows strong , 6363 [OI] emission, and emission lines of [N II], He I (the transition is shown; also the transition is present) and [S II]. Li I is present in absorption with EW = 0.6 Å.
Consideration of the spectrum of the star yields a spectral type of M2M3. The colour of the star () yields a similar result ( M2). This classification is tentative given the likely high level of optical veiling in the spectrum. The star also has a high degree of optical variability, which we discuss below. From the colour-magnitude diagram and Siess et al. (2000) models, the inferred mass of the star is M⊙.
3.2 Multi-epoch V observations
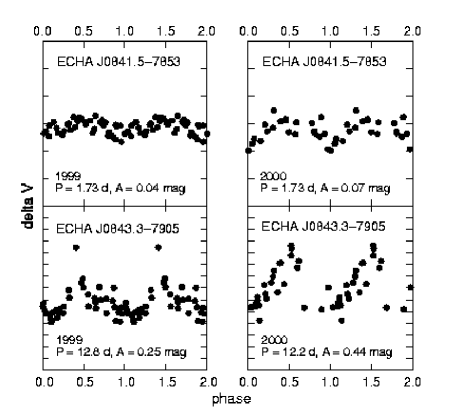
Multi-epoch observations were made of ECHA J0841.5–7853 and ECHA J0843.3–7905 during 1999 February–March and 2000 February–March as part of a larger study to measure the rotation periods of the late-type RECX stars in the Cha cluster. Lawson et al. (2001) found that all of these stars were variable, with periods attributed to rotational modulation of cool starspots. Differential -band observations of the 2 new cluster members were obtained with respect to nearby stars within their CCD frames. The 1999 and 2000 data sets for each star were independently analysed using the Lomb-Scargle Fourier method for non-equally spaced data, with the frequency range of d-1 examined for periodicities. Both stars showed periodic variations in each year. Phased light curves are shown in Fig. 5, and details of the periodicities are listed in Table 2. The S/N ratio for each periodicity was determined by measuring the residual noise level in the pre-whitened data sets.
For ECHA J0841.5–7853, a low-amplitude 1.73-d periodicity was recovered in each year. As with the late-type RECX stars, we associate the variations with the rotational modulation of cool spots. Following Allain et al. (1996) we calculated the lower limit to the fractional spot coverage by assuming the spots were dark. The spot fractions are listed as percentages in Table 2. Lawson et al. (2001) corrected the VRI photometry of the RECX stars for the effects of the starspots by estimating the mag and colours of the unspotted, or minimum-spotted, star from the phase of the VRI photometry and the -band amplitude of the star. The VRI measurements listed in Table 1 were obtained near maximum light and thus represent the unspotted, or minimum-spotted, star.
For ECHA J0843.3–7905, a 12-d periodicity was measured in each year, but with different structure in the light curve. During 1999 February, a short-duration ( d) peak was observed that may have been an optical flare. Underlying the peak of mag is a mag amplitude quasi-sinusoidal variation that dominates the Fourier analysis. The light curve during 2000 has a different appearance, but with the same underlying period and -band amplitude. The VRI photometry reported in Table 1 was obtained in 2000 near maximum light. Given the large photometric amplitude and the variable structure of the light curve probably driven by accretion hotspots, these data may not represent the unspotted photospheric values.
| ECHA | Year | Period | Amp. | S/N | Coverage |
|---|---|---|---|---|---|
| (d) | (mag) | ratio | (per cent) | ||
| J0841.5–7853 | 1999 | 1.73 | 0.04 | 3 | 4 |
| 2000 | 1.73 | 0.07 | 3 | 6 | |
| J0843.3–7905 | 1999 | 12.8 | 0.25 | 4 | – |
| 2000 | 12.2 | 0.44 | 5 | – |
3.3 Comments on the rejected candidates
Analysis of the MSSSO spectra showed 3 of these stars (GSC 9402_1003, GSC 9398_0099 and GSC 9403_0831) were late-K or early-M spectral type giants with H in narrow absorption with EW Å and no detectable Li I absorption (see Table 1). All 3 stars can also be ruled out as cluster members from their proper motions. GSC 9398_0099 and GSC 9403_0831 have Tycho-2 (Hg et al. 2000) proper motions (, ) = (3.7, 1.4) and (, 6.2) mas yr-1, respectively (1 uncertainties are mas yr-1). GSC 9402_1003 has a USNO UCAC1 (Zacharias et al. 2000) proper motion of (, ) = (, 25.3) mas yr-1 (1, 12.5 mas yr-1). These values differ by from the Hipparcos /Tycho-2 proper motion for the cluster of (, ) = (, ) mas yr-1 (Mamajek et al. 2000)111Note that Table 2 of Mamajek et al. (2000) incorrectly lists mas yr-1..
The remaining candidate is listed as ‘Anonymous’ in Table 1, since we found no catalogue entries for this star. Both the spectrum and the colours of the star are consistent with a M5 spectral classification. The star has weak H emission and no detectable Li I absorption line. Study of on-line scanned plates used to compile the USNO-A2.0 catalogue (Monet et al. 1998) show the star has high proper motion (see Fig. 6). We determined the position of the star against USNO-A2.0 positions for several nearby stars at 4 epochs (1978.10, 1986.18, 1996.13 and 2000.12); the first 3 from scanned plates available from USNO, and the last from analysis of a SAAO CCD image. From these positions we derived (, ) (, 360) mas yr-1. The USNO-A2.0 catalogue rejects stars with mas yr-1. The star is likely a dMe. If it is a main-sequence star, then the star has a distance of pc and tangential velocity of km s-1.
4 Summary and Conclusions
Hillenbrand & Meyer (1999) examined the frequency of disks as a function of stellar age for nearby clusters and star forming regions and found that disks disperse on a timescale of Myr, with few disks remaining at ages Myr. Haisch, Lada & Lada (2001) conducted a similar study on the stellar population of several young clusters, concluding that essentially all stars lose their disks within Myr. The prevalence of disks in the Myr-old Cha cluster will be examined by Lyo et al. (in preparation).
An ‘old’ and nearby CTT star such as ECHA J0843.3–7905 is therefore rare. A similar star is the CTT star TW Hya, also nearby ( pc) and Myr old (Webb et al. 1999). The resolved pole-on disk surrounding TW Hya has been a focus for study of disk structure (e.g. Trilling et al. 2001) and the early planet formation environment. ECHA J0843.3–7905 is of later spectral type and lower mass than TW Hya. Imaging studies of ECHA J0843.3–7905 could give valuable insight into the nature of evolved disks (and indirectly planets) around dwarf M stars.
Like other CTT stars, ECHA J0843.3–7905 has a strong infrared excess. Analysis of -band imaging of the cluster core obtained with the South Pole Infrared Explorer telescope during 1999 (Lyo et al., in preparation) found for this star. Assuming an M2 spectral type, the -band excess is mag. The IRAS FSC entry for the star indicates high-quality 25- and 60-m fluxes.
Our survey of % of the known extent of the cluster found 2 new cluster members not detected by the discovery ROSAT HRI image of Mamajek et al. (1999, 2000), thereby increasing the number of stellar primaries to 15. A survey of similar depth across the cluster might therefore find only several more new members. This result appears to be at odds with Mamajek et al. (2000) who predicted from consideration of the cluster IMF that the stellar population was the (then) known number of 13 primaries. Our survey might indicate that the cluster extent is not constrained by the ROSAT HRI field and that primaries await discovery beyond the HRI boundary. Alternatively, if the cluster is constrained by the HRI field, then the low success rate of our study suggests the cluster may contain as few as primaries. (These estimates do not address the brown dwarf population expected to accompany the stellar members.) Either of the above population scenarios indicates the X-ray survey must have been relatively complete at detecting cluster members within the HRI field. This result confirms the unusual skewness of the ratio of X-ray luminosity to bolometric luminosity noted by Mamajek et al. (1999, 2000), with most of the late-type RECX stars having a flux ratio near the ‘saturation’ level of log /.
Acknowledgments
We thank the SAAO and MSSSO time allocation committees for telescope time during 1999 and 2000. WAL and LAC thank the staff of SAAO for their assistance. WAL and EEM thank the MSSSO support staff for their guidance in operating the 2.3-m telescope. WAL acknowledges financial support from the Australian Research Council Small Grant Scheme and University College Special Research Grants. LAC is supported by a NRF Post-graduate Scholarship. EEM thanks the SIRTF Legacy Science Program for support. EDF’s research is supported in-part by NASA contracts NAS8-38252 and NAG5-8422. This research made use of the POSS-II survey and the VizieR database. The scanned plates used to construct the USNO-A2.0 catalogue are available at http://www.nofs.navy.mil.
References
- [1] Allain S., Bouvier J., Prosser C., Marschall L. A., Laaksonen B. D., 1996, A&A, 305, 498
- [2] Haisch K. E., Lada E. A., Lada C. J., 2001, ApJ, 553, L153
- [3] Hillenbrand L. A., Meyer M. R., 1999, AAS, 195, 209
- [4] Hg E., et al., 2000, A&A, 355, L27
- [5] Köhler R., 2001, in Jayawardhana R., Greene T. P., eds, ASP Conf. Ser. Vol. 244, Young Stars Near Earth, Astron. Soc. Pac., San Francisco, p277
- [6] Lawson W. A., Crause L. A., Mamajek E. E., Feigelson E. D., 2001, MNRAS, 321, 57
- [7] Lawson W. A., Feigelson E. D., 2001, in Montmerle T., André P., eds, ASP Conf. Ser. Vol. 243, From Darkness to Light, Astron. Soc. Pac., San Francisco, p591
- [8] Mamajek E. E., Lawson W. A., Feigelson E. D., 1999, ApJ, 516, L77
- [9] Mamajek E. E., Lawson W. A., Feigelson E. D., 2000, ApJ, 544, 356
- [10] Monet D., et al., 1998, USNO-A2.0: A Catalog of Astrometric Standards, US Naval Observatory, Flagstaff
- [11] Moshir R., et al., 1989, IRAS Faint Source Catalogue, Version 2.0, IPAC, Pasadena
- [12] Rieke G. H., Lebofsky M. J., 1985, ApJ, 288, 618
- [13] Siess L., Dufour E., Forestini M., 2000, A&A, 358, 593
- [14] Trilling D. E., Koerner D. W., Barnes J. W., Ftaclas C., Brown R. H., 2001, ApJ, 552, L151
- [15] Webb R. A., Zuckerman B., Platais I., White R. J., Schwartz M. J., McCarthy C., 1999, ApJ, 512, L63
- [16] Westin T. N. G., 1985, A&AS, 60, 99
- [17] Zacharias N., Zacharias M. I., Urban S. E., Hg E., 2000, AJ, 120, 1148