A Fast Bar in the Post-Interaction Galaxy NGC 1023 thanks: Based on observations made with the Italian Telescopio Nazionale Galileo (AOT-3, 3-06-119) operated on the island of La Palma by the Centro Galileo Galilei of the Consorzio Nazionale per l’Astronomia e l’Astrofisica, and the Jacobus Kapteyn Telescope operated by the Isaac Newton group at La Palma island at the Spanish Observatorio del Roque de los Muchachos of the Instituto de Astrofisica de Canarias.

Victor P. Debattista1, Enrico Maria Corsini2, and J. A. L. Aguerri1
1 Astronomisches Institut, Universität Basel, Venusstrasse 7, CH-4102 Binningen, Switzerland
2 Osservatorio Astrofisico di Asiago, Dipartimento di Astronomia, Università di Padova, via dell’Osservatorio 8, I-36012 Asiago, Italy
email: debattis@astro.unibas.ch
(Draft version on )
Abstract

We measured the bar pattern speed, ΩpsubscriptΩ𝑝\Omega_{p}, of the SB0 galaxy NGC 1023 using the Tremaine-Weinberg (1984) method with stellar-absorption slit spectroscopy. The morphology and kinematics of the H I gas outside NGC 1023 suggest it suffered a tidal interaction, sometime in the past, with one of its dwarf companions. At present, however, the optical disc is relaxed. If the disc had been stabilized by a massive dark matter halo and formed its bar in the interaction, then the bar would have to be slow. We found Ωp=5.0±1.8subscriptΩ𝑝plus-or-minus5.01.8\Omega_{p}=5.0\pm 1.8 kms1arcsec1k𝑚superscript𝑠1𝑎𝑟𝑐𝑠𝑒superscript𝑐1\mathrm{k}m\;s^{-1}\,arcsec^{-1}, so that the bar ends near its co-rotation radius. It is therefore rotating rapidly and must have a maximum disc.

keywords:
galaxies: elliptical and lenticular, cD — galaxies: haloes — galaxies: individual: NGC 1023 — galaxies: interactions — galaxies: kinematics and dynamics — galaxies: photometry

1 Introduction

Strong bars are seen in optical images of roughly 30% of all high surface brightness (HSB) disk galaxies (Sellwood & Wilkinson 1993) and this fraction rises to 50%-75% in the near IR (Knapen 1999; Knapen et al. 2000; Eskridge et al. 2000). Understanding the structure and dynamics of barred (SB) galaxies is, therefore, an issue of some importance. The principal dynamical quantity for SB galaxies is the rotation frequency/pattern speed of the bar, ΩpsubscriptΩ𝑝\Omega_{p}. This is usually parametrized by the distance-independent ratio DL/aBsubscript𝐷𝐿subscript𝑎𝐵{\cal R}\equiv D_{L}/a_{B}, where aBsubscript𝑎𝐵a_{B} is the semi-major axis of the bar and DLsubscript𝐷𝐿D_{L} is the radius to the Lagrangian point, where the gravitational and centrifugal forces cancel out in the bar’s rest frame. (The Lagrangian radius is therefore the generalization to strong bars of the corotation radius.) Contopoulos (1980) argued that a self-consistent bar is possible only if 11{\cal R}\geq 1. A bar is termed fast when 1.0<1.41.0<1.41.0\leq{\cal R}\mathrel{\hbox to0.0pt{\lower 2.15277pt\hbox{$\mathchar 536\relax$}\hss}\raise 1.72218pt\hbox{$\mathchar 316\relax$}}1.4, while, for a larger value of {\cal R}, a bar is said to be slow.

A variety of methods have been used to attempt measurent of bar pattern speeds (see, for example, the review of Elmegreen 1996). Most measurements of {\cal R} rely on hydrodynamical simulations. These usually try to match the gas flow in the region of the bar, particularly at the shocks, which works because the location of the shocks depends on {\cal R}, moving further ahead of the bar as {\cal R} increases. A bar needs to be fast for the shocks to remain curved with their concave sides towards the bar major axis, as is usually observed (van Albada & Sanders 1982; Athanassoula 1992). Detailed simulations of gas flows in individual galaxies also result in fast bars; examples include: NGC 1365 (=1.31.3{\cal R}=1.3, Lindblad et al. 1996), NGC 1300 (=1.31.3{\cal R}=1.3, Lindblad & Kristen 1996), and NGC 4123 (=1.21.2{\cal R}=1.2, Weiner et al. 2001). Hydrodynamical simulations can also recover {\cal R} by matching morphological features in H I; some examples are: NGC 7479 (=1.221.22{\cal R}=1.22, Laine 1996), NGC 1073 (=11.211.2{\cal R}=1-1.2, England et al. 1990), NGC 3992 (=11{\cal R}=1, Hunter et al. 1989), and NGC 5850 (=1.35({\cal R}=1.35, Aguerri et al. 2001).

A direct method for measuring ΩpsubscriptΩ𝑝\Omega_{p}, using a tracer population which satisfies continuity, was developed by Tremaine & Weinberg (1984). Since gas is subject to phase changes, it is not well-suited for this application. Old stellar populations in the absence of significant obscuration, on the other hand, are ideal for the Tremaine-Weinberg (TW) method. This has permitted application of the method to a small number of early type SB galaxies: NGC 936 (=1.4±0.3plus-or-minus1.40.3{\cal R}=1.4\pm 0.3, Kent 1987 and Merrifield & Kuijken 1995), NGC 4596 (=1.150.23+0.38subscriptsuperscript1.150.380.23{\cal R}=1.15^{+0.38}_{-0.23}, Gerssen et al. 1998) and NGC 7079 (=0.9±0.15plus-or-minus0.90.15{\cal R}=0.9\pm 0.15, Debattista & Williams 2001).

The observational evidence, therefore, favors fast bars. The perturbation theory calculations of Weinberg (1985) predicted that a fast bar would be slowed down rapidly in the presence of a massive dark matter (DM) halo. Such slow-down has been seen in various simulations (Sellwood 1980; Little & Carlberg 1991; Hernquist & Weinberg 1992; Athanassoula 1996). The fully self-consistent, high resolution N𝑁N-body simulations of Debattista & Sellwood (1998) also confirmed this prediction; however they showed that, for a maximum disc (here taken to mean a disc which dominates the rotation curve throughout the inner few disc scale-lengths, cf. van Albada & Sancisi 1986), a fast bar can survive for a large fraction of a Hubble time. Subsequently, Tremaine & Ostriker (1999) suggested that bars manage to remain fast not because discs are maximal but rather because the inner parts of DM halos are flattened and rapidly rotating. However, Debattista & Sellwood (2000) showed that rapid slow-down persists even then unless the halo angular momentum is very large relative to that of the disc. Thus they concluded that SB galaxies must be maximal, and argued that the same must be true for all high surface brightness disc galaxies.

This conclusion rests on a small number of pattern speed measurements; in view of the fact that maximum discs are in conflict with the predictions of cold dark matter (CDM) cosmologies (e.g. Navarro et al. 1997), enlarging the sample of measured pattern speeds is desireable. In this paper, we report observations of NGC 1023, for which we applied the TW method.

The rest of this paper is organized as follows. The TW method is described briefly in §2. Then, in §3 we give an overview of the previously known properties of NGC 1023. The photometric observations, reduction and results, including aBsubscript𝑎𝐵a_{B}, are presented in §4, while §5 presents the spectroscopic observations and results. We derive the rotation curve, corrected for the asymmetric drift, from which we obtain DLsubscript𝐷𝐿D_{L}. With these results at hand, we then apply the TW method in §6. We present our conclusions in §7.

2 The Tremaine-Weinberg Method

The TW method is contained in the following simple equation:

Ωpsini=h(Y)Σ(X,Y)V𝑙𝑜𝑠(X,Y)𝑑X𝑑Yh(Y)Σ(X,Y)X𝑑X𝑑YsubscriptΩ𝑝𝑖subscriptsuperscript𝑌subscriptsuperscriptΣ𝑋𝑌subscript𝑉𝑙𝑜𝑠𝑋𝑌differential-d𝑋differential-d𝑌subscriptsuperscript𝑌subscriptsuperscriptΣ𝑋𝑌𝑋differential-d𝑋differential-d𝑌\Omega_{p}\sin i\ =\ \frac{\int^{\infty}_{-\infty}~{}h(Y)\int^{\infty}_{-\infty}\Sigma(X,Y)~{}V_{\it los}(X,Y)~{}dX~{}dY}{\int^{\infty}_{-\infty}~{}h(Y)\int^{\infty}_{-\infty}\Sigma(X,Y)~{}X~{}dX~{}dY} (1)

where i𝑖i is the inclination of the galaxy, V𝑙𝑜𝑠subscript𝑉𝑙𝑜𝑠V_{\it los} is the line-of-sight (minus systemic) velocity, ΣΣ\Sigma is the surface brightness, hh is an arbitrary weighting function and (X,Y)𝑋𝑌(X,Y) are coordinates on the sky, centered on the galaxy, along the disc’s apparent major and minor axes, respectively. Slit observations are equivalent to h(Y)δ(YY𝑠𝑙𝑖𝑡)proportional-to𝑌𝛿𝑌subscript𝑌𝑠𝑙𝑖𝑡h(Y)\propto\delta(Y-Y_{\it slit}). Application of Eqn. 1 presents three main difficulties:

  1. 1.

    Centering errors. As was already recognized by Tremaine & Weinberg (1984), small errors in identifying either the center or the systemic velocity of the galaxy can significantly affect the value of ΩpsubscriptΩ𝑝\Omega_{p} obtained. Noting that most SB galaxies are nearly point-symmetric about their centers, Tremaine & Weinberg (1984) suggested using a weighting function which is odd in Y𝑌Y to counter this problem. Merrifield & Kuijken (1995) used a different, and somewhat better, strategy. Noting that the integrals in Eqn. 1 represent luminosity-weighted averages, they rewrote Eqn. 1 as:

    Ωpsini(𝒳Xc)=𝒱Vsys,subscriptΩ𝑝𝑖𝒳subscript𝑋𝑐𝒱subscript𝑉𝑠𝑦𝑠\Omega_{p}\sin i({\cal X}-X_{c})={\cal V}-V_{sys}, (2)

    where 𝒱𝒱{\cal V} and 𝒳𝒳{\cal X} are the luminosity-weighted averages relative to an arbitrary frame, in which the galaxy center is (Xc,Yc)subscript𝑋𝑐subscript𝑌𝑐(X_{c},Y_{c}) and the systemic velocity is Vsyssubscript𝑉𝑠𝑦𝑠V_{sys}. Plotting 𝒱𝒱{\cal V} against 𝒳𝒳{\cal X} then gives a straight line with slope ΩpsinisubscriptΩ𝑝𝑖\Omega_{p}\sin i. With this approach, the problem of centering errors becomes one of fixing an arbitrary reference position and velocity frame common to all the slits, which in general is much easier to achieve.

  2. 2.

    Small signal-to-noise ratios. 𝒱𝒱{\cal V} and 𝒳𝒳{\cal X} measure differences across X=0𝑋0X=0 and are, therefore, susceptible to noise. This is particularly true for 𝒱𝒱{\cal V}, for which the non-axisymmetric part of V𝑙𝑜𝑠subscript𝑉𝑙𝑜𝑠V_{\it los} is not much larger than typical measurement errors. Merrifield & Kuijken (1995) overcame this problem by projecting their slit spectra along the spatial direction thereby increasing the signal-to-noise ratio of 𝒱𝒱{\cal V} significantly. This projection amounts to carrying out the required velocity integral directly in photon space. The signal in 𝒳𝒳{\cal X} is typically much better constrained, since bars tend to be bright.

  3. 3.

    Sensitivity to errors in the disc’s position angle. This was first recognized by Debattista & Williams (2002). They used two-dimensional Fabry-Perot absorption-line spectroscopy of NGC 7079 to show that small errors in the derived position angle (PA) of the disc translate into large errors in ΩpsubscriptΩ𝑝\Omega_{p}. For example, for NGC 7079, they found that an error of as little as 5superscript55^{\circ} in the disc PA would result in an error of 100%percent100100\% in ΩpsubscriptΩ𝑝\Omega_{p}. Since the uncertainties in published values of PA for disc galaxies are often at the 5superscript55^{\circ} level, each application of the TW method requires careful measurement of the disc PA. Highly inclined galaxies and galaxies in which the bar is at about 45superscript4545^{\circ} to the disc major axis, are less sensitive to errors in disc PA. We note that past applications of the TW method using slits have been to well studied galaxies (Merrifield & Kuijken 1995; Gerssen et al. 1998), so that it is very unlikely that large errors of this type were introduced.

In this work, we have followed the prescriptions of Merrifield & Kuijken (1995) to deal with the centering and signal-to-noise problems. We dealt with the sensitivity to errors in disc PA by obtaining deep surface photometry of NGC 1023 in advance of the spectroscopy.

3 Global properties of NGC 1023

NGC 1023 (UGC 2154) is a highly-inclined lenticular galaxy classified as SB0 by Nilson (1973), as SB01(5) by Sandage & Tammann (1981), and as SB0-(rs) by de Vaucouleurs et al. (1991, hereafter RC3). Its total B𝐵B-band magnitude is BT=10.35subscript𝐵𝑇10.35B_{T}=10.35 (RC3), which, after correcting for inclination and extinction, corresponds to MBT0=19.96superscriptsubscript𝑀subscript𝐵𝑇019.96M_{B_{T}}^{0}=-19.96 for an adopted distance of 10.210.210.2 Mpc (Faber et al. 1997; H0=80subscript𝐻080H_{0}=80 kms1Mpc1k𝑚superscript𝑠1𝑀𝑝superscript𝑐1\mathrm{k}m\;s^{-1}\,Mpc^{-1}).

NGC 1023 is the brightest member of the LGG 70 group (Garcia 1993). Its closest companion, designated NGC 1023A by Hart et al. (1980), is a low luminosity condensation located near the eastern end of the major axis. The centers of the two objects are separated by an angular distance of 2.7superscriptitalic-.272\aas@@fstack{\prime}7 (RC3), corresponding to a projected linear distance of about 888 kpc at 10.2 Mpc. The proximity of NGC 1023A to NGC 1023 led Arp (1966) to include NGC 1023 in the section of his Atlas of Peculiar Galaxies (Plate 135) devoted to E-like galaxies with nearby fragments. NGC 1023A was recognized as an individual galaxy by Barbon & Capaccioli (1975) and classified as Magellanic irregular or late-type dwarf galaxy by Capaccioli, Lorenz & Afanasiev (1986). High resolution radio observations by Sancisi et al. (1984) found a complex structure and kinematics for the neutral hydrogen. Most of it was shown to be outside of the galaxy and consists of tails and bridges connecting NGC 1023 to three companions, including NGC 1023A. This morphology suggests an interaction with NGC 1023A, a conclusion also reached by Capaccioli et al. (1986). Although it is rich in neutral hydrogen, NGC 1023 is undetected in ionized (Pogge & Eskridge 1993; Sánchez-Portal et al. 2000) and molecular gas (Sofue et al. 1993; Taniguchi et al. 1994), making application of the TW method to it possible.

Surface photometry of NGC 1023 has been obtained in several optical (e.g., Barbon & Capaccioli 1975; Kormendy 1985; Lauer et al. 1995; Sánchez-Portal et al. 2000; Bower et al. 2001) and near-infrared bands (Möllenhoff & Heidt 2001). Detailed stellar kinematics have been measured by Simien & Prugniel (1997, PA=87,177PAsuperscript87superscript177\rm PA=87^{\circ},177^{\circ}), Neistein et al. (1999, PA=87PAsuperscript87\rm PA=87^{\circ}), and recently by Bower et al. (2001, PA=0,45,90PAsuperscript0superscript45superscript90\rm PA=0^{\circ},45^{\circ},90^{\circ}), who inferred the presence of a supermassive black hole of 4×1074superscript1074\times 10^{7} M by three-integral, axisymmetric modelling. Sil’chenko (1999) observed the circumnuclear region of NGC 1023 via two-dimensional spectroscopy, disentangling a kinematically and chemically decoupled stellar disc (with a radius of 80 pc). The stars of this nuclear disc have a mean age of 7 Gyr and are substantially younger than the rest of the galaxy, which is characterized by extremely red integrated colours (RC3) and without global star formation (Pogge & Eskridge 1993).

4 Surface Photometry and Data Reduction

4.1 Observations and reduction

We observed NGC 1023 during December 27-28, 2000 at the 1-m Jacobus Kapteyn Telescope (JKT) located at the Roque de los Muchachos Observatory (ORM), La Palma. The detector consisted of a SITe2 device, with 2048×2048204820482048\times 2048 pixels and an image scale of 0.330\aas@@fstack{\prime\prime}33 pixel-1, giving an unvignetted field of view of about 10×10superscript10superscript1010^{\prime}\times 10^{\prime}. The seeing during the observing run varied from 1′′superscript1′′1^{\prime\prime} to 1.51\aas@@fstack{\prime\prime}5. Tab. LABEL:tab:log_photometry gives the log of the photometric observations. The galaxy was imaged using the Harris B𝐵B, V𝑉V and I𝐼I bandpasses. Deep observations were taken in all filters, reaching μI22similar-to-or-equalssubscript𝜇𝐼22\mu_{I}\simeq 22 mag arcsec-2 and μB24similar-to-or-equalssubscript𝜇𝐵24\mu_{B}\simeq 24 mag arcsec-2.

Table 1: Log of the surface photometry observations
Filter Date texp
(s)
B𝐵B 27 Dec 2000 3×90039003\times 900
28 Dec 2000 900900900
V𝑉V 28 Dec 2000 4×48044804\times 480
I𝐼I 27 Dec 2000 20×1802018020\times 180
28 Dec 2000 10×1801018010\times 180

The images were reduced using standard IRAF111IRAF is distributed by NOAO, which is operated by AURA Inc., under contract with the National Science Foundation tasks. A run of 10 bias images was obtained each night, which were combined into a single bias frame and subtracted from the object frames. The images were flat-fielded using sky flats taken in all filters at the beginning and end of each observing night. The sky background level was removed by fitting a second order polynomial to the regions free of sources in the images.

For the photometric calibration of the galaxies, standard stars of known magnitudes were observed. The calibration constant includes corrections for atmospheric and Galactic extinction, and a colour term. No attempt was made to correct for internal extinction. The atmospheric extinction was taken from the differential aerosol extinction for the ORM (King 1985). The Galactic extinction in the B𝐵B-band was taken from Schlegel et al. (1998). We used the Galactic extinction law from Cardelli et al. (1989) in order to get the extinction in the other filters.

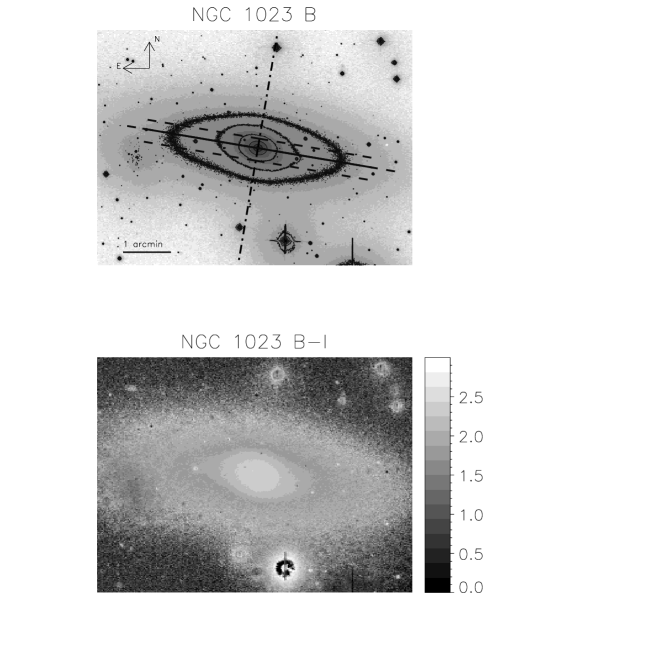
Fig. 1 shows the reduced image of the galaxy in the B𝐵B-band and the BI𝐵𝐼B-I colour map image.

Refer to caption
Figure 1: The B𝐵B-band image (top) and BI𝐵𝐼B-I colour map (bottom) of NGC 1023. In the B𝐵B-band image, the overplotted full line is the major axis (PA =80.2absentsuperscriptitalic-.802=80\aas@@fstack{\circ}2), while the minor axis is indicated by the dot-dashed line. The offset slits, parallel to the major axis and shifted by 12′′superscript12′′12^{\prime\prime} to the north and 16′′superscript16′′16^{\prime\prime} to the south, are shown by dashed lines. The companion galaxy NGC 1023A can be seen to the east, just south of the major axis. The contour levels shows are μB=18subscript𝜇𝐵18\mu_{B}=18 to 22 mag arcsec-2, at unit intervals, with the outermost contour being μB=22subscript𝜇𝐵22\mu_{B}=22 mag arcsec-2. The BI𝐵𝐼B-I map shows that the strongest colour variations are associated with the bulge (which is red) and NGC 1023A (which is blue).

4.2 Isophotal analysis and bar length

We analysed the isophotal profiles of the galaxy by masking NGC 1023A and the foreground stars, then fitting ellipses using the IRAF task ELLIPSE. We first allowed the centers of the ellipses to vary, to test whether the optical disc is disturbed. Within the errors of the fits, we found no evidence of a varying center. Thus the inner disc of NGC 1023 has had enough time to settle if it had been disturbed in the tidal interaction suggested by the H I. The ellipse fits were therefore repeated with the ellipse centers fixed; the resulting azimuthally averaged surface brightness, BI𝐵𝐼B-I colour, ellipticity and PA profiles are plotted in Fig. 2. These are in good agreement with the surface photometry of Sánchez-Portal et al. (2000), although our surface photometry reaches fainter surface brightness. The PA and ellipticity profiles are similar for all bandpasses, suggesting that there is little, or uniform, obscuration, as required for the TW method. Furthermore, at large radii, the BI𝐵𝐼B-I profile (see Fig. 2) is flat, which is further evidence of little obscuration. The only structure seen in the BI𝐵𝐼B-I profile is a small gradient in the region where the bulge and bar dominate. This gradient is in the sense of a bulge redder than the disc, which is most likely caused by an age difference between the bulge and disc stellar populations. There is also a small colour gradient in the bar region, but the color variation is not patchy and is therefore unlikely to be caused by dust. We fitted the PA and inclination of the disc by averaging the I𝐼I-band data at semi-major axis greater than 80′′superscript80′′80^{\prime\prime}, finding PA =80.2±0.5absentplus-or-minussuperscriptitalic-.802superscriptitalic-.05=80\aas@@fstack{\circ}2\pm 0\aas@@fstack{\circ}5 and i=66.4±1.2𝑖plus-or-minussuperscriptitalic-.664superscriptitalic-.12i=66\aas@@fstack{\circ}4\pm 1\aas@@fstack{\circ}2. Application of the TW method generally requires a PA measured to 5similar-toabsentsuperscript5\sim 5^{\circ} accuracy (Debattista & Williams 2002); we note that the value of the PA given in the RC3 is 87superscript8787^{\circ}. Our value of the PA is in very good agreement with that measured by Möllenhoff & Heidt (2001), who found PA =79.15absentsuperscriptitalic-.7915=79\aas@@fstack{\circ}15 in the J𝐽J-band, 80.42superscriptitalic-.804280\aas@@fstack{\circ}42 in the H𝐻H-band, and 78.84superscriptitalic-.788478\aas@@fstack{\circ}84 in the K𝐾K-band, for an average of 79.5±0.7plus-or-minussuperscriptitalic-.795superscriptitalic-.0779\aas@@fstack{\circ}5\pm 0\aas@@fstack{\circ}7.

We measured the disc exponential scale-length, Rdsubscript𝑅𝑑R_{d}, from our I𝐼I-band surface photometry in the region outside the bar (R80′′𝑅superscript80′′R\geq 80^{\prime\prime}). We obtained Rd=59′′subscript𝑅𝑑superscript59′′R_{d}=59^{\prime\prime}, corresponding to 2.9 kpc at our assumed distance.

Refer to caption
Figure 2: Surface brightness (top-left), colour (top-right), ellipticity (center-left) and PA (center-right) radial profiles of the ellipse fits to the isophotes of NGC 1023. The full, dotted and dashed lines show results for I𝐼I, V𝑉V and B𝐵B-bands respectively. The bottom two panels show the Ilimit-from𝐼I-band ellipticity (left) and PA (right) for R80′′𝑅superscript80′′R\geq 80^{\prime\prime}, which we averaged to determine the disc’s inclination and PA. The solid lines represent the average values in this range: ϵ=0.595italic-ϵ0.595\epsilon=0.595 (corresponding to i=66.4𝑖superscriptitalic-.664i=66\aas@@fstack{\circ}4) and PA =80.2absentsuperscriptitalic-.802=80\aas@@fstack{\circ}2.
Refer to caption
Figure 3: Fourier analysis of the deprojected I𝐼I-band light distribution of NGC 1023. The top-left panel shows the relative amplitudes of the m=1𝑚1m=1 to m=4𝑚4m=4 Fourier components, which reveals that m=2𝑚2m=2 dominates. The top-right panel shows the phase angle of the m=2𝑚2m=2 Fourier component; inside R30′′similar-to-or-equals𝑅superscript30′′R\simeq 30^{\prime\prime}, the system is clearly dominated by the spheroidal bulge, which deprojects into a feature along the minor axis. In the range 50′′<R<70′′<superscript50′′𝑅<superscript70′′50^{\prime\prime}\mathrel{\hbox to0.0pt{\lower 2.15277pt\hbox{$\mathchar 536\relax$}\hss}\raise 1.72218pt\hbox{$\mathchar 316\relax$}}R\mathrel{\hbox to0.0pt{\lower 2.15277pt\hbox{$\mathchar 536\relax$}\hss}\raise 1.72218pt\hbox{$\mathchar 316\relax$}}70^{\prime\prime}, θ2subscript𝜃2\theta_{2} reaches a minimum of 65similar-toabsentsuperscript65\sim 65^{\circ}, but is not constant anywhere. The panel on the bottom-left shows the bar/inter-bar intensity ratio. The dashed line indicates one-half of the peak intensity (excluding the peak at R<30′′𝑅superscript30′′R<30^{\prime\prime} since this is an artifact of the bulge deprojection). The panel at bottom-right shows an alternative measure of aBsubscript𝑎𝐵a_{B}, based on the deprojected ellipticities, ϵsuperscriptitalic-ϵ\epsilon^{\prime}; the sharp break in ϵsuperscriptitalic-ϵ\epsilon^{\prime} at semi-major axis 69′′similar-to-or-equalsabsentsuperscript69′′\simeq 69^{\prime\prime} (indicated by the vertical dashed line) is identified as aBsubscript𝑎𝐵a_{B}. In this panel, the upper, central and lower set of points correspond to a deprojection assuming i=𝑖absenti= 65.2superscriptitalic-.65265\aas@@fstack{\circ}2, 66.4superscriptitalic-.66466\aas@@fstack{\circ}4 and 67.6superscriptitalic-.67667\aas@@fstack{\circ}6 respectively.

The most natural way to measure aBsubscript𝑎𝐵a_{B} is with a Fourier analysis of the azimuthal luminosity profile (Ohta et al. 1990; Aguerri et al. 2000), which we have applied here. We began by deprojecting the I𝐼I-band image of the galaxy by a flux-conserving stretch along the minor axis by the factor 1/cosi1𝑖1/\cos i. NGC 1023 contains a significant spheroidal bulge: the bulge-disc model decompositions of Möllenhoff & Heidt (2001) for this galaxy have a bulge that accounts for about 30%percent3030\% to 50%percent5050\% of the near-infrared light. Since we have not attempted to subtract the bulge, we expect that, in deprojection, it appears as a structure elongated with the minor axis, dominating the center of the galaxy. We then decomposed the deprojected luminosity profile, I(R,ϕ)𝐼𝑅italic-ϕI(R,\phi), where (R,ϕ)𝑅italic-ϕ(R,\phi) are plane polar coordinates in the galaxy frame, into a Fourier series:

I(R,ϕ)=A0(R)2+m=1(Am(R)cos(mϕ)+Bm(R)sin(mϕ))𝐼𝑅italic-ϕsubscript𝐴0𝑅2superscriptsubscript𝑚1subscript𝐴𝑚𝑅𝑚italic-ϕsubscript𝐵𝑚𝑅𝑚italic-ϕI(R,\phi)=\frac{A_{0}(R)}{2}+\sum_{m=1}^{\infty}(A_{m}(R)\cos(m\phi)+B_{m}(R)\sin(m\phi)) (3)

where the coefficients are defined by:

Am(R)=1π02πI(R,ϕ)cos(mϕ)𝑑ϕsubscript𝐴𝑚𝑅1𝜋subscriptsuperscript2𝜋0𝐼𝑅italic-ϕ𝑚italic-ϕdifferential-ditalic-ϕA_{m}(R)=\frac{1}{\pi}\int^{2\pi}_{0}I(R,\phi)\cos(m\phi)d\phi (4)

and

Bm(R)=1π02πI(R,ϕ)sin(mϕ)𝑑ϕsubscript𝐵𝑚𝑅1𝜋subscriptsuperscript2𝜋0𝐼𝑅italic-ϕ𝑚italic-ϕdifferential-ditalic-ϕB_{m}(R)=\frac{1}{\pi}\int^{2\pi}_{0}I(R,\phi)\sin(m\phi)d\phi (5)

The Fourier amplitude of the m𝑚m-th component is defined as:

Im(R)={A0(R)/2m=0Am2(R)+Bm2(R)m0subscript𝐼𝑚𝑅casessubscript𝐴0𝑅2𝑚0otherwiseotherwisesuperscriptsubscript𝐴𝑚2𝑅superscriptsubscript𝐵𝑚2𝑅𝑚0I_{m}(R)=\cases{\displaystyle A_{0}(R)/2&$m=0$\cr\cr\sqrt{A_{m}^{2}(R)+B_{m}^{2}(R)}&$m\neq 0$\cr} (6)

Fig. 3 shows the first (m=1,2,3,4𝑚1234m=1,2,3,4) relative Fourier amplitudes, Im/I0subscript𝐼𝑚subscript𝐼0I_{m}/I_{0}, of the I𝐼I-band image as a function of R𝑅R. The bar is evidenced by a strong m=2𝑚2m=2 component. Fig. 3 also shows the bar/inter-bar intensity as a function of R𝑅R. The bar intensity, Ibsubscript𝐼𝑏I_{b}, is defined as the sum of the even Fourier components, I0+I2subscript𝐼0subscript𝐼2I_{0}+I_{2}, while the inter-bar intensity, Iibsubscript𝐼𝑖𝑏I_{ib}, is given by I0I2subscript𝐼0subscript𝐼2I_{0}-I_{2} (Ohta et al. 1990; Elmegreen & Elmegreen 1990; Aguerri et al. 2000). Ohta et al. (1990) arbitrarily defined aBsubscript𝑎𝐵a_{B} as the outer radius for which Ib/Iib=2subscript𝐼𝑏subscript𝐼𝑖𝑏2I_{b}/I_{ib}=2; as Aguerri et al. (2000) pointed out, a fixed value of Ib/Iibsubscript𝐼𝑏subscript𝐼𝑖𝑏I_{b}/I_{ib} cannot account for the wide variety of bar luminosities present in galaxies. Instead, Aguerri et al. (2000) defined aBsubscript𝑎𝐵a_{B} as the full width at half maximum (FWHM) of the curve of Ib/Iibsubscript𝐼𝑏subscript𝐼𝑖𝑏I_{b}/I_{ib}. Using this definition, but excluding the peak in Ib/Iibsubscript𝐼𝑏subscript𝐼𝑖𝑏I_{b}/I_{ib} resulting from the deprojected bulge, we obtain aB=69′′±5′′subscript𝑎𝐵plus-or-minussuperscript69′′superscript5′′a_{B}=69^{\prime\prime}\pm 5^{\prime\prime}. The phase angle, θ2(R)=tan1(A2(R)/B2(R))subscript𝜃2𝑅superscript1subscript𝐴2𝑅subscript𝐵2𝑅\theta_{2}(R)=\tan^{-1}(A_{2}(R)/B_{2}(R)), of the m=2𝑚2m=2 component is shown in Fig. 3. The bulge dominates in the inner 20′′superscript20′′20^{\prime\prime} (with θ290subscript𝜃2superscript90\theta_{2}\approx 90^{\circ}, as expected), with a transition from bulge to bar occurring in the range 20′′<R<50′′<superscript20′′𝑅<superscript50′′20^{\prime\prime}\mathrel{\hbox to0.0pt{\lower 2.15277pt\hbox{$\mathchar 536\relax$}\hss}\raise 1.72218pt\hbox{$\mathchar 316\relax$}}R\mathrel{\hbox to0.0pt{\lower 2.15277pt\hbox{$\mathchar 536\relax$}\hss}\raise 1.72218pt\hbox{$\mathchar 316\relax$}}50^{\prime\prime}. In the region 50′′<R<70′′<superscript50′′𝑅<superscript70′′50^{\prime\prime}\mathrel{\hbox to0.0pt{\lower 2.15277pt\hbox{$\mathchar 536\relax$}\hss}\raise 1.72218pt\hbox{$\mathchar 316\relax$}}R\mathrel{\hbox to0.0pt{\lower 2.15277pt\hbox{$\mathchar 536\relax$}\hss}\raise 1.72218pt\hbox{$\mathchar 316\relax$}}70^{\prime\prime}, θ2subscript𝜃2\theta_{2} has a minimum, implying the bar extends to somewhere here. However, θ2subscript𝜃2\theta_{2} is not constant, because of the influence of the bulge and the disc, and it cannot be used to determine aBsubscript𝑎𝐵a_{B}.

A independent measure of aBsubscript𝑎𝐵a_{B} was obtained by deprojecting the ellipses which best fit the isophotes, averaging over the three bands, and examining the deprojected ellipticity, ϵsuperscriptitalic-ϵ\epsilon^{\prime}, as shown in Fig. 3. We find a sharp break in the slope of ϵsuperscriptitalic-ϵ\epsilon^{\prime} at 69′′±3′′plus-or-minussuperscript69′′superscript3′′69^{\prime\prime}\pm 3^{\prime\prime}, which we identify as the end of the bar. We repeated this experiment, deprojecting with different i𝑖i and PA within the standard errors of these quantities. The errors in PA do not significantly change the semi-major axis at which the break occurs, while those in i𝑖i lead to changes in the break semi-major axis of 3′′similar-toabsentsuperscript3′′\sim 3^{\prime\prime}. Thus, our second estimate of aB=69′′±4′′subscript𝑎𝐵plus-or-minussuperscript69′′superscript4′′a_{B}=69^{\prime\prime}\pm 4^{\prime\prime}. Fig. 4 plots the projected and deprojected ellipses, from which the change at semi-major axis 70′′similar-toabsentsuperscript70′′\sim 70^{\prime\prime} can be discerned.

Outside the inner 5′′superscript5′′5^{\prime\prime}, the largest twist due to the bar of the isophotes away from the sky-plane major axis is only 8similar-to-or-equalsabsentsuperscript8\simeq 8^{\circ}, which occurs at 40′′superscript40′′40^{\prime\prime}. We measured the bar’s intrinsic angle from the major axis, ψbarsubscript𝜓bar\psi_{\rm bar}, in the radial range 55′′superscript55′′55^{\prime\prime} to 70′′superscript70′′70^{\prime\prime}, averaged over the 3 bands. Due to the contamination from the bulge, the deprojected isophotal ellipses are not constant in this range, so we used as the uncertainty in ψbarsubscript𝜓bar\psi_{\rm bar} the largest deviation from the average. Thus we obtained ψbar=102±2subscript𝜓barplus-or-minus102superscript2\psi_{\rm bar}=102\pm 2^{\circ}, so that the bar is only some 12superscript1212^{\circ} from the minor axis, as can be seen in Fig. 4. This bar orientation, together with the large inclination and strong bulge, tend to obstruct our view of the bar. In this sense, NGC 1023 is not an ideal candidate for the TW method, and the expected values of 𝒱𝒱{\cal V} and 𝒳𝒳{\cal X} are likely to be small, as we show in §6. For this combination of inclination and ψbarsubscript𝜓bar\psi_{\rm bar}, Debattista (2002) suggests an accuracy of 2.5similar-toabsentsuperscriptitalic-.25\sim 2\aas@@fstack{\circ}5 in PA is required for accurate measurement of ΩpsubscriptΩ𝑝\Omega_{p}.

Refer to caption
Figure 4: Best-fitting ellipses to the I𝐼I-band isophotes (a) before and (b) after deprojection to the NGC 1023 disc plane (i=66.4𝑖superscriptitalic-.664i=66\aas@@fstack{\circ}4 and PA=80.2absentsuperscriptitalic-.802=80\aas@@fstack{\circ}2). The system has been rotated so that the disc major axis is horizontal. Bold-line ellipses have deprojected semi-major axes of 60′′superscript60′′60^{\prime\prime}, 70′′superscript70′′70^{\prime\prime} and 80′′superscript80′′80^{\prime\prime}; the straight lines indicate the major axes of these 3 ellipses.

5 Long-slit spectroscopy

5.1 Observations and data reduction

The spectroscopic observations of NGC 1023 were carried out at the ORM in La Palma, with the 3.6-m Telescopio Nazionale Galileo on February 01-02, 2001. The telescope mounted the Low Resolution Spectrograph (DOLORES). The HR-V grism No. 6 with 600 groovesmm1groovessuperscriptmm1\rm grooves\,mm^{-1} was used in combination with the 0.7×8.10\aas@@fstack{\prime\prime}7\times 8\aas@@fstack{\prime}1 slit and the thinned and back-illuminated Loral CCD with 2048× 2048204820482048\,\times\,2048 pixels of 15× 15151515\,\times\,15 μm2𝜇superscriptm2\rm\mu m^{2}. The wavelength range between 4697 and 6840 Å was covered with a reciprocal dispersion of 1.055 Å pixel-1, which guarantees an adequate oversampling of the instrumental broadening function. Indeed, the instrumental resolution, obtained by measuring the width of emission lines of a comparison spectrum after the wavelength calibration, was 3.103.103.10 Å (FWHM). This corresponds to an instrumental dispersion σ=1.32𝜎1.32\sigma=1.32 Å (i.e., 80similar-toabsent80\sim 80 and 60similar-toabsent60\sim 60 kms1k𝑚superscript𝑠1\mathrm{k}m\;s^{-1} at the blue and red edges of the spectra, respectively). The angular sampling was 0.2750\aas@@fstack{\prime\prime}275 pixel-1.

We obtained two 30-minutes spectra with the slit along the major axis (PA=80PAsuperscript80\rm PA=80^{\circ}) and two offset spectra with the slit parallel to the major axis and shifted by 12′′superscript12′′12^{\prime\prime} northward and 16′′superscript16′′16^{\prime\prime} southward. The exposure time of each offset spectrum was 60 minutes. During the observing run, we took spectra of the giant stars HR 2035 (G8III), HR 2429 (K1III), HR 2503 (K4III), HR 2701 (K0III), and HR 5370 (K3III) to use as templates in measuring the stellar kinematics. At the beginning of each exposure, the slit was positioned by acquiring with DOLORES a series of target images. A spectrum of the comparison helium arc lamp was taken after each target exposure to allow an accurate wavelength calibration. The value of the seeing FWHM during the galaxy exposures ranged between 0.70\aas@@fstack{\prime\prime}7 and 1.01\aas@@fstack{\prime\prime}0 as measured by fitting a two-dimensional Gaussian to the guide star.

Refer to caption
Figure 5: Stellar kinematics of NGC 1023. Each column shows the radial profiles of the four Gauss-Hermite moments (V,σ,h3𝑉𝜎subscript3V,\sigma,h_{3} and h4subscript4h_{4}) we measured along a given slit position. In the top panels the horizontal dashed line indicates the heliocentric systemic velocity of the NGC 1023. All velocities are plotted as observed, without correcting for the inclination. The full data are given in Tab. LABEL:tab:kinematics.

All the spectra were bias subtracted, flatfield corrected, cleaned of cosmic rays, and wavelength calibrated using standard MIDAS222MIDAS is developed and maintained by the European Southern Observatory routines. The bias level was determined from the bias frames obtained during the observing nights to check the CCD status. The flatfield correction was performed by means of both quartz lamp and twilight sky spectra, which were normalized and divided into all the spectra, to correct for pixel-to-pixel sensitivity variations and large-scale illumination patterns due to slit vignetting. Cosmic rays were identified by comparing the counts in each pixel with the local mean and standard deviation (as obtained from Poisson statistics by taking into account the gain and read-out noise of the detector) and then corrected by interpolating over. The residual cosmic rays were corrected by manually editing the spectra. The wavelength calibration was performed by means of the MIDAS package XLONG. Each spectrum was rebinned using the wavelength solution obtained from the corresponding arc-lamp spectrum. We checked that the wavelength rebinning had been done properly by measuring the difference between the measured and predicted wavelengths (Osterbrock et al. 1996) for the brightest night-sky emission lines in the observed spectral range. The resulting accuracy in the wavelength calibration is 1similar-toabsent1\sim 1 kms1k𝑚superscript𝑠1\mathrm{k}m\;s^{-1}. The major-axis spectra were co-added using the center of the stellar continuum as reference. In the resulting spectra, the contribution of the sky was determined by interpolating along the outermost 20′′superscript20′′20^{\prime\prime} at the two edges of the slit, where the galaxy light was negligible, and then subtracted.

5.2 Stellar kinematics

Refer to caption
Figure 6: Galaxy spectra (thick lines), obtained by collapsing along the spatial direction, of the major axis and the two offset positions. They are compared with the template spectra (thin line) convolved with their corresponding LOSVDs. Galaxy and template spectra have been continuum subtracted and tapered at the ends with a cosine bell function.

We measured the stellar kinematics from the galaxy absorption features present in the wavelength range running from 4697 Å to 5570 Å and centered on the Mg line triplet (λλ 5164,5173,5184𝜆𝜆516451735184\lambda\lambda\,5164,5173,5184 Å). The spectra were rebinned along the spatial direction to obtain a nearly constant signal-to-noise ratio larger than 20 per resolution element (with a peak of 50 in the innermost regions of the major axis spectrum). At the outermost radii the signal-to-noise ratio decreases to 10similar-toabsent10\sim 10. The galaxy continuum was removed row-by-row by fitting a fourth to sixth order polynomial.

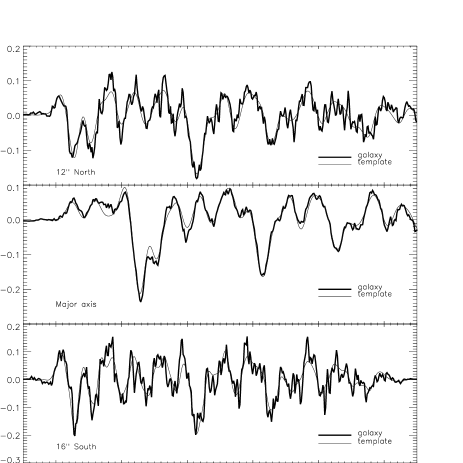
We used the Fourier Correlation Quotient method (FCQ, Bender 1990) following the prescriptions of Bender, Saglia & Gerhard (1994) and adopting HR 2035 as kinematical template. This allowed us to derive, for each spectrum, the line-of-sight velocity distribution (LOSVD) along the slit and to measure its moments, namely the radial velocity v𝑣v, the velocity dispersion σ𝜎\sigma and the values of the coefficients h3subscript3h_{3} and h4subscript4h_{4}. At each radius, they have been derived by fitting the LOSVD with a Gaussian plus third- and fourth-order Gauss-Hermite polynomials H3subscript𝐻3H_{3} and H4subscript𝐻4H_{4}, which describe the asymmetric and symmetric deviations of the LOSVD from a pure Gaussian profile (van der Marel & Franx 1993; Gerhard 1993). We derived errors on the LOSVD moments from photon statistics and CCD read-out noise, calibrating them by Monte Carlo simulations as done by Bender et al. (1994) and Bower et al. (2001), who have recently derived the stellar kinematics of this galaxy along three axes (different from ours). In general, our errors are in the range of 10–20 kms1k𝑚superscript𝑠1\mathrm{k}m\;s^{-1} for v𝑣v and σ𝜎\sigma, and of 0.03–0.1 for h3subscript3h_{3} and h4subscript4h_{4}, becoming larger for signal-to-noise ratios lower than 202020. These errors do not take into account possible systematic effects due to any template mismatch. The measured stellar kinematics along the major and the offset axes are reported in Tab. LABEL:tab:kinematics and plotted in Fig. 5.

Table 2: Stellar kinematics of NGC 1023. This data is plotted in Fig. 5.
r𝑟r v𝑣v σ𝜎\sigma h3subscript3h_{3} h4subscript4h_{4} r𝑟r v𝑣v σ𝜎\sigma h3subscript3h_{3} h4subscript4h_{4}
[′′] [km s-1] [km s-1] [′′] [km s-1] [km s-1]
25.8925.8925.89 497.4±16.8plus-or-minus497.416.8497.4\pm 16.8 164.7±18.2plus-or-minus164.718.2164.7\pm 18.2 0.068±0.091plus-or-minus0.0680.0910.068\pm 0.091 0.044±0.106plus-or-minus0.0440.106-0.044\pm 0.106
Major Axis 31.2031.2031.20 475.4±18.1plus-or-minus475.418.1475.4\pm 18.1 137.7±15.5plus-or-minus137.715.5137.7\pm 15.5 0.063±0.136plus-or-minus0.0630.1360.063\pm 0.136 0.072±0.128plus-or-minus0.0720.128-0.072\pm 0.128
38.2538.2538.25 438.6±15.5plus-or-minus438.615.5438.6\pm 15.5 115.9±11.8plus-or-minus115.911.8115.9\pm 11.8 0.082±0.127plus-or-minus0.0820.1270.082\pm 0.127 0.067±0.107plus-or-minus0.0670.107-0.067\pm 0.107
108.76108.76-108.76 852.3±42.5plus-or-minus852.342.5852.3\pm 42.5 95.8±27.9plus-or-minus95.827.995.8\pm 27.9 0.090±0.232plus-or-minus0.0900.232-0.090\pm 0.232 0.365±0.200plus-or-minus0.3650.200-0.365\pm 0.200 48.3848.3848.38 430.4±11.4plus-or-minus430.411.4430.4\pm 11.4 82.4±9.9plus-or-minus82.49.982.4\pm 9.9 0.020±0.105plus-or-minus0.0200.105-0.020\pm 0.105 0.073±0.071plus-or-minus0.0730.071-0.073\pm 0.071
82.5682.56-82.56 834.8±28.5plus-or-minus834.828.5834.8\pm 28.5 98.1±19.2plus-or-minus98.119.298.1\pm 19.2 0.109±0.200plus-or-minus0.1090.200-0.109\pm 0.200 0.171±0.271plus-or-minus0.1710.271-0.171\pm 0.271 64.3364.3364.33 403.5±19.9plus-or-minus403.519.9403.5\pm 19.9 85.2±13.6plus-or-minus85.213.685.2\pm 13.6 0.119±0.165plus-or-minus0.1190.1650.119\pm 0.165 0.148±0.130plus-or-minus0.1480.130-0.148\pm 0.130
59.3359.33-59.33 791.9±24.5plus-or-minus791.924.5791.9\pm 24.5 114.1±20.2plus-or-minus114.120.2114.1\pm 20.2 0.040±0.194plus-or-minus0.0400.194-0.040\pm 0.194 0.060±0.103plus-or-minus0.0600.103-0.060\pm 0.103 89.2989.2989.29 407.5±28.0plus-or-minus407.528.0407.5\pm 28.0 92.6±19.0plus-or-minus92.619.092.6\pm 19.0 0.148±0.199plus-or-minus0.1480.1990.148\pm 0.199 0.161±0.327plus-or-minus0.1610.327-0.161\pm 0.327
45.8245.82-45.82 808.1±18.5plus-or-minus808.118.5808.1\pm 18.5 107.3±15.4plus-or-minus107.315.4107.3\pm 15.4 0.091±0.150plus-or-minus0.0910.150-0.091\pm 0.150 0.085±0.118plus-or-minus0.0850.118-0.085\pm 0.118 112.90112.90112.90 392.2±45.5plus-or-minus392.245.5392.2\pm 45.5 84.7±30.8plus-or-minus84.730.884.7\pm 30.8 0.311±0.277plus-or-minus0.3110.2770.311\pm 0.277 0.172±0.356plus-or-minus0.1720.356-0.172\pm 0.356
36.6236.62-36.62 783.6±16.4plus-or-minus783.616.4783.6\pm 16.4 123.6±13.2plus-or-minus123.613.2123.6\pm 13.2 0.040±0.151plus-or-minus0.0400.151-0.040\pm 0.151 0.053±0.123plus-or-minus0.0530.123-0.053\pm 0.123
29.9929.99-29.99 738.7±19.4plus-or-minus738.719.4738.7\pm 19.4 154.1±16.2plus-or-minus154.116.2154.1\pm 16.2 0.063±0.112plus-or-minus0.0630.112-0.063\pm 0.112 0.072±0.127plus-or-minus0.0720.127-0.072\pm 0.127 12′′superscript12′′12^{\prime\prime} North Offset
24.9324.93-24.93 725.0±15.7plus-or-minus725.015.7725.0\pm 15.7 168.3±15.2plus-or-minus168.315.2168.3\pm 15.2 0.046±0.078plus-or-minus0.0460.0780.046\pm 0.078 0.082±0.099plus-or-minus0.0820.099-0.082\pm 0.099
20.9820.98-20.98 720.3±17.7plus-or-minus720.317.7720.3\pm 17.7 164.9±18.3plus-or-minus164.918.3164.9\pm 18.3 0.019±0.066plus-or-minus0.0190.066-0.019\pm 0.066 0.003±0.104plus-or-minus0.0030.104-0.003\pm 0.104 78.3578.35-78.35 814.6±41.8plus-or-minus814.641.8814.6\pm 41.8 121.2±50.2plus-or-minus121.250.2121.2\pm 50.2 0.057±0.233plus-or-minus0.0570.233-0.057\pm 0.233 0.073±0.231plus-or-minus0.0730.231-0.073\pm 0.231
17.8317.83-17.83 717.0±17.0plus-or-minus717.017.0717.0\pm 17.0 164.8±14.6plus-or-minus164.814.6164.8\pm 14.6 0.023±0.086plus-or-minus0.0230.086-0.023\pm 0.086 0.104±0.114plus-or-minus0.1040.114-0.104\pm 0.114 56.4456.44-56.44 809.1±32.8plus-or-minus809.132.8809.1\pm 32.8 109.5±28.5plus-or-minus109.528.5109.5\pm 28.5 0.024±0.211plus-or-minus0.0240.2110.024\pm 0.211 0.107±0.170plus-or-minus0.1070.170-0.107\pm 0.170
15.3715.37-15.37 716.4±13.7plus-or-minus716.413.7716.4\pm 13.7 166.8±14.1plus-or-minus166.814.1166.8\pm 14.1 0.047±0.064plus-or-minus0.0470.0640.047\pm 0.064 0.057±0.087plus-or-minus0.0570.087-0.057\pm 0.087 43.0743.07-43.07 760.6±30.4plus-or-minus760.630.4760.6\pm 30.4 111.4±22.5plus-or-minus111.422.5111.4\pm 22.5 0.109±0.217plus-or-minus0.1090.217-0.109\pm 0.217 0.107±0.145plus-or-minus0.1070.145-0.107\pm 0.145
13.3213.32-13.32 717.4±14.4plus-or-minus717.414.4717.4\pm 14.4 168.9±16.1plus-or-minus168.916.1168.9\pm 16.1 0.028±0.059plus-or-minus0.0280.0590.028\pm 0.059 0.012±0.086plus-or-minus0.0120.086-0.012\pm 0.086 34.8034.80-34.80 743.5±28.5plus-or-minus743.528.5743.5\pm 28.5 126.2±18.8plus-or-minus126.218.8126.2\pm 18.8 0.046±0.140plus-or-minus0.0460.1400.046\pm 0.140 0.097±0.194plus-or-minus0.0970.194-0.097\pm 0.194
11.5311.53-11.53 713.1±13.1plus-or-minus713.113.1713.1\pm 13.1 160.8±12.9plus-or-minus160.812.9160.8\pm 12.9 0.041±0.057plus-or-minus0.0410.057-0.041\pm 0.057 0.025±0.083plus-or-minus0.0250.083-0.025\pm 0.083 28.6828.68-28.68 714.1±27.6plus-or-minus714.127.6714.1\pm 27.6 125.0±17.1plus-or-minus125.017.1125.0\pm 17.1 0.020±0.137plus-or-minus0.0200.1370.020\pm 0.137 0.162±0.194plus-or-minus0.1620.194-0.162\pm 0.194
10.0210.02-10.02 703.1±12.4plus-or-minus703.112.4703.1\pm 12.4 191.4±12.3plus-or-minus191.412.3191.4\pm 12.3 0.014±0.043plus-or-minus0.0140.0430.014\pm 0.043 0.029±0.048plus-or-minus0.0290.048-0.029\pm 0.048 23.6123.61-23.61 709.2±27.1plus-or-minus709.227.1709.2\pm 27.1 118.7±21.7plus-or-minus118.721.7118.7\pm 21.7 0.014±0.168plus-or-minus0.0140.168-0.014\pm 0.168 0.079±0.206plus-or-minus0.0790.206-0.079\pm 0.206
8.798.79-8.79 685.3±12.2plus-or-minus685.312.2685.3\pm 12.2 192.1±10.5plus-or-minus192.110.5192.1\pm 10.5 0.007±0.043plus-or-minus0.0070.0430.007\pm 0.043 0.071±0.051plus-or-minus0.0710.051-0.071\pm 0.051 19.2319.23-19.23 669.9±23.6plus-or-minus669.923.6669.9\pm 23.6 154.7±17.6plus-or-minus154.717.6154.7\pm 17.6 0.078±0.122plus-or-minus0.0780.1220.078\pm 0.122 0.126±0.145plus-or-minus0.1260.145-0.126\pm 0.145
7.697.69-7.69 693.1±13.9plus-or-minus693.113.9693.1\pm 13.9 189.1±14.0plus-or-minus189.114.0189.1\pm 14.0 0.002±0.048plus-or-minus0.0020.0480.002\pm 0.048 0.030±0.056plus-or-minus0.0300.056-0.030\pm 0.056 15.3915.39-15.39 682.0±17.3plus-or-minus682.017.3682.0\pm 17.3 146.6±14.3plus-or-minus146.614.3146.6\pm 14.3 0.019±0.088plus-or-minus0.0190.0880.019\pm 0.088 0.100±0.129plus-or-minus0.1000.129-0.100\pm 0.129
6.746.74-6.74 695.1±12.2plus-or-minus695.112.2695.1\pm 12.2 191.3±11.7plus-or-minus191.311.7191.3\pm 11.7 0.010±0.041plus-or-minus0.0100.041-0.010\pm 0.041 0.024±0.045plus-or-minus0.0240.045-0.024\pm 0.045 12.1112.11-12.11 653.2±15.9plus-or-minus653.215.9653.2\pm 15.9 143.7±13.6plus-or-minus143.713.6143.7\pm 13.6 0.010±0.081plus-or-minus0.0100.0810.010\pm 0.081 0.078±0.119plus-or-minus0.0780.119-0.078\pm 0.119
5.915.91-5.91 691.8±11.0plus-or-minus691.811.0691.8\pm 11.0 173.2±12.2plus-or-minus173.212.2173.2\pm 12.2 0.019±0.043plus-or-minus0.0190.043-0.019\pm 0.043 0.001±0.058plus-or-minus0.0010.058-0.001\pm 0.058 9.229.22-9.22 650.4±19.0plus-or-minus650.419.0650.4\pm 19.0 149.4±16.8plus-or-minus149.416.8149.4\pm 16.8 0.015±0.086plus-or-minus0.0150.086-0.015\pm 0.086 0.047±0.118plus-or-minus0.0470.118-0.047\pm 0.118
5.085.08-5.08 668.9±12.9plus-or-minus668.912.9668.9\pm 12.9 191.4±12.8plus-or-minus191.412.8191.4\pm 12.8 0.024±0.043plus-or-minus0.0240.043-0.024\pm 0.043 0.017±0.048plus-or-minus0.0170.048-0.017\pm 0.048 6.496.49-6.49 636.1±17.5plus-or-minus636.117.5636.1\pm 17.5 171.1±17.5plus-or-minus171.117.5171.1\pm 17.5 0.081±0.078plus-or-minus0.0810.0780.081\pm 0.078 0.032±0.084plus-or-minus0.0320.084-0.032\pm 0.084
4.404.40-4.40 670.7±13.0plus-or-minus670.713.0670.7\pm 13.0 181.4±14.9plus-or-minus181.414.9181.4\pm 14.9 0.013±0.047plus-or-minus0.0130.0470.013\pm 0.047 0.004±0.059plus-or-minus0.0040.0590.004\pm 0.059 3.883.88-3.88 626.6±17.8plus-or-minus626.617.8626.6\pm 17.8 186.2±19.7plus-or-minus186.219.7186.2\pm 19.7 0.003±0.066plus-or-minus0.0030.0660.003\pm 0.066 0.000±0.074plus-or-minus0.0000.0740.000\pm 0.074
3.853.85-3.85 660.2±12.6plus-or-minus660.212.6660.2\pm 12.6 200.7±12.1plus-or-minus200.712.1200.7\pm 12.1 0.005±0.042plus-or-minus0.0050.042-0.005\pm 0.042 0.022±0.042plus-or-minus0.0220.042-0.022\pm 0.042 1.401.40-1.40 602.2±14.5plus-or-minus602.214.5602.2\pm 14.5 176.6±14.3plus-or-minus176.614.3176.6\pm 14.3 0.033±0.057plus-or-minus0.0330.0570.033\pm 0.057 0.028±0.069plus-or-minus0.0280.069-0.028\pm 0.069
3.303.30-3.30 665.0±10.6plus-or-minus665.010.6665.0\pm 10.6 200.2±9.9plus-or-minus200.29.9200.2\pm 9.9 0.032±0.035plus-or-minus0.0320.035-0.032\pm 0.035 0.013±0.035plus-or-minus0.0130.035-0.013\pm 0.035 1.071.071.07 592.4±14.7plus-or-minus592.414.7592.4\pm 14.7 159.9±13.8plus-or-minus159.913.8159.9\pm 13.8 0.036±0.064plus-or-minus0.0360.0640.036\pm 0.064 0.034±0.081plus-or-minus0.0340.081-0.034\pm 0.081
2.752.75-2.75 669.6±11.5plus-or-minus669.611.5669.6\pm 11.5 196.0±10.3plus-or-minus196.010.3196.0\pm 10.3 0.022±0.039plus-or-minus0.0220.039-0.022\pm 0.039 0.036±0.040plus-or-minus0.0360.040-0.036\pm 0.040 3.533.533.53 585.8±16.9plus-or-minus585.816.9585.8\pm 16.9 167.8±17.3plus-or-minus167.817.3167.8\pm 17.3 0.029±0.069plus-or-minus0.0290.0690.029\pm 0.069 0.018±0.083plus-or-minus0.0180.083-0.018\pm 0.083
2.342.34-2.34 681.8±12.7plus-or-minus681.812.7681.8\pm 12.7 194.3±12.9plus-or-minus194.312.9194.3\pm 12.9 0.028±0.041plus-or-minus0.0280.041-0.028\pm 0.041 0.003±0.045plus-or-minus0.0030.045-0.003\pm 0.045 6.136.136.13 539.7±16.3plus-or-minus539.716.3539.7\pm 16.3 177.7±15.6plus-or-minus177.715.6177.7\pm 15.6 0.069±0.067plus-or-minus0.0690.0670.069\pm 0.067 0.056±0.080plus-or-minus0.0560.080-0.056\pm 0.080
2.072.07-2.07 674.1±11.3plus-or-minus674.111.3674.1\pm 11.3 198.6±12.5plus-or-minus198.612.5198.6\pm 12.5 0.004±0.037plus-or-minus0.0040.0370.004\pm 0.037 0.019±0.041plus-or-minus0.0190.0410.019\pm 0.041 9.029.029.02 522.3±19.0plus-or-minus522.319.0522.3\pm 19.0 152.1±17.1plus-or-minus152.117.1152.1\pm 17.1 0.063±0.085plus-or-minus0.0630.085-0.063\pm 0.085 0.043±0.112plus-or-minus0.0430.112-0.043\pm 0.112
1.791.79-1.79 672.3±11.8plus-or-minus672.311.8672.3\pm 11.8 199.6±11.1plus-or-minus199.611.1199.6\pm 11.1 0.040±0.039plus-or-minus0.0400.039-0.040\pm 0.039 0.019±0.039plus-or-minus0.0190.039-0.019\pm 0.039 12.2912.2912.29 542.2±15.9plus-or-minus542.215.9542.2\pm 15.9 162.3±16.6plus-or-minus162.316.6162.3\pm 16.6 0.036±0.067plus-or-minus0.0360.0670.036\pm 0.067 0.004±0.082plus-or-minus0.0040.0820.004\pm 0.082
1.521.52-1.52 674.0±10.3plus-or-minus674.010.3674.0\pm 10.3 203.1±10.7plus-or-minus203.110.7203.1\pm 10.7 0.030±0.033plus-or-minus0.0300.033-0.030\pm 0.033 0.017±0.035plus-or-minus0.0170.0350.017\pm 0.035 16.1216.1216.12 547.4±18.2plus-or-minus547.418.2547.4\pm 18.2 176.4±18.7plus-or-minus176.418.7176.4\pm 18.7 0.036±0.071plus-or-minus0.0360.0710.036\pm 0.071 0.030±0.084plus-or-minus0.0300.084-0.030\pm 0.084
1.241.24-1.24 683.3±11.3plus-or-minus683.311.3683.3\pm 11.3 208.2±10.2plus-or-minus208.210.2208.2\pm 10.2 0.027±0.038plus-or-minus0.0270.038-0.027\pm 0.038 0.029±0.035plus-or-minus0.0290.035-0.029\pm 0.035 20.7620.7620.76 507.8±21.4plus-or-minus507.821.4507.8\pm 21.4 131.6±14.1plus-or-minus131.614.1131.6\pm 14.1 0.046±0.141plus-or-minus0.0460.1410.046\pm 0.141 0.122±0.154plus-or-minus0.1220.154-0.122\pm 0.154
0.970.97-0.97 681.2±11.2plus-or-minus681.211.2681.2\pm 11.2 202.6±10.5plus-or-minus202.610.5202.6\pm 10.5 0.030±0.037plus-or-minus0.0300.037-0.030\pm 0.037 0.016±0.036plus-or-minus0.0160.036-0.016\pm 0.036 26.7226.7226.72 483.6±29.1plus-or-minus483.629.1483.6\pm 29.1 138.1±20.0plus-or-minus138.120.0138.1\pm 20.0 0.048±0.136plus-or-minus0.0480.1360.048\pm 0.136 0.122±0.162plus-or-minus0.1220.162-0.122\pm 0.162
0.690.69-0.69 661.3±12.2plus-or-minus661.312.2661.3\pm 12.2 224.3±11.1plus-or-minus224.311.1224.3\pm 11.1 0.008±0.042plus-or-minus0.0080.042-0.008\pm 0.042 0.029±0.037plus-or-minus0.0290.037-0.029\pm 0.037 34.9934.9934.99 446.8±24.0plus-or-minus446.824.0446.8\pm 24.0 99.0±14.0plus-or-minus99.014.099.0\pm 14.0 0.058±0.213plus-or-minus0.0580.2130.058\pm 0.213 0.191±0.132plus-or-minus0.1910.132-0.191\pm 0.132
0.420.42-0.42 648.1±10.5plus-or-minus648.110.5648.1\pm 10.5 216.1±10.5plus-or-minus216.110.5216.1\pm 10.5 0.024±0.034plus-or-minus0.0240.034-0.024\pm 0.034 0.005±0.033plus-or-minus0.0050.0330.005\pm 0.033 47.6147.6147.61 416.4±57.6plus-or-minus416.457.6416.4\pm 57.6 117.4±46.8plus-or-minus117.446.8117.4\pm 46.8 0.158±0.236plus-or-minus0.1580.2360.158\pm 0.236 0.122±0.192plus-or-minus0.1220.192-0.122\pm 0.192
0.140.14-0.14 615.9±23.2plus-or-minus615.923.2615.9\pm 23.2 247.0±32.0plus-or-minus247.032.0247.0\pm 32.0 0.020±0.131plus-or-minus0.0200.1310.020\pm 0.131 0.041±0.113plus-or-minus0.0410.1130.041\pm 0.113 66.8666.8666.86 414.1±27.1plus-or-minus414.127.1414.1\pm 27.1 68.4±20.1plus-or-minus68.420.168.4\pm 20.1 0.058±0.255plus-or-minus0.0580.255-0.058\pm 0.255 0.161±0.119plus-or-minus0.1610.119-0.161\pm 0.119
0.130.130.13 609.5±25.3plus-or-minus609.525.3609.5\pm 25.3 236.3±29.6plus-or-minus236.329.6236.3\pm 29.6 0.064±0.100plus-or-minus0.0640.1000.064\pm 0.100 0.002±0.076plus-or-minus0.0020.076-0.002\pm 0.076 96.3796.3796.37 424.1±32.3plus-or-minus424.132.3424.1\pm 32.3 55.7±31.0plus-or-minus55.731.055.7\pm 31.0 0.001±0.230plus-or-minus0.0010.2300.001\pm 0.230 0.167±0.165plus-or-minus0.1670.165-0.167\pm 0.165
0.410.410.41 558.6±9.2plus-or-minus558.69.2558.6\pm 9.2 215.1±10.2plus-or-minus215.110.2215.1\pm 10.2 0.124±0.031plus-or-minus0.1240.0310.124\pm 0.031 0.002±0.036plus-or-minus0.0020.036-0.002\pm 0.036
0.680.680.68 550.7±9.4plus-or-minus550.79.4550.7\pm 9.4 215.5±9.7plus-or-minus215.59.7215.5\pm 9.7 0.082±0.032plus-or-minus0.0820.0320.082\pm 0.032 0.001±0.033plus-or-minus0.0010.033-0.001\pm 0.033 16′′superscript16′′16^{\prime\prime} South Offset
0.960.960.96 534.0±10.6plus-or-minus534.010.6534.0\pm 10.6 211.9±10.7plus-or-minus211.910.7211.9\pm 10.7 0.062±0.037plus-or-minus0.0620.0370.062\pm 0.037 0.011±0.037plus-or-minus0.0110.037-0.011\pm 0.037
1.231.231.23 532.8±10.1plus-or-minus532.810.1532.8\pm 10.1 200.7±10.8plus-or-minus200.710.8200.7\pm 10.8 0.066±0.036plus-or-minus0.0660.0360.066\pm 0.036 0.011±0.040plus-or-minus0.0110.040-0.011\pm 0.040 96.4396.43-96.43 834.8±38.4plus-or-minus834.838.4834.8\pm 38.4 79.1±25.4plus-or-minus79.125.479.1\pm 25.4 0.075±0.250plus-or-minus0.0750.250-0.075\pm 0.250 0.270±0.179plus-or-minus0.2700.179-0.270\pm 0.179
1.511.511.51 536.2±10.1plus-or-minus536.210.1536.2\pm 10.1 205.6±11.3plus-or-minus205.611.3205.6\pm 11.3 0.083±0.035plus-or-minus0.0830.0350.083\pm 0.035 0.003±0.039plus-or-minus0.0030.0390.003\pm 0.039 75.5875.58-75.58 800.9±37.1plus-or-minus800.937.1800.9\pm 37.1 77.9±21.6plus-or-minus77.921.677.9\pm 21.6 0.006±0.199plus-or-minus0.0060.1990.006\pm 0.199 0.311±0.223plus-or-minus0.3110.223-0.311\pm 0.223
1.781.781.78 527.2±11.7plus-or-minus527.211.7527.2\pm 11.7 211.4±10.9plus-or-minus211.410.9211.4\pm 10.9 0.019±0.040plus-or-minus0.0190.0400.019\pm 0.040 0.028±0.038plus-or-minus0.0280.038-0.028\pm 0.038 53.6653.66-53.66 793.2±29.8plus-or-minus793.229.8793.2\pm 29.8 94.7±26.1plus-or-minus94.726.194.7\pm 26.1 0.029±0.206plus-or-minus0.0290.206-0.029\pm 0.206 0.079±0.140plus-or-minus0.0790.140-0.079\pm 0.140
2.062.062.06 527.3±15.7plus-or-minus527.315.7527.3\pm 15.7 211.5±16.4plus-or-minus211.516.4211.5\pm 16.4 0.020±0.053plus-or-minus0.0200.0530.020\pm 0.053 0.006±0.052plus-or-minus0.0060.052-0.006\pm 0.052 38.0738.07-38.07 779.7±28.9plus-or-minus779.728.9779.7\pm 28.9 88.7±18.8plus-or-minus88.718.888.7\pm 18.8 0.029±0.224plus-or-minus0.0290.2240.029\pm 0.224 0.109±0.128plus-or-minus0.1090.128-0.109\pm 0.128
2.332.332.33 529.1±12.2plus-or-minus529.112.2529.1\pm 12.2 213.2±12.0plus-or-minus213.212.0213.2\pm 12.0 0.052±0.042plus-or-minus0.0520.0420.052\pm 0.042 0.012±0.040plus-or-minus0.0120.040-0.012\pm 0.040 28.4228.42-28.42 786.6±28.3plus-or-minus786.628.3786.6\pm 28.3 100.5±16.7plus-or-minus100.516.7100.5\pm 16.7 0.020±0.218plus-or-minus0.0200.2180.020\pm 0.218 0.107±0.112plus-or-minus0.1070.112-0.107\pm 0.112
2.612.612.61 534.5±13.6plus-or-minus534.513.6534.5\pm 13.6 206.3±16.4plus-or-minus206.316.4206.3\pm 16.4 0.116±0.048plus-or-minus0.1160.0480.116\pm 0.048 0.019±0.056plus-or-minus0.0190.0560.019\pm 0.056 21.0421.04-21.04 711.6±30.2plus-or-minus711.630.2711.6\pm 30.2 152.8±27.2plus-or-minus152.827.2152.8\pm 27.2 0.053±0.178plus-or-minus0.0530.178-0.053\pm 0.178 0.086±0.135plus-or-minus0.0860.135-0.086\pm 0.135
3.013.013.01 552.2±12.0plus-or-minus552.212.0552.2\pm 12.0 207.6±15.6plus-or-minus207.615.6207.6\pm 15.6 0.097±0.039plus-or-minus0.0970.0390.097\pm 0.039 0.066±0.048plus-or-minus0.0660.0480.066\pm 0.048 15.1815.18-15.18 704.1±28.8plus-or-minus704.128.8704.1\pm 28.8 134.2±27.2plus-or-minus134.227.2134.2\pm 27.2 0.052±0.186plus-or-minus0.0520.186-0.052\pm 0.186 0.009±0.128plus-or-minus0.0090.1280.009\pm 0.128
3.563.563.56 550.0±11.7plus-or-minus550.011.7550.0\pm 11.7 210.8±12.0plus-or-minus210.812.0210.8\pm 12.0 0.040±0.040plus-or-minus0.0400.0400.040\pm 0.040 0.004±0.040plus-or-minus0.0040.040-0.004\pm 0.040 10.4010.40-10.40 647.1±27.0plus-or-minus647.127.0647.1\pm 27.0 154.9±21.1plus-or-minus154.921.1154.9\pm 21.1 0.094±0.184plus-or-minus0.0940.184-0.094\pm 0.184 0.152±0.145plus-or-minus0.1520.145-0.152\pm 0.145
4.114.114.11 549.5±11.3plus-or-minus549.511.3549.5\pm 11.3 211.7±11.4plus-or-minus211.711.4211.7\pm 11.4 0.058±0.039plus-or-minus0.0580.0390.058\pm 0.039 0.009±0.039plus-or-minus0.0090.039-0.009\pm 0.039 6.156.15-6.15 654.5±21.9plus-or-minus654.521.9654.5\pm 21.9 145.5±20.2plus-or-minus145.520.2145.5\pm 20.2 0.029±0.140plus-or-minus0.0290.140-0.029\pm 0.140 0.040±0.132plus-or-minus0.0400.132-0.040\pm 0.132
4.664.664.66 533.6±11.7plus-or-minus533.611.7533.6\pm 11.7 194.4±13.4plus-or-minus194.413.4194.4\pm 13.4 0.046±0.041plus-or-minus0.0460.0410.046\pm 0.041 0.009±0.047plus-or-minus0.0090.0470.009\pm 0.047 2.182.18-2.18 633.8±30.8plus-or-minus633.830.8633.8\pm 30.8 164.8±24.3plus-or-minus164.824.3164.8\pm 24.3 0.104±0.158plus-or-minus0.1040.158-0.104\pm 0.158 0.134±0.162plus-or-minus0.1340.162-0.134\pm 0.162
5.355.355.35 538.3±9.0plus-or-minus538.39.0538.3\pm 9.0 196.4±10.7plus-or-minus196.410.7196.4\pm 10.7 0.111±0.036plus-or-minus0.1110.0360.111\pm 0.036 0.038±0.045plus-or-minus0.0380.045-0.038\pm 0.045 1.521.521.52 606.4±23.7plus-or-minus606.423.7606.4\pm 23.7 163.1±18.2plus-or-minus163.118.2163.1\pm 18.2 0.150±0.131plus-or-minus0.1500.1310.150\pm 0.131 0.186±0.154plus-or-minus0.1860.154-0.186\pm 0.154
6.176.176.17 531.4±13.4plus-or-minus531.413.4531.4\pm 13.4 204.0±14.8plus-or-minus204.014.8204.0\pm 14.8 0.017±0.043plus-or-minus0.0170.043-0.017\pm 0.043 0.017±0.046plus-or-minus0.0170.0460.017\pm 0.046 5.235.235.23 594.6±18.0plus-or-minus594.618.0594.6\pm 18.0 140.3±16.0plus-or-minus140.316.0140.3\pm 16.0 0.056±0.140plus-or-minus0.0560.140-0.056\pm 0.140 0.057±0.113plus-or-minus0.0570.113-0.057\pm 0.113
7.007.007.00 534.5±12.6plus-or-minus534.512.6534.5\pm 12.6 191.2±12.8plus-or-minus191.212.8191.2\pm 12.8 0.013±0.043plus-or-minus0.0130.0430.013\pm 0.043 0.022±0.049plus-or-minus0.0220.049-0.022\pm 0.049 9.069.069.06 594.3±24.9plus-or-minus594.324.9594.3\pm 24.9 162.5±24.2plus-or-minus162.524.2162.5\pm 24.2 0.001±0.101plus-or-minus0.0010.101-0.001\pm 0.101 0.039±0.144plus-or-minus0.0390.144-0.039\pm 0.144
7.957.957.95 537.8±14.2plus-or-minus537.814.2537.8\pm 14.2 189.2±14.5plus-or-minus189.214.5189.2\pm 14.5 0.024±0.048plus-or-minus0.0240.048-0.024\pm 0.048 0.021±0.056plus-or-minus0.0210.056-0.021\pm 0.056 13.0513.0513.05 591.2±21.2plus-or-minus591.221.2591.2\pm 21.2 150.5±19.5plus-or-minus150.519.5150.5\pm 19.5 0.020±0.133plus-or-minus0.0200.1330.020\pm 0.133 0.064±0.142plus-or-minus0.0640.142-0.064\pm 0.142
9.069.069.06 525.0±14.3plus-or-minus525.014.3525.0\pm 14.3 203.0±13.4plus-or-minus203.013.4203.0\pm 13.4 0.006±0.048plus-or-minus0.0060.0480.006\pm 0.048 0.035±0.047plus-or-minus0.0350.047-0.035\pm 0.047 17.4317.4317.43 548.2±25.6plus-or-minus548.225.6548.2\pm 25.6 133.7±21.7plus-or-minus133.721.7133.7\pm 21.7 0.017±0.189plus-or-minus0.0170.1890.017\pm 0.189 0.064±0.127plus-or-minus0.0640.127-0.064\pm 0.127
10.2910.2910.29 518.0±13.7plus-or-minus518.013.7518.0\pm 13.7 188.2±14.9plus-or-minus188.214.9188.2\pm 14.9 0.007±0.047plus-or-minus0.0070.0470.007\pm 0.047 0.012±0.056plus-or-minus0.0120.056-0.012\pm 0.056 22.3722.3722.37 516.1±23.3plus-or-minus516.123.3516.1\pm 23.3 128.5±19.2plus-or-minus128.519.2128.5\pm 19.2 0.072±0.164plus-or-minus0.0720.1640.072\pm 0.164 0.064±0.128plus-or-minus0.0640.128-0.064\pm 0.128
11.8011.8011.80 533.2±13.9plus-or-minus533.213.9533.2\pm 13.9 186.6±15.0plus-or-minus186.615.0186.6\pm 15.0 0.043±0.051plus-or-minus0.0430.0510.043\pm 0.051 0.034±0.063plus-or-minus0.0340.063-0.034\pm 0.063 27.8327.8327.83 511.8±24.2plus-or-minus511.824.2511.8\pm 24.2 129.7±19.3plus-or-minus129.719.3129.7\pm 19.3 0.061±0.177plus-or-minus0.0610.1770.061\pm 0.177 0.096±0.134plus-or-minus0.0960.134-0.096\pm 0.134
13.5813.5813.58 559.2±12.8plus-or-minus559.212.8559.2\pm 12.8 186.9±13.4plus-or-minus186.913.4186.9\pm 13.4 0.103±0.055plus-or-minus0.1030.0550.103\pm 0.055 0.087±0.072plus-or-minus0.0870.072-0.087\pm 0.072 34.4234.4234.42 489.1±37.7plus-or-minus489.137.7489.1\pm 37.7 141.7±34.6plus-or-minus141.734.6141.7\pm 34.6 0.296±0.191plus-or-minus0.2960.1910.296\pm 0.191 0.040±0.204plus-or-minus0.0400.2040.040\pm 0.204
15.7715.7715.77 531.0±14.1plus-or-minus531.014.1531.0\pm 14.1 173.2±16.3plus-or-minus173.216.3173.2\pm 16.3 0.004±0.053plus-or-minus0.0040.053-0.004\pm 0.053 0.014±0.075plus-or-minus0.0140.0750.014\pm 0.075 43.8943.8943.89 458.7±35.7plus-or-minus458.735.7458.7\pm 35.7 108.3±27.8plus-or-minus108.327.8108.3\pm 27.8 0.135±0.250plus-or-minus0.1350.2500.135\pm 0.250 0.075±0.147plus-or-minus0.0750.147-0.075\pm 0.147
18.5018.5018.50 509.1±15.1plus-or-minus509.115.1509.1\pm 15.1 160.1±14.4plus-or-minus160.114.4160.1\pm 14.4 0.013±0.076plus-or-minus0.0130.0760.013\pm 0.076 0.071±0.104plus-or-minus0.0710.104-0.071\pm 0.104 59.9259.9259.92 438.6±36.8plus-or-minus438.636.8438.6\pm 36.8 85.1±25.3plus-or-minus85.125.385.1\pm 25.3 0.001±0.198plus-or-minus0.0010.198-0.001\pm 0.198 0.184±0.179plus-or-minus0.1840.179-0.184\pm 0.179
21.7921.7921.79 502.6±17.8plus-or-minus502.617.8502.6\pm 17.8 151.0±16.8plus-or-minus151.016.8151.0\pm 16.8 0.123±0.113plus-or-minus0.1230.1130.123\pm 0.113 0.053±0.106plus-or-minus0.0530.106-0.053\pm 0.106 86.5886.5886.58 489.2±50.1plus-or-minus489.250.1489.2\pm 50.1 89.8±44.6plus-or-minus89.844.689.8\pm 44.6 0.183±0.212plus-or-minus0.1830.2120.183\pm 0.212 0.124±0.235plus-or-minus0.1240.235-0.124\pm 0.235

6 Pattern speed

Refer to caption
Figure 7: The pattern speed measurement for NGC 1023. The bottom 3 panels show the V𝑉V-band profiles for the three slits (12′′superscript12′′12^{\prime\prime}N, major axis and 16′′superscript16′′16^{\prime\prime}S from left to right) with 𝒳𝒳{\cal X} indicated by the dashed vertical lines. The horizontal dotted lines indicate μV=19subscript𝜇𝑉19\mu_{V}=19 mag arcsec-2 and μV=21subscript𝜇𝑉21\mu_{V}=21 mag arcsec-2. The 3 panels on the right indicate the LOSVD for the three slits (12′′superscript12′′12^{\prime\prime}N, major axis and 16′′superscript16′′16^{\prime\prime}S from top to bottom), with 𝒱𝒱{\cal V} indicated by the dashed lines. The LOSVDs are constructed from the Gauss-Hermite moments; the 3 LOSVDs in each of these panels were obtained from different wavelength ranges (here, each is renormalized to the same maximum value, for clarity). The central panel plots 𝒱𝒱{\cal V} against 𝒳𝒳{\cal X} (solid circles); the slope of the best fit straight line (indicated by the solid line) is Ωpsini=4.7±1.7subscriptΩ𝑝𝑖plus-or-minus4.71.7\Omega_{p}\sin i=4.7\pm 1.7 kms1arcsec1k𝑚superscript𝑠1𝑎𝑟𝑐𝑠𝑒superscript𝑐1\mathrm{k}m\;s^{-1}\,arcsec^{-1}. The open triangles and dotted line indicates the results for using just the I𝐼I-band to measure 𝒳𝒳{\cal X}, which gives the largest values of |𝒳|𝒳|{\cal X}| and therefore the smallest slope, Ωpsini=4.0±1.4subscriptΩ𝑝𝑖plus-or-minus4.01.4\Omega_{p}\sin i=4.0\pm 1.4 kms1arcsec1k𝑚superscript𝑠1𝑎𝑟𝑐𝑠𝑒superscript𝑐1\mathrm{k}m\;s^{-1}\,arcsec^{-1}.

To compute the mean position of stars, 𝒳𝒳{\cal X}, along the slits, we extracted profiles from the B𝐵B, V𝑉V and I𝐼I-band surface photometry along the positions of the slits. The profiles in V𝑉V-band (within which the wavelength range used in the spectroscopy falls) match very well the profiles obtained by collapsing the spectra along the wavelength direction, confirming that the slits were placed as intended. We used the broad band profiles to compute 𝒳𝒳{\cal X} because these are less noisy than the spectral profiles, particularly at large radii. We therefore computed three values of 𝒳𝒳{\cal X} at each slit position, 𝒳Bsubscript𝒳𝐵{\cal X}_{B}, 𝒳Vsubscript𝒳𝑉{\cal X}_{V} and 𝒳Isubscript𝒳𝐼{\cal X}_{I}. Each value of 𝒳𝒳{\cal X} was computed by Monte Carlo simulation, with photon, read-out and sky noise to compute the errors. Another advantage to using the broad band surface photometry is that it allows us to test for contamination by NGC 1023A to the integrals. Formally, the integrals in Eqn. 1 are over X𝑋-\infty\leq X\leq\infty, but can be limited to XmaxXXmaxsubscript𝑋𝑚𝑎𝑥𝑋subscript𝑋𝑚𝑎𝑥-X_{max}\leq X\leq X_{max} if Xmaxsubscript𝑋𝑚𝑎𝑥X_{max} has reached the axisymmetric part of the disc; still larger values of Xmaxsubscript𝑋𝑚𝑎𝑥X_{max} add noise only. In the case of NGC 1023, the presence of NGC 1023A introduces some additional light at negative X𝑋X. The most severely contaminated slit is the one at 16′′superscript16′′16^{\prime\prime}S, where 𝒳𝒳{\cal X} continues changing as ever larger values of Xmaxsubscript𝑋𝑚𝑎𝑥X_{max} are used. We therefore found it useful to compare the 16′′superscript16′′16^{\prime\prime}S profiles to the profiles at 16′′superscript16′′16^{\prime\prime}N. For these latter profiles, there is no further signal to 𝒳𝒳{\cal X} beyond Xmax=60′′subscript𝑋𝑚𝑎𝑥superscript60′′X_{max}=60^{\prime\prime}. The comparison also showed that there is little or no contamination to the 16′′superscript16′′16^{\prime\prime}S slit inside Xmax55′′similar-tosubscript𝑋𝑚𝑎𝑥superscript55′′X_{max}\sim 55^{\prime\prime}. Furthermore, since NGC 1023A is quite blue, the contamination decreases in going from B𝐵B to V𝑉V, and especially to I𝐼I band. Therefore, to measure 𝒳𝒳{\cal X} at 16′′superscript16′′16^{\prime\prime}S, we averaged the Monte Carlo results between 62′′Xmax75′′superscript62′′subscript𝑋𝑚𝑎𝑥superscript75′′62^{\prime\prime}\leq X_{max}\leq 75^{\prime\prime} (75′′R85′′superscript75′′𝑅superscript85′′75^{\prime\prime}\leq R\leq 85^{\prime\prime}, where the disc is roughly axisymmetric) and then averaged over each band. In the remaining slits, contamination by NGC 1023A in the major axis begins at R100′′𝑅superscript100′′R\geq 100^{\prime\prime} in all bands and is easily avoided, while the 12′′superscript12′′12^{\prime\prime}N slit has no obvious contamination. We therefore also averaged them over 75′′R85′′superscript75′′𝑅superscript85′′75^{\prime\prime}\leq R\leq 85^{\prime\prime}. Because of the color gradient in the inner 70′′similar-toabsentsuperscript70′′\sim 70^{\prime\prime} (Fig. 2), the value of 𝒳𝒳{\cal X} in the offset slits changes with the color band used, with |𝒳I|>|𝒳V|>|𝒳B|subscript𝒳𝐼subscript𝒳𝑉>subscript𝒳𝐵|{\cal X}_{I}|>|{\cal X}_{V}|\mathrel{\hbox to0.0pt{\lower 2.15277pt\hbox{$\mathchar 536\relax$}\hss}\raise 1.72218pt\hbox{$\mathchar 318\relax$}}|{\cal X}_{B}|. Therefore, by averaging over bands and then taking the largest discrepancy from the average as our error value, we are confident that we take into account any difference between the narrow wavelength range of the spectroscopy and the broad one of the surface photometry. The values thus obtained are given in Tab. LABEL:tab:TW_values.

If we have successfully avoided contamination by NGC 1023A, then we expect that, since NGC 1023 is nearly point-symmetric about its center, the profile extracted from the surface photometry at Y𝑌Y should have a value of 𝒳𝒳{\cal X} roughly the negative of value for the profile extracted at Y𝑌-Y. For a profile extracted from the surface photometry at 16′′superscript16′′16^{\prime\prime}N, we found 𝒳=2.31±0.15{\cal X}=-2\aas@@fstack{\prime\prime}31\pm 0\aas@@fstack{\prime\prime}15 averaged over the 3 bands, which is within 2σ2𝜎2\sigma of our value for 𝒳𝒳-{\cal X} at 16′′superscript16′′16^{\prime\prime}S.

To measure the luminosity-weighted line-of-sight stellar velocity, 𝒱𝒱{\cal V}, for each slit position, we collapsed each bi-dimensional spectrum along its spatial direction to obtain a one-dimensional spectrum. The resulting spectra have been analysed with the FCQ method using HR 2035 as template star. 𝒱𝒱{\cal V} is the radial velocity derived from the LOSVD of the one-dimensional spectra (see Fig. 6). For each slit position, the uncertainties on 𝒱𝒱{\cal V} were estimated by measuring it in different wavelength ranges between 4910 Å and 5560 Å (but always including the Mg triplet). The 𝒱𝒱{\cal V} values we derived along each slit are given in Tab. LABEL:tab:TW_values. We integrated the spectral rows at Xmax=140′′subscript𝑋𝑚𝑎𝑥superscript140′′X_{max}=140^{\prime\prime}, 100′′superscript100′′100^{\prime\prime} and 80′′superscript80′′80^{\prime\prime} in the major-axis, northern and southern offset spectra, respectively. For the major-axis and northern offset spectra we were limited by the noise, which becomes dominant at larger radii (S/N3𝑆𝑁3S/N\leq 3), while for the southern offset spectrum we decided to also try Xmax=60′′subscript𝑋𝑚𝑎𝑥superscript60′′X_{max}=60^{\prime\prime}, to check for contamination by NGC 1023A. We found that different choices of Xmaxsubscript𝑋𝑚𝑎𝑥X_{max} do not affect our results for 𝒱𝒱{\cal V}. The values of 𝒱𝒱{\cal V} we derived by integrating both offset spectra out to Xmax=140′′subscript𝑋𝑚𝑎𝑥superscript140′′X_{max}=140^{\prime\prime} (after removing by linear interpolation the contribution of foreground stars) are close to those in Tab. LABEL:tab:TW_values, although their errors increase by a factor 1.6 and 2 along the north and south slit, respectively. Therefore, within the errors obtained from the varying wavelength range, there is no evidence of contamination by NGC 1023A in 𝒱𝒱{\cal V} for the southern offset slit.

Table 3: The values of 𝒱𝒱{\cal V} and 𝒳𝒳{\cal X} for the 3 slits.
Offset 𝒳𝒳{\cal X} 𝒱𝒱{\cal V}
(′′) (kms1k𝑚superscript𝑠1\mathrm{k}m\;s^{-1})
12′′superscript12′′12^{\prime\prime} N 1.82±0.13plus-or-minus1.820.13-1.82\pm 0.13 619.1±5.4plus-or-minus619.15.4619.1\pm 5.4
Major axis +0.05±0.06plus-or-minus0.050.06+0.05\pm 0.06 614.5±2.2plus-or-minus614.52.2614.5\pm 2.2
16′′superscript16′′16^{\prime\prime} S +1.90±0.25plus-or-minus1.900.25+1.90\pm 0.25 603.7±3.0plus-or-minus603.73.0603.7\pm 3.0

By performing our analysis with all the remaining template spectra, we found that 𝒱𝒱{\cal V} values are not affected by template mismatch (at least for our set of template stars). This is in agreement with the results of Bender et al. (1994) on the determination of the radial velocities with FCQ.

Using the data of Tab. LABEL:tab:TW_values, in Fig. 7 we plot 𝒱𝒱{\cal V} versus 𝒳𝒳{\cal X}, fitting a straight line (using subroutine fitexy in Numerical Recipes). The slope of this line is Ωpsini=4.7±1.7subscriptΩ𝑝𝑖plus-or-minus4.71.7\Omega_{p}\sin i=4.7\pm 1.7 kms1arcsec1k𝑚superscript𝑠1𝑎𝑟𝑐𝑠𝑒superscript𝑐1\mathrm{k}m\;s^{-1}\,arcsec^{-1}, which gives Ωp=5.1±1.8subscriptΩ𝑝plus-or-minus5.11.8\Omega_{p}=5.1\pm 1.8 kms1arcsec1k𝑚superscript𝑠1𝑎𝑟𝑐𝑠𝑒superscript𝑐1\mathrm{k}m\;s^{-1}\,arcsec^{-1} (corresponding to Ωp=104±34subscriptΩ𝑝plus-or-minus10434\Omega_{p}=104\pm 34 kms1kpc1k𝑚superscript𝑠1𝑘𝑝superscript𝑐1\mathrm{k}m\;s^{-1}\,kpc^{-1} at 10.2 Mpc). We have also fitted a “slowest-bar” line, using the values of 𝒳Isubscript𝒳𝐼{\cal X}_{I} (which are largest, and therefore give a shallower slope) in the 12′′superscript12′′12^{\prime\prime}N and major-axis, and adopting the value of 𝒳Isubscript𝒳𝐼{\cal X}_{I} from 16′′superscript16′′16^{\prime\prime}N, which gives a slightly larger |𝒳|𝒳|{\cal X}| than the 16′′superscript16′′16^{\prime\prime}S profile. The slope of this line, now ignoring the uncertainties in 𝒳𝒳{\cal X}, is Ωpsini=4.0±1.4subscriptΩ𝑝𝑖plus-or-minus4.01.4\Omega_{p}\sin i=4.0\pm 1.4 kms1arcsec1k𝑚superscript𝑠1𝑎𝑟𝑐𝑠𝑒superscript𝑐1\mathrm{k}m\;s^{-1}\,arcsec^{-1} (Ωp=4.3±1.5subscriptΩ𝑝plus-or-minus4.31.5\Omega_{p}=4.3\pm 1.5 kms1arcsec1k𝑚superscript𝑠1𝑎𝑟𝑐𝑠𝑒superscript𝑐1\mathrm{k}m\;s^{-1}\,arcsec^{-1}).

To then determine {\cal R}, we need to measure DLsubscript𝐷𝐿D_{L}, which we approximate by the co-rotation radius, Rcsubscript𝑅𝑐R_{c}, from the axisymmetric approximation. Debattista (1998) found that, for strong bars in N𝑁N-body simulations, the approximation DLRcsimilar-to-or-equalssubscript𝐷𝐿subscript𝑅𝑐D_{L}\simeq R_{c} involves an error of 5%similar-toabsentpercent5\sim 5\%. We therefore measured the rotation curve, Vc(R)subscript𝑉𝑐𝑅V_{c}(R), of NGC 1023. This is a two step process: first we fitted tilted rings (with constant PA and inclination fixed to the value obtained from the surface photometry) to the data from all our slits, interpolating with cubic splines where necessary. This allowed us to measure the heliocentric systemic velocity, V𝑠𝑦𝑠=613±3subscript𝑉𝑠𝑦𝑠plus-or-minus6133V_{\it sys}=613\pm 3 kms1k𝑚superscript𝑠1\mathrm{k}m\;s^{-1}, which is compared to the values based on optical data available in the literature in Tab. LABEL:tab:systemic_velocity. By folding the major axis slit (which reaches furthest out in R𝑅R) about the origin, after subtracting out V𝑠𝑦𝑠subscript𝑉𝑠𝑦𝑠V_{\it sys}, we obtained the stellar streaming velocities, V(R)subscript𝑉𝑅V_{*}(R), shown in Fig. 8.

Table 4: Heliocentric systemic velocity based on optical measurements.
V𝑠𝑦𝑠subscript𝑉𝑠𝑦𝑠V_{\it sys} Source
(kms1k𝑚superscript𝑠1\mathrm{k}m\;s^{-1})
734±41plus-or-minus73441734\pm 41 Mayall & de Vaucouleurs (1962)
617±19plus-or-minus61719617\pm 19 Tonry & Davies (1981)
597±9plus-or-minus5979597\pm 9 Schechter (1983)
608±9plus-or-minus6089608\pm 9 Schechter (1983)
615±20plus-or-minus61520615\pm 20 Dressler & Sandage (1983)
620±50plus-or-minus62050620\pm 50 Capaccioli et al. (1986)
592±15plus-or-minus59215592\pm 15 Simien & Prugniel (1997)
606±5plus-or-minus6065606\pm 5 Weighted average of literature values
613±3plus-or-minus6133613\pm 3 This work

We tested V(R)subscript𝑉𝑅V_{*}(R) by rotating it into the orientations of other slit observations available in the literature. The slits we compared with are those at PA =87absentsuperscript87=87^{\circ} (Simien & Prugniel 1997; Neistein et al. 1999), PA =90absentsuperscript90=90^{\circ} (Bower et al. 2001) and PA =177absentsuperscript177=177^{\circ} (Simien & Prugniel 1997). Excluding the inner 2′′superscript2′′2^{\prime\prime}, to avoid the effects of different seeing and/or slit widths, we find χ~2<1<superscript~𝜒21\tilde{\chi}^{2}\mathrel{\hbox to0.0pt{\lower 2.15277pt\hbox{$\mathchar 536\relax$}\hss}\raise 1.72218pt\hbox{$\mathchar 316\relax$}}1 in all cases except for the PA =87absentsuperscript87=87^{\circ} slit of Neistein et al. (1999), for which we obtained χ~2=2.5superscript~𝜒22.5\tilde{\chi}^{2}=2.5 (for 27 points). Since the same PA is also covered by a slit from Simien & Prugniel (1997), which we match well (χ~2=0.8superscript~𝜒20.8\tilde{\chi}^{2}=0.8 for 36 points), we conclude that the stellar streaming velocity profile we obtained is reasonable and in good agreement with previous data.

Refer to caption
Figure 8: The stellar velocity streaming curve, Vsubscript𝑉V_{*}, derived by subtracting V𝑠𝑦𝑠subscript𝑉𝑠𝑦𝑠V_{\it sys}, folding and deprojecting the observed velocities on the major axis. The data from the major axis are shown in diamonds (approaching side) and stars (receding side). The solid line and the dashed lines flanking it are our fitted spline together with the 1σ1𝜎1\sigma error interval. The asymmetric drift terms (Vc2V2superscriptsubscript𝑉𝑐2superscriptsubscript𝑉2\sqrt{V_{c}^{2}-V_{*}^{2}}) are shown by the dot-dashed, dotted, and dash triple-dotted lines (α=0.0𝛼0.0\alpha=0.0, 0.50.50.5, and 1.01.01.0 respectively) in the lower-right corner at R70′′𝑅superscript70′′R\geq 70^{\prime\prime}. The corresponding circular rotation curves, Vcsubscript𝑉𝑐V_{c}, are shown in the bold lines.
Refer to caption
Figure 9: The average value, a𝑎a, (top panel) and the cos2ϕ2italic-ϕ\cos 2\phi component, b𝑏b, (bottom panel) of the squared observed velocity dispersions. The top panel also indicates ab𝑎𝑏a-b. We fit straight lines to ab𝑎𝑏a-b and b𝑏b at R70′′𝑅superscript70′′R\geq 70^{\prime\prime}, as indicated.

We then corrected for the asymmetric drift using the velocity dispersion data, to recover the true circular velocity, Vc(R)subscript𝑉𝑐𝑅V_{c}(R). Following Eqn. 4-33 in Binney & Tremaine (1987), and assuming (vRvz¯)/z0similar-to-or-equals¯subscript𝑣𝑅subscript𝑣𝑧𝑧0\partial(\overline{v_{R}v_{z}})/\partial z\simeq 0, we can write the asymmetric drift equation as:

Vc2V2=σR2[lnρlnR+lnσR2lnR+(1σϕ2σR2)].superscriptsubscript𝑉𝑐2superscriptsubscript𝑉2superscriptsubscript𝜎𝑅2delimited-[]𝜌𝑅superscriptsubscript𝜎𝑅2𝑅1superscriptsubscript𝜎italic-ϕ2superscriptsubscript𝜎𝑅2V_{c}^{2}-V_{*}^{2}=-\sigma_{R}^{2}\left[{\frac{\partial\ln\rho}{\partial\ln R}}+{\frac{\partial\ln\sigma_{R}^{2}}{\partial\ln R}}+\left(1-{\frac{\sigma_{\phi}^{2}}{\sigma_{R}^{2}}}\right)\right]. (7)

The observed velocity dispersion, at a point (R,ϕ)𝑅italic-ϕ(R,\phi) in the galaxy frame, is given by:

σlos2subscriptsuperscript𝜎2𝑙𝑜𝑠\displaystyle\sigma^{2}_{los} =\displaystyle= 12sin2i[(σR2+σϕ2+2σz2cot2i)(σR2σϕ2)cos2ϕ]12superscript2𝑖delimited-[]subscriptsuperscript𝜎2𝑅subscriptsuperscript𝜎2italic-ϕ2subscriptsuperscript𝜎2𝑧superscript2𝑖subscriptsuperscript𝜎2𝑅subscriptsuperscript𝜎2italic-ϕ2italic-ϕ\displaystyle\frac{1}{2}\sin^{2}i\left[(\sigma^{2}_{R}+\sigma^{2}_{\phi}+2\sigma^{2}_{z}\cot^{2}i)-(\sigma^{2}_{R}-\sigma^{2}_{\phi})\cos 2\phi\right] (8)
\displaystyle\equiv a(R,ϕ)+b(R,ϕ)cos2ϕ.𝑎𝑅italic-ϕ𝑏𝑅italic-ϕ2italic-ϕ\displaystyle a(R,\phi)+b(R,\phi)\cos 2\phi.

where ϕ=0italic-ϕ0\phi=0 is taken to be the disc’s major axis. When the disc is axisymmetric, a𝑎a and b𝑏b can only depend on R𝑅R, in which case a𝑎a and b𝑏b are simply the first 2 even moments in a Fourier expansion of the line-of-sight velocity dispersion. For a disc with a flat rotation curve, σϕ2/σR2=1/2subscriptsuperscript𝜎2italic-ϕsubscriptsuperscript𝜎2𝑅12\sigma^{2}_{\phi}/\sigma^{2}_{R}=1/2, which then allows us to obtain σR2subscriptsuperscript𝜎2𝑅\sigma^{2}_{R} from b𝑏b. However, the profile of Vsubscript𝑉V_{*} we found for NGC 1023 is not obviously flat. (Furthermore, b𝑏b is more sensitive to noisy data than is a𝑎a.) In the general case, the asymmetric drift equation can be re-written in terms of both a𝑎a and b𝑏b, as follows:

Vc2V2superscriptsubscript𝑉𝑐2superscriptsubscript𝑉2\displaystyle V_{c}^{2}-V_{*}^{2} =\displaystyle= Rsin2i(1+α2cot2i)[abRdR(ab)]𝑅superscript2𝑖1superscript𝛼2superscript2𝑖delimited-[]𝑎𝑏subscript𝑅𝑑𝑅𝑎𝑏\displaystyle\frac{R}{\sin^{2}i(1+\alpha^{2}\cot^{2}i)}\left[\frac{a-b}{R_{\it d}}-\frac{\partial}{\partial R}(a-b)\right] (9)
+\displaystyle+ 2bsin2i,2𝑏superscript2𝑖\displaystyle\frac{2b}{\sin^{2}i},

where we have assumed that the disc density is exponential with scale-length Rdsubscript𝑅𝑑R_{\it d} and ασz/σR𝛼subscript𝜎𝑧subscript𝜎𝑅\alpha\equiv\sigma_{z}/\sigma_{R}. Using the velocity dispersion data from our 3 slits and the near minor-axis data of Simien & Prugniel (1997), we measured ab𝑎𝑏a-b and b𝑏b. We fitted splines to interpolate between data points, and estimate errors from Monte Carlo simulation with Gaussian noise added from the error estimate on each point. The resulting profiles of a𝑎a and b𝑏b are shown in Fig. 9. Our procedure for measuring V(R)subscript𝑉𝑅V_{*}(R), a𝑎a and b𝑏b is valid only in the axisymmetric region outside the bar. Therefore we only apply the asymmetric drift correction to R>70′′𝑅superscript70′′R>70^{\prime\prime}; for this region, we fit straight lines to ab=141(±61)R+41884(±562)𝑎𝑏141plus-or-minus61𝑅41884plus-or-minus562a-b=-141\,(\pm 61)\,R+41884\,(\pm 562) km2 s-2 and to b=319(±39)R+8706(±350)𝑏319plus-or-minus39𝑅8706plus-or-minus350b=-319\,(\pm 39)R+8706\,(\pm 350) km2 s-2. With these values, we then correct the rotation curve, assuming 0.0α1.00.0𝛼1.00.0\leq\alpha\leq 1.0. (This range of α𝛼\alpha is a reasonable one: in the Solar neighborhood, Dehnen & Binney (1998) found α0.540.05+0.02similar-to-or-equals𝛼subscriptsuperscript0.540.020.05\alpha\simeq 0.54^{+0.02}_{-0.05}, while in NGC 488, Gerssen et al. (1997) measured α=0.70±0.19𝛼plus-or-minus0.700.19\alpha=0.70\pm 0.19.) The resulting rotation curve is more or less flat, with 259<Vc,flat<278<259subscript𝑉𝑐𝑓𝑙𝑎𝑡<278259\mathrel{\hbox to0.0pt{\lower 2.15277pt\hbox{$\mathchar 536\relax$}\hss}\raise 1.72218pt\hbox{$\mathchar 316\relax$}}V_{c,flat}\mathrel{\hbox to0.0pt{\lower 2.15277pt\hbox{$\mathchar 536\relax$}\hss}\raise 1.72218pt\hbox{$\mathchar 316\relax$}}278 kms1k𝑚superscript𝑠1\mathrm{k}m\;s^{-1}. Adding in quadrature a velocity uncertainty of 30 kms1k𝑚superscript𝑠1\mathrm{k}m\;s^{-1}, we obtain Vc,𝑓𝑙𝑎𝑡=270±31subscript𝑉𝑐𝑓𝑙𝑎𝑡plus-or-minus27031V_{\it c,flat}=270\pm 31 kms1k𝑚superscript𝑠1\mathrm{k}m\;s^{-1}. (For comparison, Neistein et al. 1999 found Vc=250±17subscript𝑉𝑐plus-or-minus25017V_{c}=250\pm 17 kms1k𝑚superscript𝑠1\mathrm{k}m\;s^{-1}; we have checked that, using a method similar to their Eqn. 8, gives similar values for Vc,flatsubscript𝑉𝑐𝑓𝑙𝑎𝑡V_{c,flat} to those reported above.) If we extrapolate this value to smaller radii (which, at worst, over-estimates Rcsubscript𝑅𝑐R_{c} and, correspondingly, {\cal R}, unless the rotation curve is dropping between 40′′<R70′′<superscript40′′𝑅superscript70′′40^{\prime\prime}\mathrel{\hbox to0.0pt{\lower 2.15277pt\hbox{$\mathchar 536\relax$}\hss}\raise 1.72218pt\hbox{$\mathchar 316\relax$}}R\leq 70^{\prime\prime}, which seems unlikely from Fig. 8) we find Rc=Vc,𝑓𝑙𝑎𝑡/Ωp=53±614+29′′subscript𝑅𝑐subscript𝑉𝑐𝑓𝑙𝑎𝑡subscriptΩ𝑝plus-or-minus53superscriptsubscriptsuperscript62914′′R_{c}=V_{\it c,flat}/\Omega_{p}={53\pm 6^{+29}_{-14}}^{\prime\prime}, where the first error is due to the uncertainties in Vc,flatsubscript𝑉𝑐𝑓𝑙𝑎𝑡V_{c,flat} and the second error reflects uncertainties in ΩpsubscriptΩ𝑝\Omega_{p}. We obtain, therefore, =0.77±0.100.20+0.42plus-or-minus0.77subscriptsuperscript0.100.420.20{\cal R}=0.77\pm 0.10^{+0.42}_{-0.20} (where the first error now also includes the uncertainty in aBsubscript𝑎𝐵a_{B}). For our “slowest-bar” estimate of the slope, we find =0.91±0.120.23+0.49plus-or-minus0.91subscriptsuperscript0.120.490.23{\cal R}=0.91\pm 0.12^{+0.49}_{-0.23}. We have found, therefore, that the bar in NGC 1023 is consistent with being a fast bar.

7 Discussion and Conclusions

We have found that the bar in NGC 1023 is fast, as are all bars which have been measured to date. Debattista & Sellwood (1998, 2000) showed that fast bars can persist only if the disc is maximal. Following Ostriker & Peebles (1973), it is sometimes thought that the unbarred (SA) galaxies are stabilized by massive DM halos. However, massive DM halos are not necessary for stabilizing discs; a rapidly rising rotation curve in the inner disc, such as when a massive bulge is present, is also able to inhibit bar formation (Toomre 1981; Sellwood & Evans 2001). Debattista & Sellwood (1998) argued that unbarred HSB galaxies must also be maximal for, if HSB disc galaxies form a continuum of DM halo masses spanning massive DM halo-stabilised SA galaxies to maximal SB galaxies, then slow bars must also be found in the intermediate range of halo masses. If we seek to avoid intermediate halo masses and slow bars by postulating (for whatever reason) a bimodal DM halo mass distribution for HSB galaxies, then we are left with the possibility that tidal interactions can still form bars, which would be slow (Noguchi 1987; Salo 1991; Miwa & Noguchi 1998). Thus Debattista & Sellwood (2000) concluded that the absence of slow bars requires that all HSB disc galaxies are maximal. However, it is possible that no such slow bars have been found because of an observational bias against SB systems with evidence of tidal interactions.

We have chosen to study NGC 1023, in part, because it shows signs of a weak interaction in its past, without being at present significantly perturbed. The fast bar we found indicates that NGC 1023 has a maximal disc. If SA galaxies are stabilized by massive halos, we should find slow bars in that fraction of SB galaxies in which the bar formed through the interaction. While it is not possible to reach a general conclusion on the DM content of SA galaxies based on our measurement for a single galaxy, a large enough sample of similar SB galaxies with mild interactions in the past will be able to address this question.


Acknowledgements.

V.P.D. and J.A.L.A. acknowledge support by the Schweizerischer Nationalfonds through grant 20-56888.99. V.P.D. wishes to thank the Dipartimento di Astronomia dell’Università di Padova for hospitality while preparing for the observations. E.M.C. acknowledges the Astronomisches Institut der Universität Basel for the hospitality while this paper was in progress. We wish to thank the staff of the JKT telescope, particularly to the support astronomer J. C. Vega-Beltrán and the staff of the TNG. We are indebted to R. Bender and R. Saglia for providing us with the FCQ package which we used for measuring the stellar kinematics. We thank the anonymous referee for suggestions that helped improve this paper. This research has made use of the Lyon-Meudon Extragalactic Database (LEDA) and of the NASA/IPAC Extragalactic Database (NED).


References

  • [1] Aguerri J. A. L., Muñoz-Tuñón C., Varela A. M., Prieto M. 2000, A&A, 361, 841.
  • [2] Aguerri J. A. L., Hunter J. H., Prieto M., Varela A. M., Gottesman S. T., Muñoz-Tuñón C. 2001, A&A, 373, 786.
  • [3] Arp H. 1996, Atlas of Peculiar Galaxies. California Institute of Technology, Pasadena
  • [4] Athanassoula E. 1992, MNRAS, 259, 345
  • [5] Athanassoula E. 1996, in IAU Colloq. 157, Barred Galaxies, ed. R. Buta, D. A. Crocker, & B. G. Elmegreen (PASP Conf series 91), 309
  • [6] Barbon R., Capaccioli M. 1975, A&A, 42, 103
  • [7] Bender R. 1990, A&A, 229, 441
  • [8] Bender R., Saglia R. P., Gerhard O. E. 1994, MNRAS, 269, 785
  • [9] Binney J., Tremaine S. 1987, Galactic Dynamics, Princeton University Press, Princeton
  • [10] Bower G. A., Green R. F., Bender R., et al. 2001, ApJ, 550, 75
  • [11] Capaccioli M., Lorenz H., Afanasjev V. L. 1986, A&A, 169, 54
  • [12] Cardelli J. A., Clayton G. C., Mathis J. S. 1989, ApJ, 345, 245
  • [13] Contopoulos G. 1980, A&A, 81, 198
  • [14] Debattista V. P. 1998, Ph.D. Thesis, Rutgers University
  • [15] Debattista V. P. 2002, in preparation
  • [16] Debattista V. P., Sellwood J. A. 1998, ApJ, 493, L5
  • [17] Debattista V. P., Sellwood J. A. 2000, ApJ, 543, 704
  • [18] Debattista V. P., Williams T. B. 2001, in Galaxy Disks and Disk Galaxies, ed. J. G. Funes & E. M. Corsini, ASP Conf. Ser. 230, ASP, San Francisco, 553
  • [19] Debattista V. P., Williams T. B. 2002, in preparation
  • [20] Dehnen W., & Binney J. J. 1998, MNRAS, 298, 387
  • [21] de Vaucouleurs G., de Vaucouleurs A., Corwin H. G., Buta R. J., Paturel G., Fouquè P. 1991, Third Reference Catalogue of Bright Galaxies. Springer-Verlag, New York (RC3)
  • [22] Elmegreen B. 1996, in IAU Colloq. 157, Barred Galaxies, ed. R. Buta, D. A. Crocker & B. G. Elmegreen (San Francisco: ASP Conf series 91), 197
  • [23] Elmegreen B. G., Elmegreen D. M. 1990, ApJ, 355, 52
  • [24] England M. N., Gottesman S. T., Hunter J. H. 1990, ApJ, 348, 456
  • [25] Eskridge P. B., Frogel J. A., Pogge R. W., et al. 2000, AJ, 119, 536
  • [26] Faber S. M., Tremaine S., Ajhar E. A., et al. 1997, AJ, 114, 1771
  • [27] Garcia A. M. 1993, A&AS, 100, 47
  • [28] Gerhard O. E. 1993, MNRAS, 265, 213
  • [29] Gerssen J., Kuijken K., Merrifield M. R. 1997, MNRAS, 288, 618
  • [30] Gerssen J., Kuijken K., Merrifield M. R. 1999, MNRAS, 306, 926
  • [31] Hernquist, L., Weinberg, M. D. 1992, ApJ, 400, 80
  • [32] Hunter J. H., Ball R., Huntley J. M., England M. N., Gottesman S. T. 1989, ApJ, 324, 721
  • [33] Kent, S. M. 1987, AJ, 93, 1062
  • [34] King D. L. 1985, La Palma Technical Note, N 31
  • [35] Kormendy J. 1985, ApJ, 292, L9
  • [36] Knapen J. H. 1999, in The Evolution of Galaxies on Cosmological Timescales, ed. J. E. Beckman, & T. J. Mahoney (San Francisco: ASP Conference Series 187), 72
  • [37] Knapen J. H., Shlosman I., Peletier R. F. 2000, ApJ, 529, 93
  • [38] Laine S. 1996, Ph. D. Thesis, Florida University.
  • [39] Lauer T. R., Ajhar E. A., Byun Y.-I., et al. 1995, AJ, 110, 2622
  • [40] Lindblad P. A. B., Kristen H. 1996, A&A, 313, 733
  • [41] Lindblad P. A. B., Lindblad P. O., Athanassoula E. 1996, A&A, 313, 65
  • [42] Little, B., Carlberg, R. G. 1991, MNRAS, 250, 161
  • [43] Merrifield M. R., Kuijken K. 1995, MNRAS, 274, 933
  • [44] Miwa T., Noguchi M. 1998, ApJ, 499, 149
  • [45] Möllenhoff C., Heidt J. 2001, A&A, 368, 16
  • [46] Navarro J. F., Frenk C. S., White S. D. M. 1997, ApJ, 490, 493
  • [47] Neistein E., Maoz D., Rix H.-W., Tonry J. L. 1999, AJ, 117, 2666
  • [48] Nilson P. 1973, Uppsala General Catalogue of Galaxies. Royal Society of Sciencies of Uppsala, Uppsala
  • [49] Noguchi M. 1987, MNRAS, 228, 635
  • [50] Osterbrock D. E., Fulbright J. P., Martel, A. R., Keane M. J., Trager S. C., Basri, G. 1996, PASP, 108, 277
  • [51] Ostriker J. P., Peebles P. J. E. 1973, ApJ, 186, 467
  • [52] Ohta K., Masaru H., Wakamatsu K. 1990, ApJ, 357, 71
  • [53] Pogge R. W., Eskridge P. B. 1993, AJ, 106, 1405
  • [54] Salo H. 1991, A&A, 243, 118
  • [55] Sánchez-Portal M., Díaz Ángeles I., Terlevich R., Terlevich E., Álvarez Álvarez M., Aretxaga I. 2000, MNRAS, 312, 2
  • [56] Sancisi R., van Woerden H., Davies R. D., Hart L. 1984, MNRAS, 210, 497
  • [57] Sandage A., Tammann G. A. 1981, A revised Shapley-Ames Catalog of Bright Galaxies, Carnegie Institution of Washington, Washington D.C.
  • [58] Schelgel D. J., Finkbeiner D. P., Davis M. 1998, ApJ, 500, 525
  • [59] Sellwood J. A. 1980, A&A, 89, 296
  • [60] Sellwood J. A., Wilkinson A 1993, Rep. Prog. Phys., 56, 173
  • [61] Sellwood J. A., Evans N. W. 2001, ApJ, 546, 176
  • [62] Sil’chenko O. K. 1999, AJ, 117, 2725
  • [63] Simien F., Prugniel P. 1997, A&AS, 126, 519
  • [64] Sofue Y., Wakamatsu K., Taniguchi Y., Nakai N. 1993, PASJ, 45, 43
  • [65] Taniguchi Y., Murayama T., Nakai N., Suzuki M., Kameya O. 1994, AJ, 108, 468
  • [66] Toomre A. 1981, in The Structure and Evolution of Normal Galaxies, ed. S. M. Fall, & D. Lynden-Bell (Cambridge: Cambridge University Press), 111
  • [67] Tremaine S., Weinberg M. D. 1984, ApJ, 282, L5
  • [68] Tremaine S., Ostriker J. P. 1999, MNRAS, 306, 662
  • [69] van Albada T. S., Sanders R. H. 1982, MNRAS, 201, 303
  • [70] van Albada T. S., Sancisi R. 1986, Phil. Trans. R. Soc. Lond. A, 320, 447
  • [71] van der Marel R. P., Franx M. 1993, ApJ, 407, 525
  • [72] Weinberg M. D. 1985, MNRAS, 213, 451
  • [73] Weiner B. J., Sellwood J. A., Williams T. B. 2001, ApJ, 546, 931