High-resolution radio polarimetry of Vela X
Abstract
We present high-resolution 1.4 GHz Australia Telescope Compact Array polarimetric observations of Vela X, the pulsar wind nebula of the Vela SNR. We find that the linearly polarized emission is only partially correlated with total intensity. There are many depolarization features, some of which are coincident with foreground H filaments. Further study of these should provide measurements of the magnetic field in the remnant’s shell.
Radio Astronomy Laboratory, University of California at Berkeley, 601 Campbell Hall, Berkeley, CA 94720, USA; dbock@astro.berkeley.edu
CSIRO Australia Telescope National Facility, P.O. Box 76, Epping, NSW 1710, Australia
School of Physics, University of Sydney, NSW 2006, Australia
1. Introduction
Vela X is the pulsar wind nebula near the center of the Vela supernova remnant (Bock, Turtle, & Green 1998b). In total intensity, the radio emission is dominated by synchrotron filaments which have no clear optical counterpart (Bock et al. 1998a). The remnant’s distance of 350 pc111Recent measurements of the pulsar’s distance include an optical parallax of pc (Caraveo et al. 1991) and a radio parallax of pc (Legge 2001) makes it one of the nearest SNRs, and thus one of the easiest to study. Its age, 10,000 yr, is much larger than that of the Crab Nebula, and we can hope to learn something about remnant evolution by comparing the sources. High quality interferometric polarimetry now makes it possible to study at sub-arcminute resolution the magnetic fields in pulsar-powered nebulae, and in the Galaxy as a whole.
2. Observations
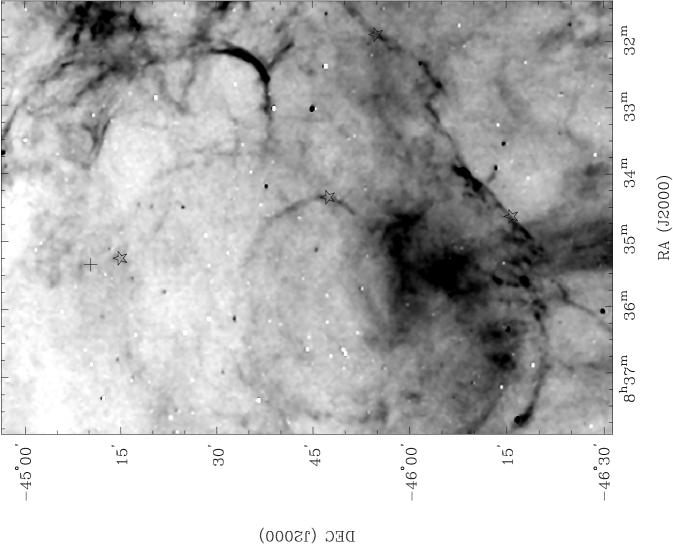
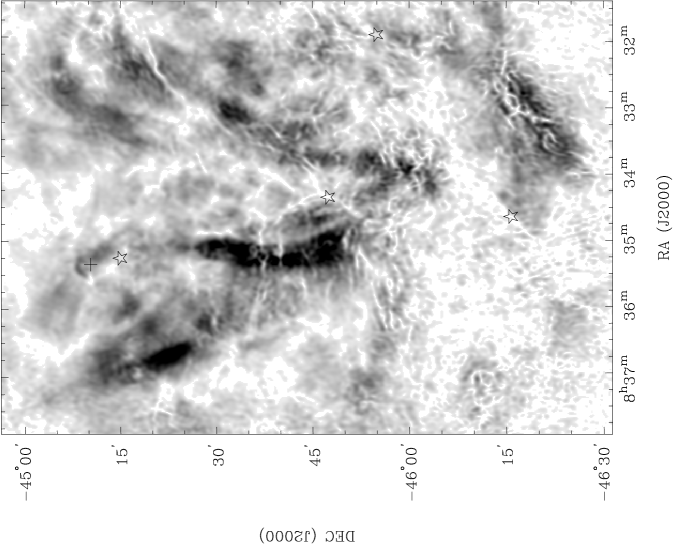
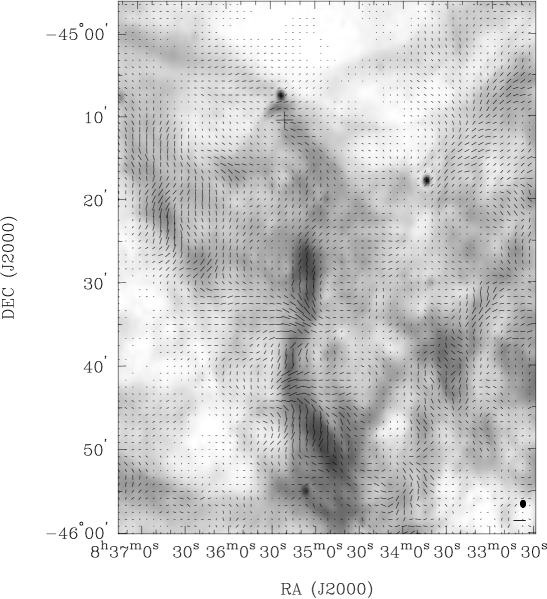
Observations of Vela X at 1.4 GHz were obtained with the Australia Telescope Compact Array (ATCA) using configurations which yielded a beam. Images were made using multi-frequency synthesis and deconvolution was performed with a maximum entropy method algorithm. The total intensity image includes large-scale structure which was measured with the Parkes Telescope. However, there is little structure in polarized intensity larger than that sampled by the interferometer, so single-dish data has not been included in the polarization images. See Sault, Bock, & Duncan (1999) for additional details. A grayscale image showing the polarized intensity measured from part of Vela X is shown in Figure 1. The emission is up to 60% linearly polarized; there is no detectable circular polarization. Figure 1 also shows the H emission from the same region (from the survey of Buxton, Bessell, & Watson 1998). Vectors representing the intensity and E-field direction of the polarized emission are plotted on a total intensity image in Figure 2.
3. Discussion
The most striking aspect of the polarimetric image of Vela X (Figure 1) is the complex network of ‘canals’ criss-crossing the broader synchrotron filaments. These canals are unresolved, indicating that they are probably due to Faraday depolarization within the synthesized beam, caused by rapid spatial changes in the foreground rotation measure (RM). They have no counterpart in total intensity. Similar features have been seen in the background Galactic radiation (Gaensler et al. 2001, and references therein). However, in the present case we have been able to identify optical counterparts for many of the canals among H filaments originating in the shell of the Vela SNR (Figure 1). By considering the geometry of the filaments (which are probably sheets in projection) and obtaining electron densities in the region from further optical studies, we expect to be able to make a direct measurement of the compressed magnetic field in the Vela SNR shell.
The underlying more diffuse linearly polarized emission has some overall corellation with total intensity. However, there are many regions of disagreement. These could be either intrinsic to the source (i.e. due to variations within the internal magnetic fields) or result from depolarization by some intervening more compact region. In the latter case, their counterpart in total intensity is the underlying diffuse emission which forms the majority of the flux density measured from Vela X.
The polarization E-vector direction (Figure 2) is a useful diagnostic of the magnetic field. In this region, the RM is approximately 40 rad m-2 (Milne 1995), indicating that the magnetic field is generally aligned with the E-vectors plotted, and thus lies along the filaments (the discrepant E-vectors half-way along the central filament correspond to a region of higher RM). We note that the ‘wisp’ just to the north-east of the pulsar (Bietenholz, Frail, & Hankins 1991) and the filament extending south do not appear symmetric across the pulsar. Further work to make high-resolution corrections for Faraday rotation will allow a more detailed interpretation.
References
Bietenholz, M. F., Frail, D. A., Hankins, T. H. 1991, ApJ, 376, L41
Bock, D. C.-J., Frail, D. A., Sault, R. J., Green, A. J., & Milne, D. K. 1998a, Mem. Soc. Astron. Italiana, 69, 919
Bock, D. C.-J., Turtle, A. J., & Green, A. J. 1998b, AJ, 116, 1886
Buxton, M., Bessell, M., Watson, B. 1998, Publ. Astron. Soc. Australia, 15, 24
Caraveo, P. A., De Luca, A., Mignani, R. P., & Bignami, G. F. 2001, ApJ, 561, 930
Gaensler, B. M., Dickey, J. M., McClure-Griffiths, N. M., Green, A. J., Wieringa, M. H., & Haynes, R. F. 2001, ApJ, 549, 959
Legge, D. 2001, PhD Thesis, University of Tasmania
Milne, D. K. 1995, MNRAS, 277, 1435
Sault, R. J., Bock, D. C.-J., & Duncan, A. R. 1999, A&AS, 139, 387