RR Lyrae variables in Centauri: a theoretical route
Abstract
We present a theoretical approach to infer information about RR Lyrae variables from the morphology of their light curves. The method, already successfully applied to the field first overtone variable U Comae, is now tested on a RRab variable in the globular cluster Cen. We show that, with this method, it could be possible to give an estimate of the distance modulus of the cluster with an uncertainty not larger than 0.1 mag. The predicted variable luminosity and mass are well within the range of theoretical evolutionary expectations giving the “feeling” of a full compatibility between pulsational and evolutionary theory. However, before completely relying on the method, further tests are needed; the goal is that a well tested and well calibrated pulsational theory could provide reliable distance moduli from just one (or few) RR Lyrae stars.
Dipartimento di Fisica, Universitá di Pisa, Piazza Torricelli 2, I 56100 Pisa and INFN, via Livornese 1291, I 56010 Pisa, Italy - vittorio@astr18pi.difi.unipi.it
Dipartimento di Fisica, Universitá di Pisa, Piazza Torricelli 2, I 56100 Pisa and INFN, via Livornese 1291, I 56010 Pisa, Italy - scilla@astr18pi.difi.unipi.it
Osservatorio Astronomico di Capodimonte, Via Moiarello 16, I 80131 Napoli, Italy - marcella@na.astro.it


1. Introduction
As well known, Cen is not only the largest globular cluster in our Galaxy but also contains a huge amount of RR Lyrae variables, of which more than 150 have already been detected in the cluster region. According to these features, Cen could appear as an excellent target for investigating the evolutionary status of cluster stars and, in particular, to link the pulsational properties of RR Lyrae variables to their evolutionary parameters. Moreover, one can take advantage of quite a rich set of observational data as the beautiful light curves provided by Kaluzny et al. (1997) for 131 RR Lyrae stars, within the frame of the OGLE experiment.


However, Cen definitely discloses the rare peculiarity of member stars with a noticeable spread of metallicity. In probable connection with such a feature, one also finds a large spread of RR luminosities and a rather peculiar distribution of RR periods, casting some doubts on the classification of this cluster as so a “bona fide” Oosterhoff II. The occurrence of this metallicity spread obviously complicates things, but it offers the exciting opportunity of studying the metallicity effects on the luminosity of Horizontal Branch stars, which is a long debated question connected with relevant issues as globular cluster distances and ages.
Our attention on the problem was raised by the recent paper by Rey et al. (2000), who presented metallicity estimates for 131 RR Lyrae variables in Cen, as based on the use of the hk index. Some general features of the cluster RR Lyrae population have been already discussed in that paper, as well as in a following paper by Clement & Rowe (2000). In this context, we approached the problem on the theoretical side, aiming to explore the degree of concordance between the quoted sets of relevant observational data and the predictions of current theories concerning both stellar evolution and stellar pulsation. However, when entering into this matter one finds that the available estimates for both the RR luminosities and metallicities, though representing an highly valued step in our knowledge of cluster stars, still leave some room for uncertainties. As a matter of the fact, by comparing field to field mean magnitudes of RR Lyrae stars, as given in Figure 1 (left panel) from the paper by Kaluzny et al. (1997), one finds that discrepancies can reach 0.1 mag. Thus one is dealing with rather accurate light curves but with a not negligible uncertainty in the magnitude zero point.
The right panel of the same Figure 1 shows that a not negligible uncertainty affects also metallicity estimates. Bearing in mind as a warning such an “imperfect” observational scenario, in the following we will discuss observational data to the light of current theoretical predictions.
2. Luminosities of RR Lyrae variables
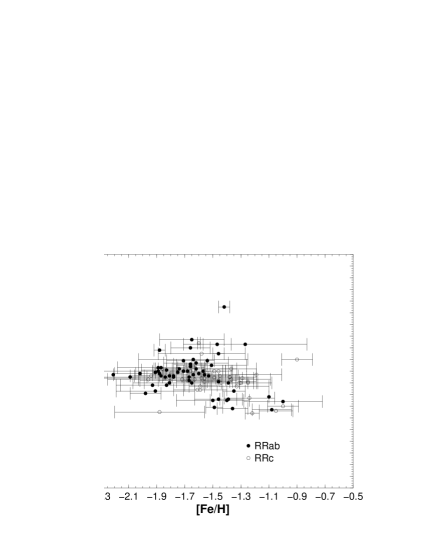
By merging the already quoted data by Kaluzny et al. (1997) and by Rey et al. (2000), one is dealing with a subsample of 105 cluster RR Lyrae variables with observational estimates for both mean magnitudes and metallicity. Figure 2 shows the run of mean magnitudes versus metallicity, where present uncertainties on the metallicity are reported at their face values. The possible correlation between the two quoted evolutionary parameters has been already addressed by Rey et al. (2000) and it does not deserve further discussions. Here we only notice that the rather large uncertainties do not allow a significant comparison between theory and single stars, so that one is forced to approach the problem along a“softer” route.
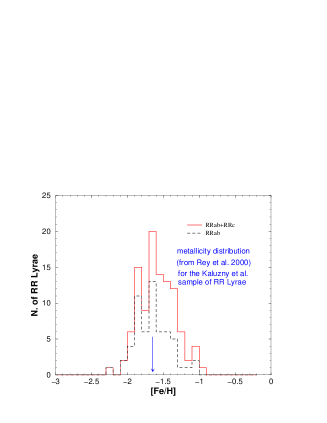
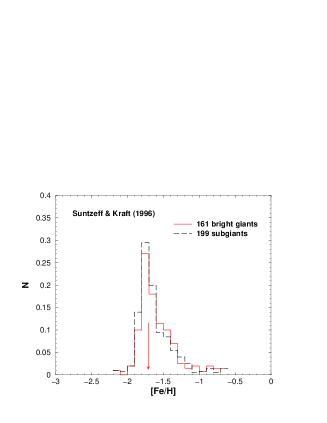
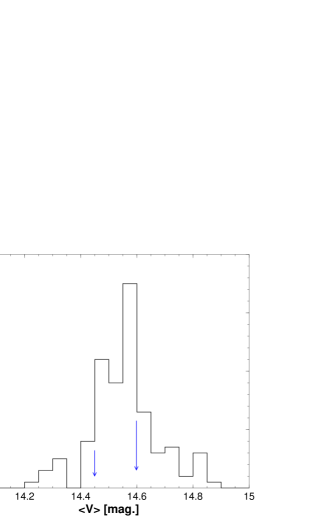
With this aim, Figure 3 (left panel) shows the metallicity frequency histogram for RR Lyrae stars in the quoted subsample, as compared with metallicity estimates as given for 161 bright giants and 199 subgiants in the cluster by Suntzeff & Kraft (1996: right panel). As already discussed by Rey et al. (2000), when uncertainties in the calibration of the hk index are taken into account, the two distributions appear in reasonable agreement and, from the more accurate data on giants and subgiants, one can safely assume that the large majority of RR Lyrae stars should have a metallicity roughly in the range [Fe/H]. From the magnitude frequency histogram of the subsample given in Figure 4, one further obtains that the bulk of Cen RR Lyrae variables has a mean visual magnitude in the range V=14.4514.60 mag. Now we are in the position of asking whether current evolutionary theories are consistent with these observational data. This is of course quite a limited question, but also (possibly) the only significant question compatible with the scarce accuracy of the data one is dealing with.
By adopting from Thompson et al. (2001) a cluster distance modulus (V-MV)= 14.05 0.11, the observational scenario tell us that RR Lyrae stars, approximately covering the metallicity range , span a range of luminosity between MV= 0.40 and 0.55, with the additional uncertainty of mag., due to the uncertainty in the distance modulus. Figure 5 compares this observational evidence with theoretical predictions concerning the luminosity of Horizontal Branch stars with Z=0.0004 and Z=0.001, as given by Cassisi et al. (1998) and by present computations. One derives the comforting evidence that the observed spread in luminosity appears in good agreement with current theoretical predictions. Formally, one also finds a good agreement regarding the absolute magnitude of the stars. However, owing to the quoted indetermination in the cluster distance modulus, such a nominal agreement cannot be used to disentangle the thorny problem of theoretical HB luminosities, which is still waiting for a firm settlement (see, e.g., Caputo et al. 1999; Castellani et al. 2000, for a general discussion on that matter) and which would require much firmer observational constraints.
3. The pulsational route


In the previous section we dealt with observations concerning the CM diagram location of the Cen RR Lyrae variables, without any regard to the observed pulsational properties. However, in the last years a great deal of investigation has been devoted to the connection between pulsational properties of RR Lyrae variables and structural parameters, such as the pulsator mass, luminosity and effective temperature. As well known, a firm knowledge of the mechanisms governing such a connection would be of paramount relevance, allowing the use of easily observed pulsational features to obtain independent information on the evolutionary status of the pulsating structure. As a matter of fact, the use of pulsational periods to constrain evolutionary stellar structures has already a long history, starting from the pioneering paper by van Albada & Baker (1971). However, only more recently the development of hydrodynamic non linear computational codes has allowed the prediction of pulsational amplitudes, adding further constraints to the pulsator structures (see, e.g., Bono & Stellingwerf 1994; Bono et al. 1997a). At the same time, one has to notice that periods and amplitudes are only a partial and strongly limited parameterization of the star pulsational behavior, whereas modern computations do produce predictions about the whole pulsator light curve, thus giving much more severe constraints for the comparison with observation. In this context, the use of Fourier parameters (see, e.g., Kovacs & Jurcsik 1996; Jurcsik 1998; Poretti 1999) is indeed a new way to take into account the shape of the light curve in the discussion of pulsator properties. However, the best fit of the whole light curve appears as an obvious ultimate goal of pulsational theories. We have recently followed this way, attempting to reproduce the peculiar light curve of the field RRc U Comae (Bono, Castellani & Marconi 2000).
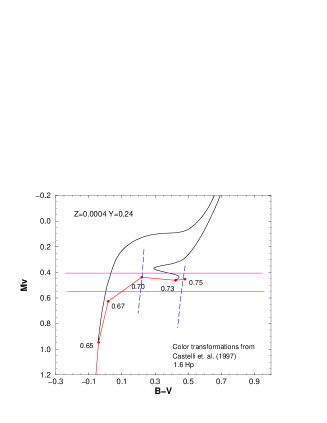
The adopted procedure was based on the well known occurrence that pulsators periods are expected to depend on the star mass, luminosity and effective temperature. According to such an occurrence, given the observed period (P=0.29 days) and by assuming the pulsator mass in the range predicted by evolutionary theories, for each assumed value of the luminosity L, there is only one value of the effective temperature Te. Thus one has to investigate whether in a suitable range of luminosity can exist a theoretical light curve reproducing the observed one. This approach was indeed quite successful and Figure 6 shows that theoretical predictions reach an excellent agreement with observational data in various photometric bands. The fit is obtained for a quite reasonable value of the predicted luminosity, also in agreement with previous independent estimates of such a parameter.
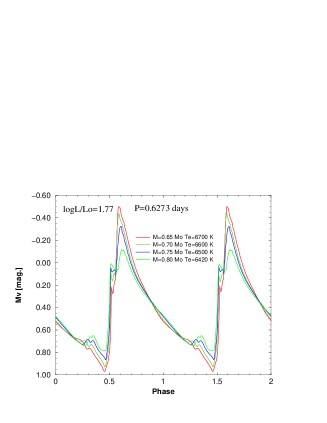
To appreciate the sensitivity of the method let us show in Figure 7 the variation of the predicted light curve, at fixed period and pulsator mass, when the effective temperature is varied by steps of only 50oK (and Mbol by steps of 0.03 mag. to keep the period constant). Taking the theoretical results at their face value one should conclude that the fitting of the light curve should be able to fix the star luminosity and effective temperature with an unprecedented degree of accuracy!
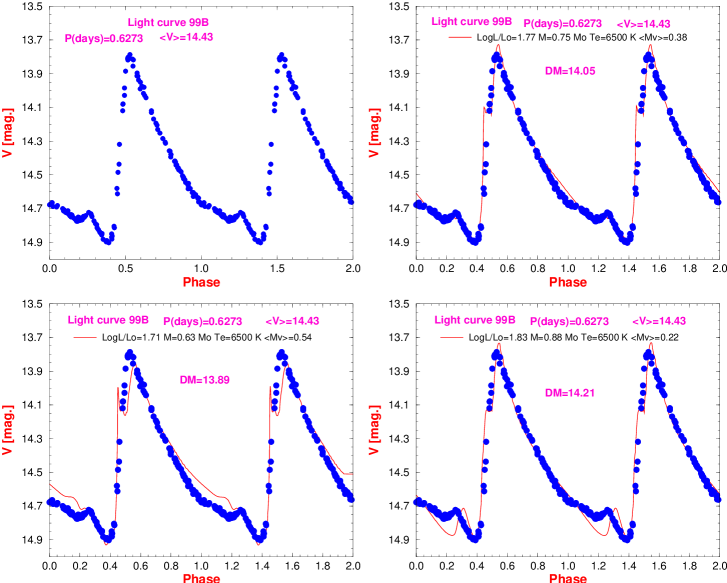
According to this successful result, in the occasion of this meeting we were stimulated to explore whether a similar approach can be repeated to derive information on the luminosity of Cen RR variables. In this case we choose an ab-type variable (99B in the Kaluzny list) whose light curve is reported in Figure 9, with the labelled value of the observed period and mean V-magnitude. The metallicity estimate for this star (from Rey et al. 2000) is [Fe/H] = -1.740.05; thus all computations have been performed under the assumption Z=0.0004, even though the results are barely sensitive to the metallicity value within the metal poor range (Bono et al. 1997b, Caputo, Marconi, Santolamazza 1998).
However, in this case we will adopt a slightly different approach which avoid assumptions about the star masses and which runs as follows:
i) Let us again assume the star luminosity L as a free parameter.
ii) Given the observed period, for each adopted value of the luminosity and for each assumed effective temperature, there is only one value for the mass and thus only one predicted light curve.
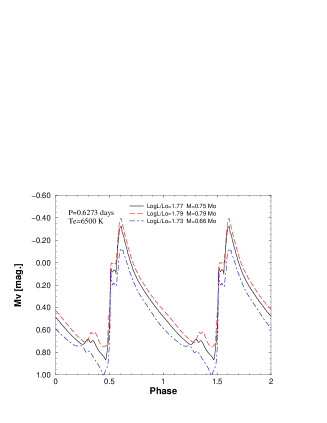
iii) As shown in Figure 8 (left panel), theory predicts that at each given luminosity level the amplitude is continuously decreasing with the effective temperature.
iv) By requiring that the predicted light curve shows the observed amplitude, for each assumed luminosity level, one finds one and only one predicted light curve.
As a result, for each assumption about the star luminosity, one obtains a value of Te, a value for the stellar mass, a light curve with the observed period and amplitude and a mean absolute visual magnitude for the pulsator, i.e., a cluster distance modulus. One eventually is dealing with a sequence of light curves only depending on the assumed star luminosity, and the best fitting with observation -if any- has to be found among this linear set of results.
The procedure is made easier by the (theoretical) evidence that for each given effective temperature the pulsational amplitude is only slowly depending on the assumed luminosity level, as shown in Figure 8 (right panel). Thus the effective temperature derived when exploring the first luminosity level gives a useful indication of the temperatures needed at different luminosities to account for the observed pulsational amplitude.
As a result of this procedure we find that a satisfactory, though not perfect, best fitting requires a star luminosity of logL/L⊙1.77, surprisingly corresponding to the cluster distance modulus 14.05 already adopted in the previous section (see Figure 9, upper right panel). As shown in the same Figure 9 (lower panels), by moving the adopted distance modulus by 0.15 mag. the fitting appears definitely worse, so that one can estimate a (nominal) uncertainty in the procedure not larger than 0.1 mag, i.e., a bit larger than in the quoted U Comae case but still reasonably small.
Let us finally notice that the fitting has been achieved for a mass value (M=0.75M⊙) which appears well within the range of theoretical evolutionary expectations, giving to the whole predicted scenario at least the “flavour” of a full compatibility.
4. Final remarks
In the previous section we have shown how modern pulsational computations, when applied to reproduce the observed light curves of variable stars, appear in principle able to give rather firm constraints on the evolutionary parameters of the pulsating structures and, in turn, on the distance modulus of the parent cluster, if any. However, one cannot forget that this is just a “theoretical truth” and the question arises of how true is this truth!
As a matter of fact, one has to remind that modern pulsational hydrodynamical computations are quite sophisticated, requiring a detailed mathematical description of the turbulent convective model and of the coupling between dynamical and convective motions. As a consequence, one cannot exclude that theoretical results are affected by some unknown systematic errors. Thus, to tell the truth, we were already rather surprised of the best-fitting capability of the adopted pulsational theory, as well as of the quite reasonable scenario emerging from this fitting. In our feeling such an agreement cannot be casual, indicating that modern pulsational computations are, at least, on the right way.
However, deep tests of the theory are still needed. As an example, it would be very useful to have much firmer information on the pulsator effective temperature, to be compared with the temperature required by the pulsational fitting. The availability of observational velocity curves will be also of great relevance, allowing a tight comparison with the predicted pulsational behaviour (see also Bono, Castellani & Marconi 2000). Last, but not least, precise [Fe/H] value would be highly desirable, since some details of the predicted light curves could depend on the adopted metallicity.
Similar tests of the pulsational theory would be of paramount relevance, since - as a final goal - a well tested and well calibrated pulsational theory will provide reliable distance moduli from just one (or few) RR Lyrae variables, supporting and improving the theoretical scenario discussed by Wood (1997) in connection with bump Chepheids in the Large Magellanic Cloud.
Acknowledgments.
We warmly thank Filippina Caputo for a critical reading of the manuscript.
References
Bono, G., & Stellingwerf, R.F. 1994, ApJS93, 233
Bono, G., Caputo, F., Castellani, V., & Marconi, M. 1997a, A&AS121, 327
Bono, G., Caputo, F., Cassisi, S., Incerpi, R., & Marconi M. 1997b, ApJ483, 811
Bono, G., Castellani, V., & Marconi M. 2000, ApJ532, L129
Caputo, F., Marconi, M, & Santolamazza P. 1998, MNRAS293, 364
Caputo F., Castellani V., Marconi M., & Ripepi V. 1999, MNRAS306, 185
Castellani V., Degl’Innocenti S., Girardi L., Marconi M., Prada Moroni P.G. & Weiss A. 2000, A&A354, 150
Castelli, F., Gratton, R.G., & Kurucz, R.L. 1997, A&A318, 841
Cassisi S., Castellani V., Degl’Innocenti S., & Weiss A. 1998, A&AS129, 267
Clement C.M., & Rowe J. 2000, AJ120, 2579
Demarque, P., Zinn, R., Lee, Y.W., & Yi, S., 2000, AJ, 119, 1398
Fernley, J., Skillen, I., & Burki, G. 1993, A&AS97, 815
Heiser, A.M. 1996, AJ112, 2142
Jurcsik, J. 1998, ApJ506, L113
Kaluzny, J. et al. 1997, A&AS125, 343
Kovacs, G., & Jurcsik, J. 1996, ApJ466, L17
Longmore, A.J., Dixon, R., Skillen, I., Jameson, R.F., & Fernley, J.A. 1990, MNRAS247, 684
Poretti, E. 1999, A&A346, 487
Rey, S.C. et al. 2000, AJ119, 1824
Thompson et al. 2001, ApJ121, 3089
van Albada,T.S. & Baker N., 1971, ApJ169, 311
van Leeuwen, F., Le Poole, R. S., Reijns, R. A., Freeman K. C., & de Zeeuw, P. 2000, A&A360, 472
Wood, P.R., Arnold, A.S., & Sebo K.M. 1997, ApJ485, L25