Infrared Spectra of the Subluminous Type Ia Supernova 1999by
Abstract
Near-infrared (NIR) spectra of the subluminous Type Ia supernova SN 1999by are presented which cover the time evolution from about 4 days before to 2 weeks after maximum light. Analysis of these data was accomplished through the construction of an extended set of delayed detonation (DD) models covering the entire range of normal to subluminous SNe Ia. The explosion, light curves (LC), and the time evolution of the synthetic spectra were calculated self-consistently for each model with the only free parameters being the initial structure of the white dwarf (WD) and the description of the nuclear burning front during the explosion. From these, one model was selected for SN 1999by by matching the synthetic and observed optical light curves, principly the rapid brightness decline. DD models require a minimum amount of burning during the deflagration phase which implies a lower limit for the mass of about and consequently a lower limit for the SN brightness. The models which best match the optical light curve of SN 1999by were those with a production close to this theoretical minimum. The data are consistent with little or no interstellar reddening () and we derive a distance or Mpc for SN 1999by in agreement with other estimates.
Without any modification, the synthetic spectra from this subluminous model match reasonably well the observed IR spectra taken on May 6, May 10, May 16 and May 24, 1999. These dates correspond roughly to d, 0 d, and 6 d and 14 d after maximum light. Prior to maximum, the NIR spectra of SN 1999by are dominated by products of explosive carbon burning (O, Mg), and Si. Spectra taken after maximum light are dominated by products of incomplete Si burning. Unlike the behavior of normal Type Ia SNe, lines from iron-group elements only begin to show up in our last spectrum taken about two weeks after maximum light. The implied distribution of elements in velocity space agrees well with the DD model predictions for a subluminous SN Ia. Regardless of the explosion model, the long duration of the phases dominated by layers of explosive carbon and oxygen burning argues that SN 1999by was the explosion of a white dwarf at or near the Chandrasekhar mass.
The good agreement between the observations and the models without fine-tuning a large number of free parameters suggests that DD models are a good description of at least subluminous Type Ia SNe. Pure deflagration scenarios or mergers are unlikely and helium-triggered explosions can be ruled out. However, problems for DD models still remain, as the data seem to be at odds with recent 3-D models of the deflagration phase which predict significant mixing of the inner layers of the white dwarf prior to detonation. Possible solutions include the effects of rapid rotation on the propagation of nuclear flames during the explosive phase of burning, or extensive burning of carbon just prior to the runaway.
1 Introduction
On April 30, SN 1999by was independently discovered at about by Arbor et al. (1999), and Papenkova, Li, & Filippenko (1999). Images with the Katzman Automatic Imaging Telescope (Treffers et al., 1997; Li et al., 1999) of the same field provide an upper limit of on April 25.2 UT. The supernova (SN) was found in the Sb galaxy NGC 2841 which has been the host of three previous supernovae: SN 1912A, SN 1957A, and SN 1972R (Papenkova, Li, & Filippenko, 1999). Based on optical spectra, SN 1999by was identified as a Type Ia SN (Gerardy & Fesen, 1999). Shortly thereafter, Garnavich, Jha, & Kirshner (1999) reported that SN 1999by showed stronger than normal Si II 5800 Å absorption and depressed flux near 4000 Å, suggesting that SN 1999by would be a significantly subluminous Type Ia event.
According to Bonanos et al. (1999), SN 1999by reached a maximum light of on UT 1999 May 10.5, and a maximum in the band of . The Lyon/Meudon Extragalactic Database (LEDA)111http://www-obs.univ-lyon1.fr/leda/home_leda.html, gives the heliocentric radial velocity of NGC 2841, corrected for Virgo infall, as km s-1. Using km s-1 Mpc-1 puts the distance to NGC 2841 at 12.5 Mpc with a distance modulus of . Using this distance modulus and the photometry of Bonanos et al. (1999), the absolute peak magnitudes of SN 1999by are and . Thus, SN 1999by is underluminous by roughly 2.5 magnitudes as compared to a typical Type Ia supernova (SN Ia).
Detailed analysis of the optical light curves (LCs) by Toth & Szabo (2000) confirm these basic results. The light curve of SN 1999by shows a very steep post-maximum brightness decline of to . Based on detailed fits of the LCs, Toth & Szabo (2000) find the interstellar reddening to be which is in agreement with the values for galactic reddening given by Schlegel et al. (1998, ), and Burstein & Heiles (1982, ). Recently, Garnavich et al. (2001) provided detailed optical LCs and spectra and found values consistent with previous data.
These measurements imply that SN 1999by was as underluminous as SN 1991bg, the prototypical example of the subluminous Type Ia subclass (Filippenko et al., 1992; Leibundgut et al., 1993). Other members include SN 1992K (Hamuy et al., 1996a, b), SN 1997cn (Turatto et al., 1998), and SN 1998de (Modjaz et al., 2000). Some defining characteristics of the subclass are rapidly declining light curves (), peak magnitudes fainter than normal by 2–3 mag, and redder colors at maximum light ( 0.4–0.5m). One of the currently active areas in SNe Ia research concerns the nature of these subluminous events. Theoretical interpretations of subluminous SN Ia include all three types of explosion mechanism: the centrally triggered detonation of a sub-Chandrasekhar mass WD, deflagration and delayed detonations of massive WD and two merging WDs (see sect. 3 & Woosley & Weaver, 1994 ; Höflich et al., 1995; Nugent et al., 1995, Milne et al. 1999). The possibility has also been raised that SN1991bg-like SNe Ia should not be classified with other SNe Ia at all as they may arise from different progenitors.
SN 1999by is one of the best observed SNe Ia with data superior to that of SN 1991bg. In addition to the studies of optical light curves and spectra mentioned above, detailed polarization spectra of SN 1999by have been obtained and analyzed (Howell et al., 2001). Whereas ‘normal’ SNe Ia tend to show little or no polarization (e.g. Wang, Wheeler, & Höflich, 1997), this supernova was significantly polarized, up to 0.7%, indicating an overall asphericity of . This result suggests that there may be a connection between the observed asphericity and the subluminosity in SNe Ia.
In recent years it has become apparent that infrared spectroscopic observations can be used as valuable tools to determine the chemical structure of SN Ia envelopes. For instance, near-infrared spectra can be used to locate the boundaries between explosive carbon and oxygen burning, or between complete and incomplete silicon burning by measuring Mg II, Ca II and iron-group lines (Wheeler et al., 1998). However, the difficulties involved in obtaining high quality infrared spectra of supernovae has limited IR studies to a small handful of objects. The study of SN 1994D by Meikle et al. (1996) is the only one to include both pre- and post-maximum spectra. Since most of their spectra was of the 1–1.3 µm region, Meikle et al. (1996) concentrated on determining the origin of a feature at 1.05 µm. They concluded that this feature might be due to either He I 1.083 µm or Mg II 1.0926 µm, but found difficulties with both identifications. Detailed modeling of SN 1994D and SN 1986G was able to reproduce the basic NIR spectral features and their evolution (Höflich, 1997; Wheeler et al., 1998). In particular, the identification of the 1.05 µm feature in SN 1994D as due to Mg II could be established (recently confirmed by Lentz et al. 2001), and a broad feature, appearing between and 1.9 µm was identified as a blend of iron-group elements.
We note that the nature of subluminous SNe Ia is important for the use of SNe Ia as distance indicators. In particular, the calibration of the brightness decline relation depends critically on subluminous SNe Ia because they significantly increase the required baseline observations. From this perspective, it may turn out to be critical to determine whether all SNe Ia form a homogeneous class of objects or not. However, current limitations of model calculations will not allow us to improve the accuracy of the current estimates for the absolute distance to SN 1999by, and the possible implications of our results on the use of SNe Ia for cosmology is not the subject of this paper.
In this paper, we present near-infrared spectra of SN 1999by covering the time evolution of the supernova from about four days before to two weeks after maximum light. Detailed models of the SN explosion based on a delayed detonation (DD) scenario are used to analyze the data. The explosion models, light curves, and synthetic spectra are calculated in a self-consistent manner. Given the initial structure of the progenitor and description of the nuclear burning front, the light curves and spectra are calculated from the explosion model without any further tuning. The observations and data reduction are discussed in §2. In §3, general properties of the explosion models, light curves and spectra are discussed for normal and subluminous SNe Ia within the DD scenario. In §4, a specific model for this SN is chosen by matching the properties of the predicted light curve to those observed in optical studies of SN 1999by. Synthetic optical and IR spectra for this model are then presented and the latter are compared to the observed IR spectra. Detailed line identifications for the infrared features are provided. The effects on the predicted spectra of large scale mixing during the deflagration phase also examined. In §5, we discuss the implications for progenitors and alternative explosion mechanisms. We close in §6 with a final discussion of the results for SN 1999by, and put our findings in context with other SNe Ia and different explosion scenarios.
2 Observations
Low-dispersion (R 700), near-infrared spectra of SN 1999by from 1.0–2.4 µm were obtained with the 2.4m Hiltner Telescope at MDM Observatory during the nights of 6–10 May 1999. The data were collected using TIFKAM (a.k.a. ONIS), a high-throughput infrared imager and spectrograph with an ALLADIN 512 1024 InSb detector. This instrument can be operated with standard J, H, and K filters for broadband imaging, or with a variety of grisms, blocking filters, and an east-west oriented slit for low () and moderate () resolution spectroscopy.
SN 1999by was observed with three different spectroscopic setups, which covered the 0.96–1.80 µm, 1.2–2.2 µm, and 1.95–2.4 µm wavelength regions. The observations were broken into multiple 600 s exposures. Between each exposure, the supernova light was dithered along the slit to minimize the effect of detector defects and provide first-order background subtraction. Total exposure times vary from spectrum to spectrum and are listed in the log of NIR observations in Table 1.
Wavelength calibration of the spectra was achieved by observing neon, argon, and xenon arc lamps. The spectra were corrected for telluric absorption by observing A stars and early G dwarfs at similar airmass, chosen from the Bright Star Catalog (Hoffleit & Jaschek, 1982). Applying the procedure described by Hanson, Reike, & Luhman (1998), stellar features were removed from the G dwarf spectra by dividing by a normalized solar spectrum (Livingston & Wallace, 1991; Wallace, Hinkle, & Livingston, 1993)222NSO/Kitt Peak FTS data used here were produced by NSF/NOAO.. The results were used to correct for telluric absorption in the A stars. Hydrogen features in the corrected A star spectra were removed from the raw A star spectra and the results were used to correct the target data for telluric absorption. [For further discussion of this procedure see Hanson, Reike, & Luhman 1998; Hanson, Conti, & Rieke 1996, and references therein.] The instrumental response was calibrated by matching the continuum of the A star telluric standards to the stellar atmosphere models of Kurucz (1993).
The first three nights (6-8 May) were photometric, and J, H, and K broadband images of SN 1999by and Persson et al. (1998) photometric standards. The resulting photometry is listed in Table 1 and was used to set the flux levels of the corresponding spectra. A square bandpass was assumed and the flux levels thus attained are believed accurate to 20–30%. For May 9 and 10 no flux information was available, but the observed spectral bands had large overlaps, and the relative flux levels were set by matching the data in the overlapping regions.
Near-infrared spectra of a star north and west of SN 1999by (Papenkova, Li, & Filippenko, 1999) were also obtained and reduced in the same manner. This star was then used as a local relative spectrophotometric standard to reduce spectroscopic data from later observing runs. Spectra of SN 1999by covering 1.0–1.8 µm were collected on five more nights during the following two weeks (16 May, 18 May, 20 May, 21 May and 24 May). The first three were obtained by P. Martini and A. Steed using TIFKAM on the 2.4m telescope at MDM, and the last two by S. Sakai using TIFKAM on the 2.1m telescope at the Kitt Peak National Observatory.
Figure 1 shows a plot of all the NIR spectra. Since absolute fluxes were only available for the first three spectra, the data are presented in arbitrary flux units, and they have been shifted vertically for clarity. Regions of very low S/N due to strong telluric absorption have been omitted. The epochs listed are relative to 10 May 1999, the date of given by Bonanos et al. (1999). Like all the subsequent plots, the data have been corrected to the 638 km s-1 redshift of NGC 2841 (de Vaucouleurs et al., 1991).
3 Models for the Explosion, Light Curves, and Spectra
There is general agreement that SNe Ia result from some process involving the combustion of a degenerate white dwarf (Hoyle & Fowler, 1960). Within this general picture, three classes of models have been considered: (1) An explosion of a CO-WD, with mass close to the Chandrasekhar limit, which accretes mass through Roche-lobe overflow from an evolved companion star (Whelan & Iben, 1973). The explosion is triggered by compressional heating near the WD center. (2) An explosion of a rotating configuration formed from the merging of two low-mass WDs, caused by the loss of angular momentum through gravitational radiation (Webbink, 1984; Iben & Tutukov, 1984; Paczyński, 1985). (3) Explosion of a low mass CO-WD triggered by the detonation of a helium layer (Nomoto, 1980; Woosley, Weaver, & Taam, 1980; Woosley & Weaver, 1986).
Only the first two models appear to be viable for normal Type Ia SNe as the third, the sub-Chandrasekhar WD model, has been ruled out on the basis of predicted light curves and spectra (Höflich et al., 1996b; Nugent et al., 1997). Still, theoretical interpretations of subluminous SN Ia include all three types of explosion mechanism (Woosley & Weaver, 1994; Höflich, Khokhlov, & Wheeler, 1995; Nugent et al., 1995; Milne, The, & Leising, 1999). The possibility has also been raised that the subluminous SN 1991bg-like supernovae may arise from different progenitors and should not be classified with other SNe Ia at all.
Within models, it is believed that the burning front starts as a subsonic deflagration. However, the time evolution of the burning front is still an open question. That is, whether the deflagration front burns through the entire WD (Nomoto, Thielemann, & Yokoi, 1984), or alternatively, transitions into a supersonic detonation mode as suggested in the delayed detonation (DD) model (Khokhlov, 1991; Woosley & Weaver, 1994; Yamaoka et al., 1992). DD models have been found to reproduce the optical and infrared light curves and spectra of ‘typical’ SNe Ia reasonably well (Höflich 1995, H95 hereafter; Höflich & Khokhlov 1996; Höflich et al. 1996b; Fisher et al. 1998; Nugent et al. 1997; Wheeler et al. 1998; Lentz et al. 2001).
In addition, DD models provide a natural explanation for the brightness decline relation observed in the light curves of SNe Ia (Phillips et al., 1987; Hamuy et al., 1995, 1996b; Suntzeff et al., 1999). This is a consequence of the temperature dependence of the opacity and the lack of a dependence of the explosion energy on the amount of produced (Höflich, Müller, & Khokhlov 1993; Khokhlov, Müller, & Höflich 1993; Höflich et al. 1996b; Mazzali et al. 2001). Thus, within the delayed detonation scenario, both normal and subluminous SNe Ia can be explained as variants of a single phenomenon (H95, Höflich, Khokhlov, & Wheeler 1995, Umeda et al. 1999). This makes the DD model an attractive scenario and it is used as the basis for our present analysis.
In our models, the explosions LCs and spectra are all calculated self-consistently. Given the initial structure of the progenitor and a description of the nuclear burning front, the light curves and spectra are calculated directly from the explosion model without any additional parameters. Since the predicted observables follow directly from the supernova model, this approach provides a direct link between the observations and the explosion physics and progenitor properties.
Finally, we note that detailed analyses of observed SN Ia spectra and light curves indicate that mergers (Benz et al., 1990) and pure deflagration SNe (such as the W7 model) could contribute to the population of bright SNe Ia (Höflich & Khokhlov 1996, hereafter HK96; Hatano et al. 2000). On the other hand, it is not obvious that subluminous SNe Ia and the brightness decline relation can be understood within pure deflagration models. In particular, the amount of burning, and consequently the explosion energy, will be strongly correlated with production. Since no detailed studies for deflagration models have been performed, these models cannot be ruled out but, as we discuss in §5, the IR spectra of SN 1999by are hard to reconcile with a pure deflagration.
3.1 Numerical Methods
3.1.1 The Explosion
Despite recent progress in our understanding of nuclear burning fronts, current 3-D models are not sufficiently evolved to allow for a consistent treatment of the burning front throughout all phases (Khokhlov, 2001, see also §4.3 & §5). Thus detailed models rely on parameterized descriptions guided by 3-D results. Within spherical models, the transition from deflagration to detonation can be conveniently parameterized by a density which has been found to be the dominating factor for the determining chemical structure, light curves and spectra.
We have calculated explosion models using a one-dimensional radiation-hydro code (HK96) that solves the hydrodynamical equations explicitly by the piecewise parabolic method (Collela & Woodward, 1984). Nuclear burning is taken into account using an extended network of 606 isotopes from n,p to (Thielemann, Nomoto, & Hashimoto, 1996, and references therein). The propagation of the nuclear burning front is given by the velocity of sound behind the burning front in the case of a detonation wave, and in a parameterized form during the deflagration phase calibrated by detailed 3-D calculations (e.g. Khokhlov, 2001). We use the parameterization as described in Domínguez & Höflich (2000). For a deflagration front at distance from the center, we assume that the burning velocity is given by , where and are the laminar and turbulent velocities with
with
and
Here is the Atwood number, is the characteristic length scale, and and are the densities in front of and behind the burning front, respectively. The quantities and are directly taken from the hydrodynamical model at the location of the burning front and we take . The transition density is treated as a free parameter.
3.1.2 The Light Curves
From these explosion models, the subsequent expansion, bolometric and broad band light curves (LC) are calculated following the method described by Höflich, Wheeler, & Thielemann (1998), and references therein. The LC-code is the same used for the explosion except that -ray transport is included via a Monte Carlo scheme and nuclear burning is neglected. In order to allow a more consistent treatment of the expansion, we solve the time-dependent, frequency-averaged radiation moment equations. The frequency-averaged variable Eddington factors and mean opacities are calculated by solving the frequency-dependent transport equations. About one thousand frequencies (in one hundred frequency groups) and about nine hundred depth points are used. At each time step, we use T(r) to determine the Eddington factors and mean opacities by solving the frequency-dependent radiation transport equation in a co-moving frame and integrate to obtain the frequency-averaged quantities. The averaged opacities have been calculated assuming local thermodynamic equilibrium (LTE). Both the monochromatic and mean opacities are calculated in the narrow line limit. Scattering, photon redistribution, and thermalization terms used in the light curve opacity calculations are taken into account.
In previous works (e.g. Höflich & Khokhlov (1996)), the photon redistribution and thermalization terms have been calibrated for a sample of spectra using the formalism of the equivalent two level approach (H95). For increased consistency, we use the same equations and atomic models but solve the rate equations simultaneously with the light curves calculation at about every 100th time step, at the expense of some simplifications in the NLTE-part compared to H95. For the opacities we use the narrow line limit, and for the radiation fields we use the solution of the monochromatic radiation transport using frequency groups.
3.1.3 Spectral Calculations
Our non-LTE code (H95, and references therein) solves the relativistic radiation transport equations in a co-moving frame. The spectra are computed for various epochs using the chemical, density, and luminosity structure and -ray deposition resulting from the light curve coder. This provides a tight coupling between the explosion model and the radiative transfer. The effects of instantaneous energy deposition by -rays, the stored energy (in the thermal bath and in ionization) and the energy loss due to the adiabatic expansion are taken into account. Bound-bound, bound-free and free-free opacities are included in the radiation transport which has been discretized by about frequencies and 97 radial points.
The radiation transport equations are solved consistently with the statistical equations and ionization due to -radiation for the most important elements and ions. Typically, between 27 to 137 bound levels are taken into account. We use C I (27/123/242), O I (43/129/431), Mg II (20/60/153), Si II (35/212/506), Ca II (41/195/742), Ti II (62/75/592), Fe II (137/3120/7293), Co II (84/1355/5396), Ni II (71/865/3064) where the first, second and third numbers in brackets denote the number of levels, bound-bound transitions, and number of discrete lines for the radiation transport. The latter number is larger because nearby levels within multiplets have been merged for the rates.
The neighboring ionization stages have been approximated by simplified atomic models restricted to a few NLTE levels + LTE levels. The energy levels and cross sections of bound-bound transitions are taken from Kurucz (1993) starting at the ground state. The bound-free cross sections are taken from TOPBASE 0.5 as implemented in Straßburg (Mendoza & Cunto, 1993). Collisional transitions are treated in the ‘classical’ hydrogen-like approximation (Mihalas, 1978) that relates the radiative to the collisional gf-values. All form factors are set to 1.
About 106 additional lines are included (out of a line list of ) assuming LTE-level populations. The scattering, photon redistribution, and thermalization terms are computed with an equivalent-two-level formalism that is calibrated using NLTE models.
3.2 Modeling Results
Spherical dynamical explosions, light curves, and spectra are calculated for both normal bright and subluminous SNe Ia. Due to the one-dimensional nature of the models, the moment of the transition to a detonation is a free parameter. The moment of deflagration-to-detonation transition (DDT) is conveniently parameterized by introducing the transition density, , at which DDT happens.
Within the DD scenario, the free model parameters are: 1) The chemical structure of the exploding WD, 2) Its central density at the time of the explosion, 3) The description of the deflagration front, and 4) The density at which the transition from deflagration to detonation occurs. Note that the density structure of a WD only weakly depends on the temperature because it is highly degenerate. The central density depends mainly on the history of accretion. Model parameters have been chosen for the progenitor and which allow us to reproduce light curves and spectra of ‘typical’ Type Ia supernovae.
In all models, the structure of the exploding C/O white dwarf is based on a model star with 5 M☉ at the main sequence and solar metallicity. Through accretion, this core has been grown close to the Chandrasekhar limit (see Model 5p0y23z22 in Domínguez, Höflich, & Straniero 2001). At the time of the explosion of the WD, its central density is 2.0 g cm-3 and its mass is close to 1.37. The transition density has been identified as the main factor which determines the production and, thus the brightness of a SNe Ia (H95; Höflich, Khokhlov, & Wheeler 1995; Iwamoto et al. 1999). The transition density from deflagration to detonation is varied between 8 and 27 g cm-3 to span the entire range of brightness in SNe Ia. The models are identified by 5p0z22.ext where ext is the value of in g cm-3. Some of the basic quantities are given in Table 2.
3.2.1 Explosion Models
Here we will restrict our discussion to the basic features of DD models which are relevant for the spectral analysis of SN 1999by. For a more detailed discussion of the hydrodynamical evolution of DD-models, see Khokhlov (1991), H95, and references therein.
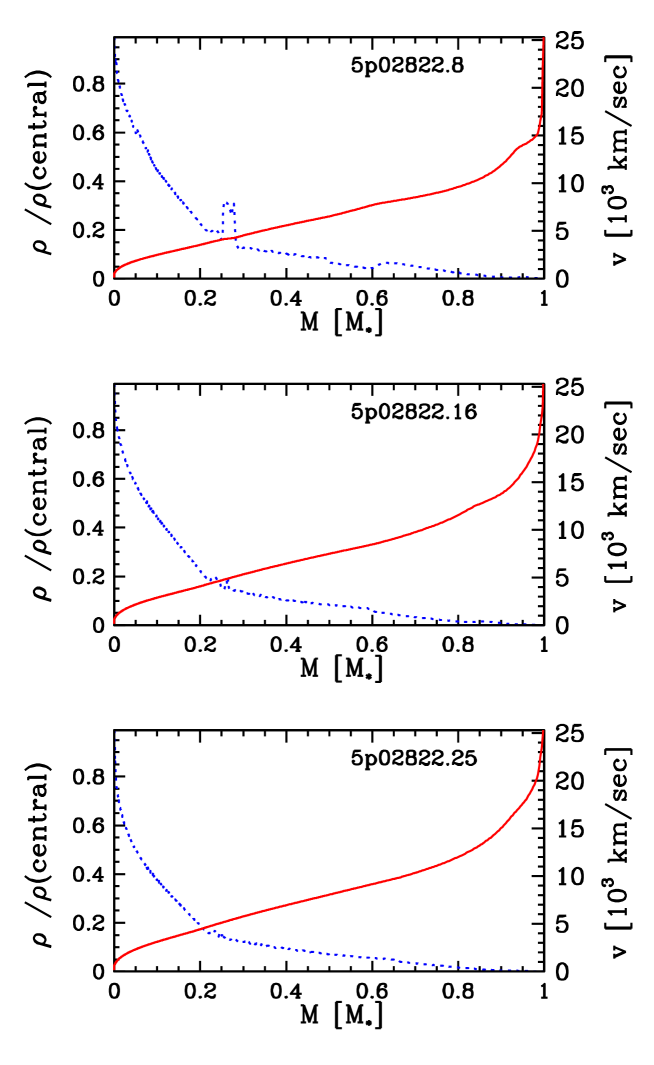
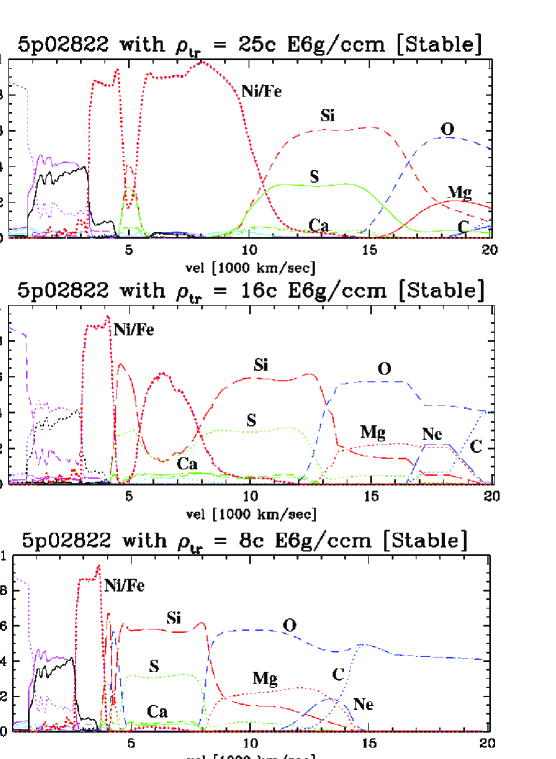
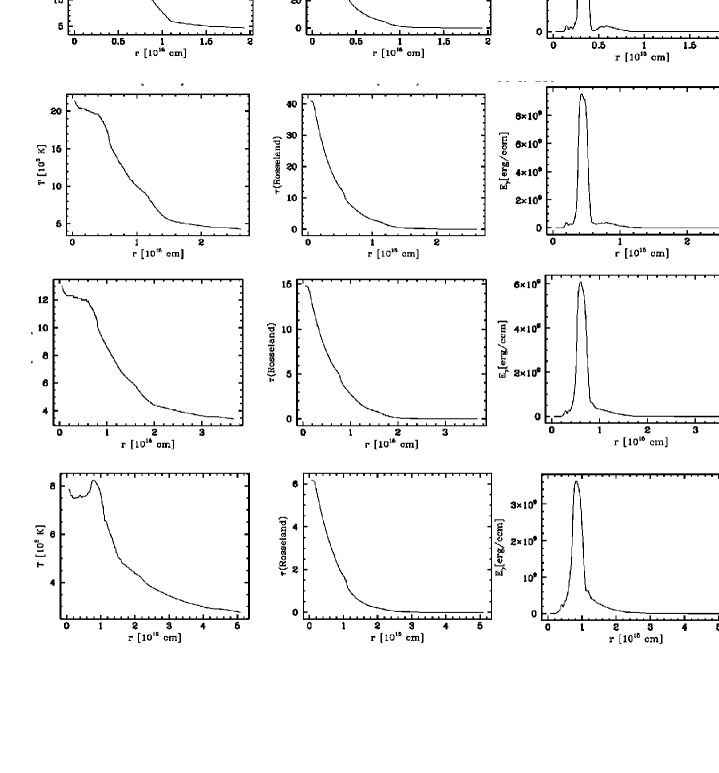
During the deflagration phase, the WD is lifted, starts to expand, and after burning about 0.22 to 0.28 , the transition to a detonation is triggered. Figures 2 and 3 show the density, velocity and chemical structures for representative models after a homologous expansion has been achieved. The final velocity and density structures are rather similar. The expansion velocities decrease slightly with because a significant amount of oxygen remains unburned and did not contribute to the energy production. In 5p0z22.8, oxygen remained unburned in the outer . Overall, the density is decreasing with radius because burning took place throughout the entire WD except in the very outer layers. In contrast, pure deflagration model such as W7 (Nomoto, Thielemann, & Yokoi, 1984), pulsating delayed detonation (Höflich, Khokhlov, & Wheeler, 1995), and merger models (Khokhlov, Müller, & Höflich, 1993) show a significant density bump at the boundary between burned and unburned layers.
Iron group elements are produced in the inner layers where density and temperature stay high for a sufficient time during the explosion, whereas intermediate mass elements are produced in the layers above where nuclear statistical equilibrium (NSE) has no time to set in. In the outer zones, products of explosive oxygen (e.g. Si, S) and explosive carbon burning (O, Mg, Ne) and some Si are seen. Only a very thin layer of unburned C/O remains.
For layers with final velocities km s-1, the densities in the early stages of the explosion are sufficiently high for electron capture. This results in the production of 54,56Fe & 58Ni whereas in the outer layers only 56Ni is produced. We employ the same description for the deflagration front in all models and, consequently, the very inner structures are almost identical in all models. A small dip in the Ni abundance is present at the DDT because the time scales for burning to NSE are comparable to the expansion time scales at densities of g cm-3. This feature can be expected to be smeared out in multi-dimensional calculations (Livne, 1999).
After the DDT, a detonation front develops and the burning of fuel is triggered by compression of unburned material. Consequently, burning takes place under higher densities compared to a deflagration. In general, additional material is burned up to NSE and this extends the layers of 56Ni for all g cm-3. For models with smaller , burning only proceeds up to Si despite the compression. This increases the production of intermediate mass elements (e.g. Si, S) at the expense of 56Ni. In our models, the efficiency for 56Ni production drops rapidly as a function of decreasing (see Table 2). We note that for g cm-3, nuclear burning stops all together for and, unlike any observed SN, one would see a very slowly expanding C/O envelope heated by little 56Ni.
There exists a rather strict lower limit for the absolute brightness of SNe Ia within the Chandrasekhar mass models. This can be understood as follows. The absolute brightness of a SNe Ia is mainly determined by the . In general, is produced both during the deflagration and the detonation phase. For the most subluminous SNe Ia however, no is produced during the detonation. Within the scenario and DD-models in particular, we need to burn a minimum of during the deflagration to achieve the required ‘lift/pre-expansion’ of the WD. During the deflagration phase, iron group elements are produced. The fraction of depends on the amount of material which undergoes electron capture, i.e. on the central density and, to a smaller extent, on the description of the burning front (Brachwitz 2001; Domínguez, Höflich, & Straniero 2001). For a model with g cm-3, we find a lower limit of . Recently, Brachwitz (2001) studied the influence of between 1.5 to g cm-3 on the nuclear burning for similar DD-models with a high transition density which may describe ‘normal’ SN Ia. In those models, the produced during the deflagration phase varies by which provides an estimate for the possible variation in the minimum production. We conclude that there exists a lower limit of within DD-models.
In principle, 3-D effects may change the lower limit for the production. However, all current 3-D calculations show that rising blobs are formed at high densities which undergo complete Si-burning because the burning time scales to Ni shorter than the hydro time scales. In the case of a DDT or a transition to a phase of very fast deflagration, the amount of burning will likely be similar to the 1-D case. Thus, we do not expect a significant change in the minimum production.
3.2.2 General properties of theoretical light curves
Optical light curves and spectra of SN Ia are not the subject of this paper but we used their general properties for selecting a model for SN1999by.
Within the DD scenario, both normal and subluminous SNe Ia can be produced (H95, Höflich, Khokhlov, & Wheeler 1995, HKW95 hereafter; Umeda et al. 1999). The amount of 56Ni () depends primarily on (H95; HKW95; Umeda et al. 1999) and to a much lesser extent on the assumed value of the deflagration speed, initial central density of the WD, and initial chemical composition (ratio of carbon to oxygen). Models with smaller transition density give less nickel and hence both lower peak luminosity and lower temperatures (HKW95, Umeda et al. 1999). In DDs, almost the entire WD is burned and the total production of nuclear energy is almost constant. This and the dominance of for determining the production are the basis of why, to first approximation, SNe Ia appear to be a one-parameter family.
The observed relation can be understood as an opacity effect (Höflich et al., 1996b), namely, the consequence of rapidly dropping opacities at low temperatures (Höflich, Müller, & Khokhlov, 1993; Khokhlov, Müller, & Höflich, 1993; Mazzali et al., 2001). Less Ni means lower temperature and consequently, reduced mean opacities because the emissivity is shifted from the UV toward longer wavelengths with less line blocking. A more rapidly decreasing photosphere causes a faster release of the stored energy and, as a consequence, steeper declining LCs with decreasing brightness. The DD models give a natural and physically well-motivated origin of the relation of SNe Ia (Hamuy et al. 1995, 1996b; Phillips et al. 1987; Suntzeff et al. 1999).
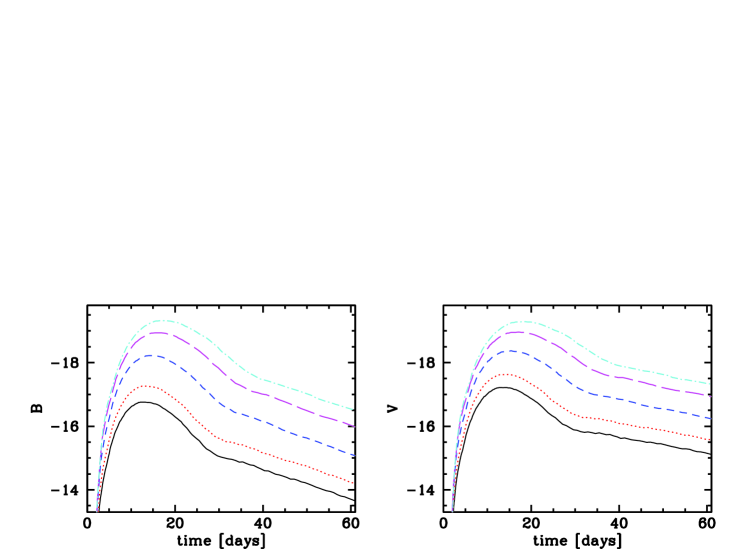
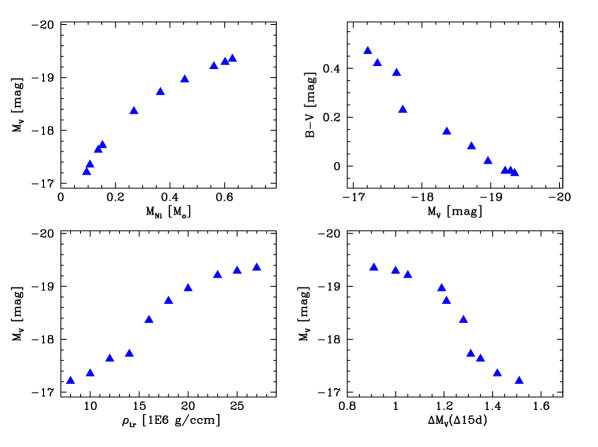
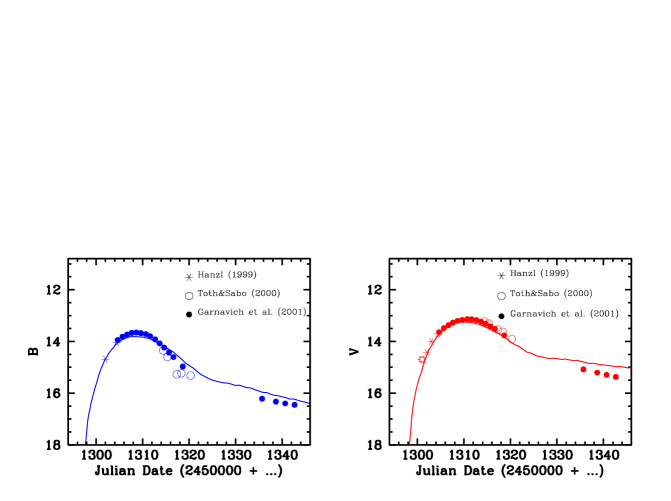
The broad band B and V light curves are shown in Figure 4. Some general properties are given in Table 2 and Figure 5. We note that the decline of the B and V LC during the early tail is slightly smaller for the most subluminous models (e.g. 5p0z22.08) compared to the intermediate models (e.g. 5p0z22.16) because, at day 40, the -rays are almost fully trapped in the former whereas, for the latter, the escape probability of -rays is already increasing (HKW95). With varying , we find rise times between 13.9 to 19.0 days, and the maximum brightness spans a range and with between to . The value of is primarily determined by the transition density. Variations in the progenitors (main sequence mass and metallicity) or the central density at the point of ignition causes an spread around of (Höflich, Wheeler, & Thielemann, 1998; Domínguez, Höflich, & Straniero, 2001). As discussed above, the brightness decline relation can be understood as an opacity effect or, more precisely, it is due to the drop of the opacity at low temperatures. Therefore, subluminous models are redder and the decline is steeper. In our series of models, ranges between and . However, is not a strictly linear relation (Fig. 5). For bright SNe Ia (), called Branch-normals ((Branch, Romanishin, & Baron, 1996; Branch, 1999)), the linear decline is relatively flat, followed by a steeper decline toward the subluminous models. For normal-luminosity models, the photospheric temperature is well above the critical value at which the opacity drops (; Höflich, Müller, & Khokhlov 1993) whereas the opacity drops rapidly in subluminous models soon after maximum light.
4 Analysis of SN1999by
4.1 Selection of the SN1999by Model
Detailed B and V light curves of SN 1999by have been collected and published by Toth & Szabo (2000) and optical spectra around maximum light are available from observations at McDonald Observatory (Howell et al., 2001). Recently, SN 1999by spectra and LCs have been provided by Garnavich et al. (2001). Within our series of models, we selected the most suitable model based on the optical photometry. Unfortunately, there is a gap in the observed data starting about one week after maximum light, a phase which is most suitable for selecting the appropriate models. Thus, as the main discriminator, we use the complete LCs as reconstructed by Toth & Szabo (2000).
SN 1999by showed a decline rate between and (Toth & Szabo 2000) clearly ruling out all but the most subluminous models with transition densities of and g cm-3 and maximum brightness of and , respectively (Table 2). Both models are consistent with the early light curves given in Toth & Szabo (2000) i and Garnavich et al. (2001) (Fig.8). From the models and the early LC, the time of the explosion can be placed around April 27 1 d, 1999. The model post-maximum LC in B is less reliable because it depends very sensitively on the size and time evolution of line blanketing and the thermalization. is and for 5p0z22.10 and 5p0z22.8, respectively. This compares reasonably well with observed for SN1999by (Howell et al., 2001). In the LCs (Fig. 8), discrepancies of about show up after the time gap in the observations. At these times, the envelope of a subluminous SN Ia becomes transparent, and strong emission features emerge (see below). Thus these discrepancies are likely a consequence of discretization errors due to the use use of only 1000 frequency for the LC calculations.
According to Bonanos et al. (1999), near maximum light on May 10, 1999. Garnavich et al. (2001) give . We find and for 5p0z22.8 and 5p0z22.10, respectively. In previous studies, we find intrinsic uncertainties in B-V to be for our models at maximum light (Höflich, 1995). Thus, the interstellar reddening can be expected to be consistent with the values for our galaxy given by Burstein & Heiles (1982) and Schlegel et al. (1998) and the estimates for the total extinction derived by Toth & Szabo (2000). For our models, if we assume , we then derive a distance modulus of ( to 0.35m). The first and second error-terms originate from the observational uncertainties plus the brightness range of the models and the reddening correction, respectively. ¿From our models, we can derive a distance to NGC 2841 of Mpc and Mpc if we include and neglect interstellar reddening, respectively. Both from observations (Schlegel et al., 1998) and our models, very small reddening is preferred. Following Schlegel et al. (1998), we adopt for all comparisons with the observations.
Based on the density, temperature and chemical structure predicted from the explosion model, transport and light curve calculations, we have constructed detailed NLTE-spectra for 11 d, 15 d, 22 d and 29 d after the explosion (days , 0, +7 and +14 after maximum light). For the subluminous model with the transition density g cm-3 (Fig. 2), the evolution of the temperature, energy deposition by -rays, and Rosseland optical depth is given as a function of radius (Fig. 6). Obviously, the total optical depth drops rapidly with time from 98, 40, 15 to 6 due to the cooling; much faster than quadratic as would be expected from the geometric dilution alone (98, 52, 25 and 12), and thus more rapidly than in normal-bright SNe Ia (Höflich, Khokhlov, & Wheeler, 1993; Khokhlov, Müller, & Höflich, 1993)). As mentioned above, the reason is the rapid drop in the mean opacity for which causes the outer layers to become almost transparent. Consequently, the photosphere recedes quickly in mass and even starts to shrink in radius just a few days after the explosion. The corresponding expansion velocities at the photosphere are approximately 14000, 10500, 6500 and 4000 km s-1 at the four epochs computed.
The low photospheric temperatures are due to the small amount of and its low expansion velocity which also causes the local trapping of -rays (Fig. 6). In contrast to normal SNe Ia, most of the decay energy is deposited well below the photosphere up to about 2 weeks after maximum light. This explains, in part, the low ionization stages seen in the IR-spectra (see below).
The location (and thus the velocity) of the photosphere determines which layers in the supernova envelope will form the spectral features. Before maximum light, the spectra sample the layers of explosive carbon burning which are O, Mg, Ne and Si-rich (Fig. 3). Up to 2 weeks after maximum light, spectra are formed within layers of incomplete silicon burning which are Si, S and Ca-rich. Only thereafter are the layers which are dominated by iron group elements finally exposed. This is very different from models for normal luminosity SNe Ia for which the iron rich layers are already exposed near maximum light. These profound differences are key for our understanding of the optical and IR spectra of subluminous SNe Ia and the differences compared to normal SNe Ia.
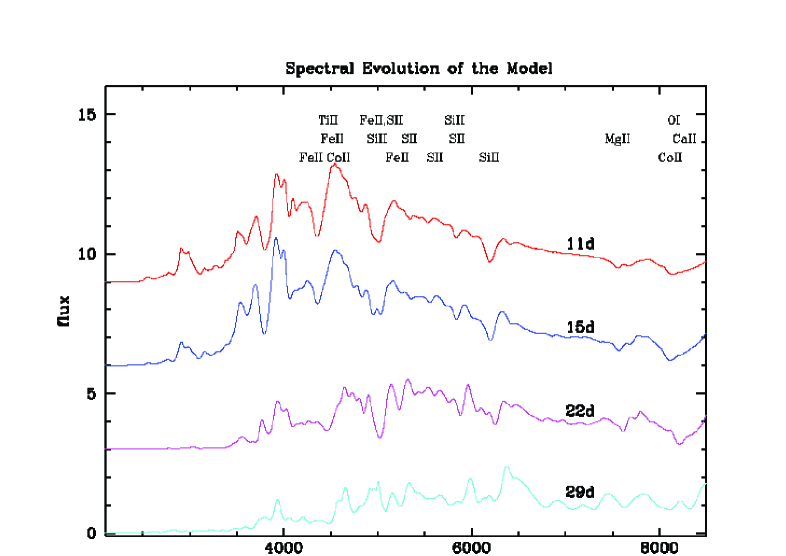
Optical spectra are not the main subject of this paper, and detailed spectra have not been available for this analysis except for maximum light (Fig. 9, Howell et al. 2001). However, for completeness, the time sequence of optical spectra is given in Figure 7. Overall, the spectra show an evolution typical for SN Ia, (e.g. SN 1994D, H95). They can be understood as a consequence of the declining temperature and total optical depth with time, and the rapidly dropping temperature. The Doppler shift of the absorption component decreases rapidly because of the receding photosphere. For subluminous models, the entire envelope becomes almost transparent and the spectra start to enter the nebular phase at about two weeks after explosion. This marks the end of the applicability of our atomic models. Some features (see Fig. 9) are typical of subluminous SNe Ia and are a consequence of the low luminosity and photospheric temperature around maximum light. The Si II line at 5800 Å is strong relative to the line at 6150 Å, and the flux near 4000 Å was depressed as in other subluminous SNe, and features due to Ti II were strong as was the O I line at 7500 Å (Garnavich, Jha, & Kirshner, 1999). As already suggested by Nugent et al. (1997), the strong Ti II absorption and the relative strength of the Si lines can be understood as a temperature effect. Within DD models with progenitors, the strong O I line is a direct consequence of the fact that the spectra at maximum light are formed in massive layers of explosive carbon burning.
While the structures and synthetic spectra of the models 5p0z22.8 and 5p0z22.10 are very similar, 5p0z22.8 is slightly preferred from a consideration of the expansion velocities at the photosphere which are 10500 and 11500 km s-1, respectively. Therefore, we will will adopt 5p0z22.8 in the following. Based on parameterized LTE model atmospheres (SYNOW, Fisher et al. 1999), a detailed analysis of the Doppler shifts of lines has been provided by Garnavich et al. (2001). They found Si II in the entire range between 11,300 down to 6500 km s-1 which is consistent with our hydrodynamical models (see Fig. 6).
4.2 Analysis of the IR-spectra of SN 1999by
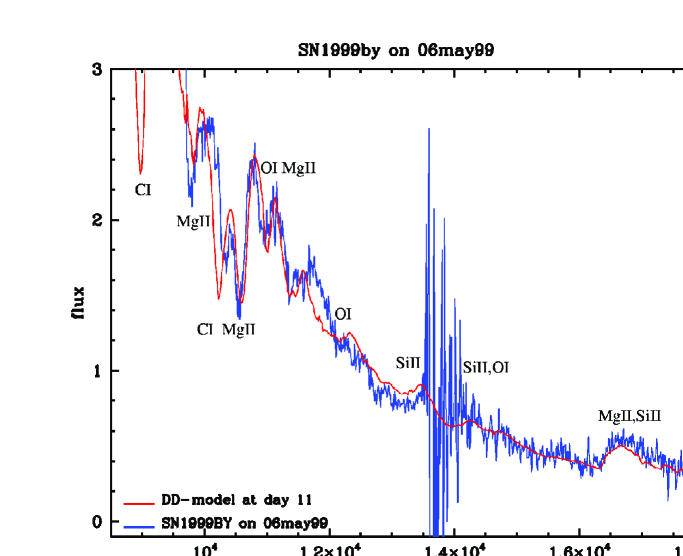
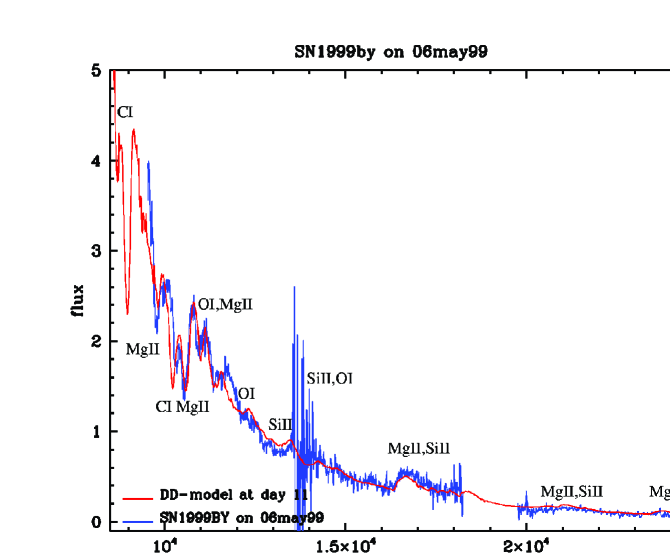
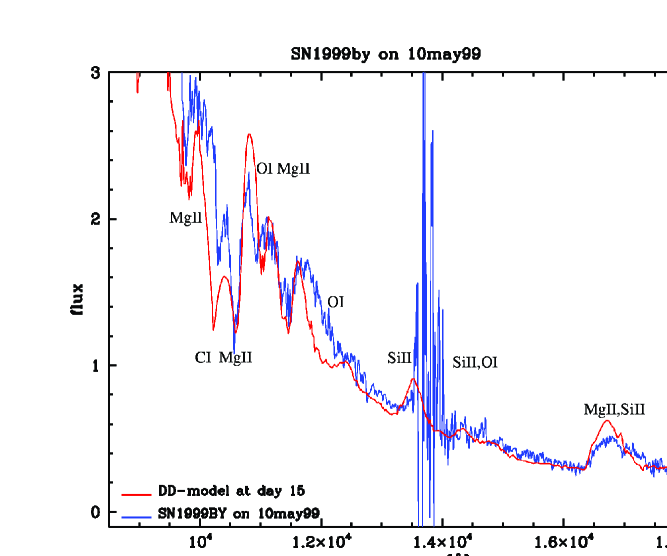
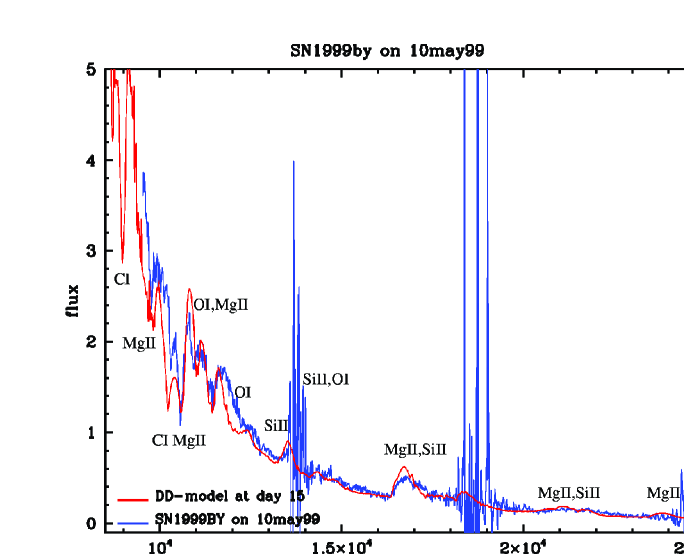
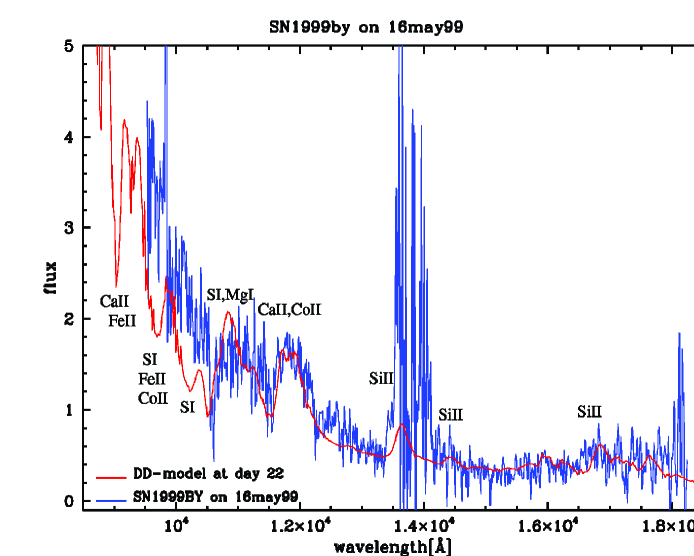
Near IR-spectra (0.9 to 2.5 m) of 5p0z22.8 at day 11, 15, 22 and 29 after explosion are compared to those of SN1999by at May 6, 10, 16, and 24 (Figs. refir.may6–13). The spectra are characterized by overlapping P-Cygni and absorption lines, and emission features. Unless noted otherwise, the observed wavelengths quoted the emission component. The overall energy distribution in the continuum is determined by bound-free and Thomson opacities and the temperature evolution. In general, the spectra and their time evolution agree reasonably well with the model predictions and all the major features can be identified.
Few detailed analyses and line identifications of IR spectra have been performed (Meikle et al., 1996; Bowers et al., 1997; Höflich, 1997; Wheeler et al., 1998; Hernandez et al., 2000) and these were limited to spectra of SN 1994D, SN 1998bu and post-maximum spectra of SN1986G. To put our analysis given below in context with normal-luminosity SNe Ia, we will refer to those works as reference points.
4.2.1 Early time IR-spectra
The observed NIR spectra from May 6 and 10 (Figs. 10 & 11) are quite similar, and comparison with the model spectra show that both of these spectra are formed in layers of explosive carbon burning. Spectral features can be attributed to C I, O I, Mg II and Si II. Typically, several thousand overlapping lines contribute to the overall opacity but few strong features leave their mark on the spectrum.
Some weak features at about 2.1 and 2.38 µm are due to Mg II (21369, 21432, 24041, 24044, 24125 Å) and Si II (21920, 21990 Å). The strong, broad feature between 1.62 and 1.75 µm is a blend produced by Mg II lines (16760, 16799, 174119, 17717 Å) and Si II (16907, 16977, 17183, 17184 Å). Its blue edge is determined by Mg II. A similar feature is also present in normal luminosity SNe Ia but Mg II does not contribute because the corresponding spectra are formed in layers of explosive oxygen burning.
The strong feature that peaks near 1.35 µm is due to Si II (13650 Å), and weaker features with peaks near 1.23 µm and 1.43 µm are a Si II multiplet (13692 to 13696 Å) and a blend of O I (14542Å) and Si II (14454 Å), respectively. A very weak feature in the synthetic spectrum near 1.23µm can be attributed to O I (13164 Å), but is well below the noise level of the observed spectra.
Features with P-Cygni absorption minima at 1.12, 1.06, 1.03 and 1.0 µm are produced by Mg II (11620, 11600 Å), O I (11302, 11286 Å), Mg II (10914, 10915 & 10950 Å), C I (10683 & 10691 Å), and Mg II (10092 Å), respectively. The multiplet of Mg II 1.09 µm is also prominent in normal luminosity SNe Ia but the other features are weak and blended with Fe II, Co II and Ni II.
The observed spectra go down to about 9700 Å. However, there are some interesting features at shorter wavelengths which are worth mentioning. Foremost, the model predicts a very strong feature at about 9100 Å due to C I (9405 Å). Its velocity provides an important constraint on the minimum velocity for the unburned region, and possible mixing. Other features are produced by Mg II (9344 Å), Ca II (IR-triplet), and O I (8446 Å) and Mg II (8246 Å).
Despite the overall agreement, some discrepancies remain. First, the C I line at 10691Å is somewhat too strong, and its Doppler shift on May 6 is too large by about 1500 km s-1. This feature is formed well above the photosphere (13000 km s-1). This might indicate that SN 1999by has a slightly lower temperature in the outer layers compared to the model, which would cause less excitation of carbon and, might cut off the high velocity contribution to the absorption. Secondly, in the model spectrum there seems to be a lack of emission produced by Si II near 1.18 µm. We note that similar problems with Si are also commonly present in the optical Si II line at about 6380 Å for normal SNe Ia (Höflich, 1995; Lentz et al., 2000). They may be related to the excitation process of Si but their origin is not well understood.
4.2.2 IR-spectra after maximum light
The spectrum from May 16 (Fig. 12) is formed in layers of explosive oxygen burning. The lines can be attributed to Mg I, Ca II, Si II and S I. All features due to Ca II and Si II seen in the pre-maximum spectra can still be identified. No lines due to O I and C I are present, but strong lines of Ca II and S I appear. Strong features at about 1.14 µm and 1.1 µm are due to Ca II lines (11784, 11839 & 11849 Å) and S I (10821 Å) & Mg I (11800 Å), and the broad feature at 0.91 µm (not covered in this spectrum, but included for completeness) is a blend of Ca II (9890 Å) and Mg II (10009Å). Weaker lines (Fe II, 9997Å; S I, 10455 Å) contribute to blends around 1.03 µm.
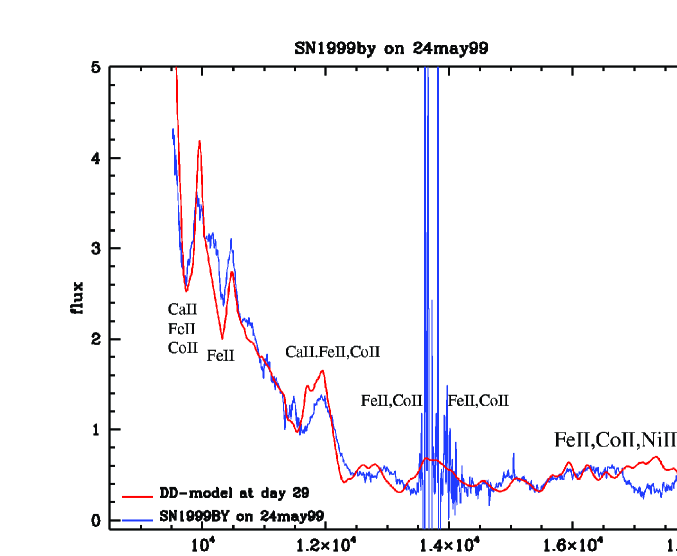
Some weak lines due to Co II and Fe II lines occur throughout the spectrum but the most characteristic feature in post maximum IR-spectra of normal SNe Ia is missing. Starting a few days after maximum, normal SNe Ia show a wide emission feature between 1.5 and 1.8 µm produced by thousands of Fe II, Co II & Ni II lines. Typically, their emission flux is about twice as large as the adjoining continuum. This feature marks the lower velocity end of the region of complete silicon burning, and it seems to be common in all normal luminosity SNe Ia such as SN 1986G, SN 2000br and SN 2000cx (Wheeler et al. 1998; Marion 2001, priv. comm.; Rudy et al. 2001). In 5p0z22.8, this broad emission feature is not seen because the photosphere has yet to recede to the layers of complete silicon burning. On May 24th (Fig. 13) this feature finally appears but is very weak. Overall, two weeks after maximum light, the spectrum in dominated by a large number of Fe II and Co II lines. Strong features of Fe II are around 9600 Å 1.2 m and 1.4 m with strong Co II lines from 9500 to 12443 Å, and 14000Å – 16700 Å.
In our synthetic spectrum the Fe II, Co II & Ni II feature 1.6 to 1.8 m does not show a local minimum at as observed in SN1999by, and as also predicted by normal bright models for SN1986G (Höflich, 1997; Wheeler et al., 1998). In our subluminous model, the emission near 1.7 µm comes from the central Ni-rich region. The absence of such emission in the observed spectrum may indicate that the very central region () of the model is too transparent compared SN1999by. This discrepancy is not critical for measuring the chemical structure of the envelope because this is determined by the blue edge. The difference in opacity may be caused by missing iron lines in the line list (§3.1.3), or an underestimation of the excitation by non-thermal electrons because we assume local deposition for the electrons from the decay of .
4.3 Mixing processes
As we have seen, model 5p0z22.8 reproduces the basic features of both optical and IR spectra, including the time evolution. This suggests that DD models are a reasonably good description for subluminous SNe Ia.
Unfortunately, we are still missing a handle on an important piece of physics. The propagation of a detonation front is well understood but the description of the deflagration front and the deflagration to detonation transition (DDT) pose problems. Currently, state of the art allows us to follow the front only through the phase of linear instabilities, i.e. only the early part of the deflagration phase. The resulting structures of these calculations cannot account for the observations of typical SNe Ia (Khokhlov 2001), because a significant fraction of the WD () remains unburned.
Nevertheless, these calculations point toward a more general problem, or toward a better understanding of the nature of subluminous SNe Ia. On a microscopic scale, a deflagration propagates due to heat conduction by electrons. Though the laminar flame speed in SNe Ia is well known, the front has been found to be Rayleigh-Taylor (RT) unstable, increasing the effective speed of the burning front (Nomoto, Sugimoto, & Neo, 1976). More recently, significant progress has been made toward a better understanding of the physics of flames. Starting from static WDs, hydrodynamic calculations of the deflagration fronts have been performed in 2-D (Niemeyer & Hillebrandt, 1995; Lisewski et al., 2000), and full 3-D (Khokhlov, 1995, 2001).
The calculations by Khokhlov (2001) demonstrated a complicated morphology for the burning front. Plumes of burned material will fill a significant fraction of the WD, and unburned or partially-burned material can be seen near the center. Thus iron-rich elements will not be confined to the central region as in 1-D models. Khokhlov (2001) finds that while the expansion of the envelope becomes almost spherical, the inhomogeneous chemical structure will fill about 50 to 70% of the star (in mass). If a DDT occurs at densities needed to reproduce normal-bright SNe Ia, most of the unburned fuel in these regions will be burned to iron-group elements during the detonation phase. This will eliminate the chemical inhomogeneities. However, in our subluminous model, the chemical structure imposed during the deflagration phase must be expected to survive because no or very little is produced during the detonation.
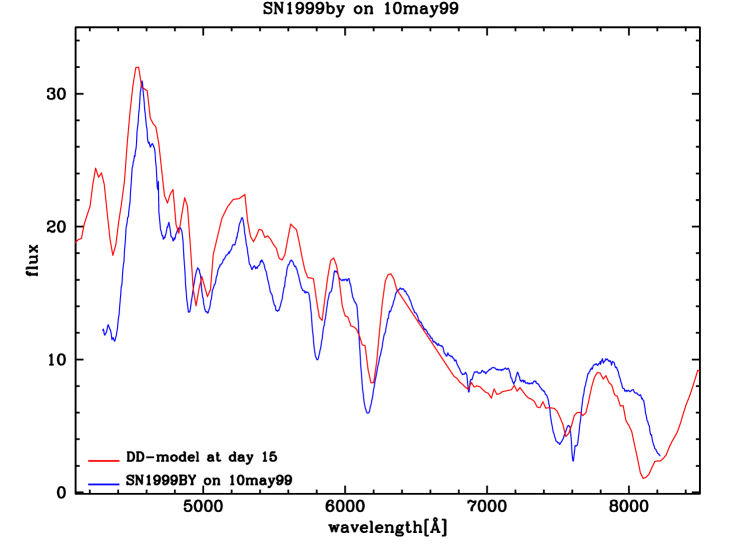
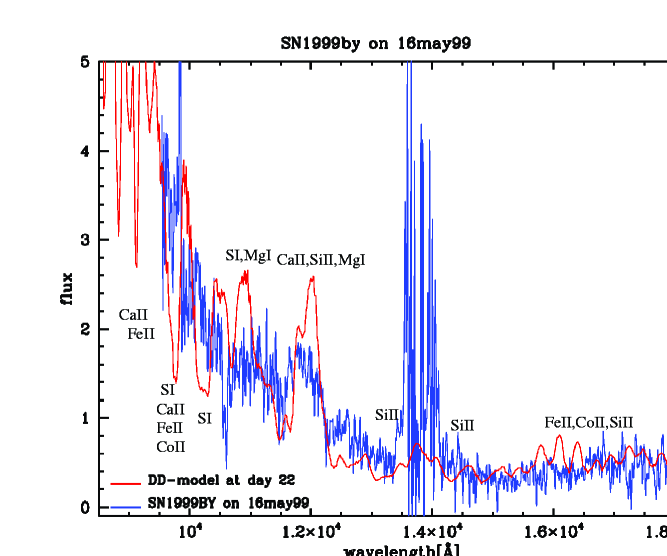
In order to test for this effect, we have mixed the inner layers of model 5p0z22.8 up to an expansion velocity of 8000 km s-1. This brings iron-group elements into the outer regions and mixes intermediate mass elements (Si, S, Ca and some O) into the inner, hotter layers. The layers with expansion velocities less than 8000 km s-1 become visible a few days after maximum light (see above). In Figure 14, a comparison is shown between the spectrum of SN1999by on May 16th, 1999, and the synthetic spectrum about one week after maximum light, and problems with the spectral fit are apparent. As can be expected from the discussion above, the effective extension of the iron-rich layers to 8000 km s-1 causes the 1.5 to 1.8 µm blend to become rather strong, and line blanketing due to iron-group elements (Fe II & Co II) become too strong in the region around 1 to 1.2 µm. Moreover, at about 0.99, 1.02, 1.05 & 1.16 µm, (absorption components) strong blends can be seen due to O I (11302, 11287 & 11297Å), Si II (11715, 11745, 13650 & 13650 Å), Ca II (9890, 9931, 9997, 11839 & 11745 Å) and S I (10455 & 108212 Å).
We have to take into account that our approach assumes microscopic mixing whereas RT instabilities provide large scale inhomogeneities. If and the intermediate mass elements are separated, direct excitation of intermediate mass elements may be reduced. With respect to the radiation transport, the main difference is the covering factor. This will effect line blanketing and thus the line blanketing between 1 to 1.2 m may not pose a problem. However, the emission features between 1.5 to 1.8 m will not go away. The reduced excitation by non-thermal electrons and ’s in case of macroscopic mixing are important at low optical depths. Less excitation may reduce the problem with the O, Si, S & Ca lines but the problem will no disappear because the corresponding features are formed close to the photosphere where the excitation is thermal in nature.
These problems strongly suggest that large scale mixing did not occur in SN 1999by. This may provide a key for our understanding of the nature of these objects.
5 Implications for the SN Ia progenitors, and alternative scenarios
As previously discussed, the pre-conditioning of the WD before the explosion may provide a key for understanding the nature of subluminous SNe Ia. Such pre-conditioning may include the main sequence mass of the progenitor mass and its metallicity (Domínguez, Höflich, & Straniero, 2001; Höflich, Wheeler, & Thielemann, 1998; Iwamoto et al., 1999), the accretion history (Langer et al., 2000), or large-scale velocity fields such as turbulence prior to the runaway (Höflich & Stein 2001). Up to now, none of these effects have been included in detailed 3-D calculations. Therefore, the suggestions (below) require further investigation before taken as explanation.
Beyond its subluminous nature, SN 1999by showed another peculiarity with respect to normal-bright SNe Ia. The observed polarization of SN 1999by was rather high () with a well-defined axis of symmetry, whereas normal SNe Ia show little or no polarization (; Wang, Howell, Wheeler, & Höflich 1997). ¿From a detailed analysis of the polarization spectra, Howell et al. (2001) concluded that the overall geometry of SN 1999by showed a large scale, probably rotational asymmetry of about 20%. The authors suggested several explanations. Either, SN 1999by may be the result of the explosion of a rapidly rotating WD close to the break-up, or a result of a merger scenario. In a rapidly rotating WD, large-scale circulations (Erigichi & Müller, 1985) might influence the deflagration phase of explosive burning, perhaps by breaking up large eddies and preventing their rise.
Alternatively, it should be remembered that the chemical structure of the exploding WD depends on the pre-expansion of the WD prior to the detonation phase. More precisely, we need to burn about to lift the WD in its gravitational potential. This mass is significantly more than is burned during the smoldering phase (the phase of slow convective burning just prior to the explosion). Even in the presence of strong turbulence, the amount of burned material is much less (, Höflich & Stein 2001). In all models for the ignition (e.g. Nomoto 1982; Garcia-Senz & Woosley, 1995), the central temperature rises by non-explosive carbon burning during the last few minutes to hours before the runaway because the heat cannot be dispersed. It may be feasible that large scale velocity fields due to rotation may extend this phase, and significantly increase the amount of burning prior to the explosion. Thus, the pre-expansion in subluminous SNe Ia may occur directly during the smoldering phase, and the deflagration phase may be even skipped, i.e. a detonation occurs promptly, and we may have a smoldering detonation model (SD). In SD-models, no is produced during the phase of pre-expansion and, consequently, this mechanism does not predict a lower limit for and, thus, . In principle, SD-models may be an attractive alternative also for normal-bright SNe because they omit the need for a DDT but, from the present understanding of the runaway, in general, extensive burning prior to the runaway cannot be expected (see above). From the point of the spectral analysis, this option is intriguing because burning during the smoldering phase precedes only to O and the time scales of burning are sufficient to completely homogenize the chemical structure of the WD.
Finally, there is the question of alternative scenarios for SNe Ia in the context of subluminous SNe Ia. Pure deflagrations of -WDs without any DDT may produce little but, according to current simulations, a large fraction of the WD would remain unburned. Even if this problem were solved in the future, the problem of inhomogeneous chemistry and Si-rich layers close to the center would remain. Helium triggered detonations of sub-Chandrasekhar mass WDs have been suggested in the past. However, their distinct feature is an outer layer of above a low mass layer of explosive oxygen burning, a layer of incomplete Si burning, and some close to the center. This chemical structure is in strong contradiction to the optical spectra and LCs of SN 1999by, and their evolution with time.
Alternatively, setting aside the problem of triggering the explosion, central detonations in low-mass WDs have been suggested in the past (e.g., Ruiz-Lapuente et al. 1993). To produce little , the explosion must occur in WDs with central densities g cm-3 which corresponds to . In contrast to the DD-models, these models would not show a lower limit for the production and , and they would avoid the problem of mixing during a deflagration phase. Nonetheless, we regard these models as unlikely candidates for SN 1999by because there are a couple of severe problems beside the lack of a triggering mechanism for the explosion. The total mass of the ejecta is lower (by a factor of 2) than is required to keep the line forming region in the layers of explosive carbon and incomplete Si-burning up to two and four weeks after the explosion, respectively. The specific production of nuclear energy does not depend on . In this case, the diffusion time scales and, thus, the rise times to maximum light are (e.g. Pinto & Eastman, 2000). Compared to the LCs for a WD with , we expect rise times to be shorter by which is incompatible with SN 1999by observations.
This leaves the merging scenario as an alternative as we may expect a significant asphericity in the explosion if the merging occurs on hydrodynamical time scales. Nevertheless, this alternative is not a very attractive one. Based on 1-D parameterized models, Khokhlov, Müller, & Höflich (1993) provided chemical structures for explosions which may resemble merger models. As a general feature, these models show a shell-like structure with a massive outer layer of unburned C/O which encloses a thin, low mass layer of explosive carbon burning. This pattern is not consistent with the IR-spectra for SNe 1999by up to maximum light. However, it should be kept in mind that, besides the limitations of 1-D models for mergers, no chemical structures are available for merging subluminous models. A more severe problem for mergers may be that merger models tend to ignite prematurely and produce a detonation wave that burns the C/O WD to a O/Ne/Mg WD prior to the completion of the merger. Thus, merging may result in an accretion induced collapse rather than a SNe Ia (Saio & Nomoto, 1998).
6 Summary
IR-spectra of the subluminous SN1999by have been presented which cover the time evolution from about 4 days before to 2 weeks before maximum light. This is the first subluminous SN Ia (and arguably the first SN Ia) for which IR spectra with good time coverage are available. These observations allowed us to determine the chemical structure of the SN envelope.
Based on a delayed detonation model, a self-consistent set of hydrodynamic explosions, light curves, and synthetic spectra have been calculated. This analysis has only two free parameters: the initial structure of the progenitor and the description of the nuclear burning front. The light curves and spectral evolution follow directly from the explosion model without any further tuning, thus providing a tight link between the model physics and the predicted observables.
By varying a single parameter, the transition density at which detonation occurs, a set of models has been constructed which spans the observed brightness variation of Type Ia supernovae. The absolute maximum brightness depends primarily on the production which, for DD-models, depends mainly on the transition density . The brightness-decline relation observed in SNe Ia is also reproduced in these models. In the DD scenario this relation is a result of the temperature dependence of the opacity, or more precisely, as a consequence of the rapid drop in the opacities for temperatures less than about 7000 to 8000 K.
Within WD models, a certain amount of burning during the deflagration phase is needed to pre-expand the WD and avoid burning the entire star to . This implies a lower limit for the mass of about and, consequently, implies a minimum brightness for SNe Ia within this scenario. The best model for SN 1999by ( g cm-3, selected by matching to the predicted and observed optical light curves) is close to this minimum Ni yield. The data are consistent with little or no interstellar reddening (), and the derived distance is Mpc or Mpc if we take the limit for from the models or assume according Schlegel et al. (1998) for the galaxy.
Without any further modification, this subluminous model has been used to analyse the IR-spectra from May 6, May 10, May 16 and May 24, 1999, which correspond to d, 0 d, +7 d and +14 d after maximum light. The photosphere () recedes from 14000, to 10500, 6500 and 4000 km s-1. The observed and theoretical spectra agree reasonably well with respect to the Doppler shift of lines and all strong features could be identified.
Before maximum light, the spectra are dominated by products of about explosive carbon burning (O, Mg), and Si. Spectra taken at +7 d and +14 d after maximum are dominated by products of incomplete Si burning. At about 2 weeks after maximum, the iron-group elements begin to show up. The long duration of the phases dominated by layers of explosive carbon burning and incomplete Si burning implies massive layers of these burning stages that are comparable with our model results. ( and for explosive carbon and incomplete silicon burning, respectively.) This, together with the mass, argues that SN 1999by was the explosion of a WD at or near the Chandrasekhar mass.
Finally, we note that the observed IR spectra are at odds with recent 3-D calculations (Khokhlov, 2001) which predict that large scale chemical inhomogeneities filling 50 – 70% (in mass) of the WD will be formed during the deflagration phase. When the effect of such inhomogeneous mixing is tested by mixing the inner layers of our SN 1999by model, significant differences appear between the model spectra and the observed data. This suggests that no significant large-scale mixing took place in SN 1999by. The lack of observed mixing and the asphericity seen in SN 1999by may be important clues into the nature of subluminous SNe Ia, and may be related to the reason for a low DDT transition density (and hence the low luminosity). Alternatively, we may have an extended smoldering phase of the WD prior to the explosion which skips the deflagration phase altogether (see §5). In either case, the pre-conditioning of the WD prior to the explosion seems to be a key for understanding SNe Ia.
References
- Albrecht & Weller (2000) Albrecht, A., & Weller, J. 2000, BAAS, 197, 6106
- Aldering, Knop, & Nugent (2000) Aldering, G., Knop, P., & Nugent, P. 2000, ApJ, 119, 2110
- Arbor et al. (1999) Arbour, R., Papenkova, M., Li, W. D., Filippenko, A. V., & Armstrong, M. 1999, IAU Circ. 7156
- Becker & Iben (1979) Becker, S. A., & Iben Jr., I. 1979, ApJ, 232, 831
- Becker & Iben (1980) Becker, S. A., & Iben Jr., I. 1980, ApJ, 273, 111
- Benz et al. (1990) Benz, W. Cameron, A. G. W., Press, W. H. & Bowers, R. L. 1990, ApJ, 348, 647
- Bonanos et al. (1999) Bonanos, A., Garnavich, P., Schlegel, E., Jha, S., Challis, P., Kirshner, R., Hatano, K., & Branch, D. 1999, BAAS 195, 3806
- Bowers et al. (1997) Bowers, E. J. C., Meikle, W. P. S., Geballe, T. R., Walton, N. A., Pinto, P. A., Dhillon, V. S., Howell, S. B., & Harrop-Allin, M. K. 1997, MNRAS, 290, 663
- Brachwitz (2001) Brachwitz, F. 2001, PhD thesis, University of Basel/Switzerland, supervised by F.K. Thielemann
- Branch, Romanishin, & Baron (1996) Branch, D., Romanishin, W., Baron, E. 1996, ApJ465, 73
- Branch (1999) Branch, D. 1999, ARA&A 36, 17
- Burstein & Heiles (1982) Burstein, D. & Heiles, C. 1982, AJ, 87, 1165
- Collela & Woodward (1984) Collela, P., & Woodward, P.R. 1984, J. Comp. Phys., 54, 174
- de Vaucouleurs et al. (1991) de Vaucouleurs, G., de Vaucouleurs, A., Corwin Jr., H. G., Buta, R. J. Paturel, G., & Fouque, P. 1991, Third Reference Catalogue of Bright Galaxies, Version 3.9
- Domínguez & Höflich (2000) Domínguez, I., & Höflich, P. 2000, ApJ, 528, 854
- Domínguez, Höflich, & Straniero (2001) Domínguez, I., Höflich, P., & Straniero, O. 2001, ApJ, in press (Aug. 10)
- Erigichi & Müller (1985) Erigichi, Y., & Müller, E. 1985, A&A, 147, 161
- Filippenko et al. (1992) Filippenko, A. V. et al. 1992, AJ, 104, 1543
- Fisher et al. (1995) Fisher, A., Branch, D., Höflich, P., & Khokhlov, A. 1995, ApJ, 447, 73
- Fisher et al. (1998) Fisher, A., Branch, D., Höflich, P., & Khokhlov, A. 1998, ApJ, 494, 47
- Fisher et al. (1999) Fisher, A., Branch, D., Hatano, K., & Baron, E. 1999, MNRAS, 304, 679
- Garcia-Senz & Woosley, (1995) Garcia-Senz, D., & Woosley, S. E. 1995, ApJ 454, 895
- Garnavich, Jha, & Kirshner (1999) Garnavich, P., Jha, S., & Kirshner, R. 1999, IAU Circ. 7159
- Garnavich et al. (2001) Garnavich, P. M., Bonanos, A. Z., Jha, S., Kirshner, R. P., Schlegel, E. M., Challis, P., Macri, L. M., Hatano, K., Branch, D., Bothun, G. D., & Freedman, W. L. 2001, ApJ, submitted (astro-ph/0105490)
- Gerardy & Fesen (1999) Gerardy, C. L., & Fesen, R. A. 1999, IAU Circ. 7158
- Hamuy et al. (1995) Hamuy, M., Phillips, M. M., Maza, J., Suntzeff, N. B., Schommer, R. A., & Avilés, R., 1995, AJ, 109, 1
- Hamuy et al. (1996a) Hamuy, M. et al. 1996, AJ, 112, 2391
- Hamuy et al. (1996b) Hamuy, M., Phillips, M. M., Schommer, R. A., Suntzeff, N. B., Maza, J., & Avilés, R., 1996, AJ, 112, 2398
- Hanson, Conti, & Rieke (1996) Hanson, M. M., Conti, P. S., & Rieke, M. J. 1996, ApJS, 107, 281
- Hanson, Reike, & Luhman (1998) Hanson, M. M., Reike, G. H., & Luhman, K. L. 1998, AJ, 116, 1915
- Hanzl (1999) Hanzl, D., 1999, IAU-Circulars 7156, 7158, 7169, & 7223
- Hernandez et al. (2000) Hernandez, M. et al. 2000, MNRAS, 319, 223
- Hatano et al. (2000) Hatano, K., Branch, D., Lentz, E. J., Baron, E., Filippenko, A. V., & Garnavich, P. 2000, ApJ 543L, 49
- Hoffleit & Jaschek (1982) Hoffleit, D, & Jaschek, C. 1982, The Bright Star Catalog, 4th Revised Edition (New Haven: Yale University Observatory)
- Höflich, Müller, & Khokhlov (1993) Höflich, P., Mueller, E., Khokhlov, A. 1993, A&A 268, 570
- Höflich, Khokhlov, & Wheeler (1993) Höflich, P., Khokhlov, A., & Wheeler, J.C. 1993, A&A, 270, 223
- Höflich (1995) Höflich, P. 1995, ApJ, 443, 89 [H95]
- Höflich, Khokhlov, & Wheeler (1995) Höflich, P., Khokhlov, A., & Wheeler, J.C. 1995, ApJ, 444, 211 (HKW95)
- Höflich & Khokhlov (1996) Höflich, P., & Khokhlov, A. 1996, ApJ, 457, 500 (HK96)
- Höflich et al. (1996a) Höflich, P., Khokhlov, A., Wheeler, J. C., Phillips, M. M., Suntzeff, N. B., & Hamuy, M. 1996a, ApJ, 472, L81
- Höflich et al. (1996b) Höflich, P.; Dominik, C.; Khokhlov, A.; Müller, E.; & Wheeler, J. C. 1996b, Texas Symposium on relativistic Astrophysics, Annals of the New York Academy of Science, 759, 348
- Höflich (1997) Höflich, P. 1997, in: Supernovae and Cosmology, eds, Labhardt, Binggeli & Buser, Proc. of a Colloquium in Honor of G.A. Tammann, Publ. of the Astronomical Insitute, p.25
- Höflich, Wheeler, & Thielemann (1998) Höflich, P., Wheeler, J. C., & Thielemann, F. K. 1998, ApJ, 495, 617 (HWT98)
- Höflich et al. (2000) Höflich, P., Nomoto, K., Umeda, H., & Wheeler, J. C. 2000, ApJ, 528, 590
- Höflich & Stein (2001) Höflich, P., & Stein, J. 2001, ApJ, submitted (astro-ph/0104226)
- Howell et al. (2001) Howell, A., Höflich, P., Wang, L., & Wheeler, J. C. 2001, ApJ, 556, 302
- Hoyle & Fowler (1960) Hoyle, P., & Fowler, W.A. 1960, ApJ, 132, 565
- Iben (1972) Iben Jr, I. 1972, ApJ, 178, 433
- Iben & Tutukov (1984) Iben Jr, I. & Tutukov, A.V. 1984, ApJS, 54, 335
- Iwamoto et al. (1999) Iwamoto, K., Brachwitz, F., Nomoto, K., Kishimoto, N., Umeda, H., Hix, W. R., & Thielemann, F. K. 1999, ApJS, 125, 439
- Khokhlov (1991) Khokhlov, A. 1991, ApJ, 245, 114
- Khokhlov, Müller, & Höflich (1993) Khokhlov, A., Müller, E., & Höflich, P. 1993, A&A, 270, 223
- Khokhlov (1995) Khokhlov, A. 1995, ApJ, 449, 695
- Khokhlov (2001) Khokhlov, A. 2001, ApJ, in press (astro-ph/0008463)
- Kurucz (1993) Kurucz, R. L. 1993, Atomic Data for Opacity Calculations, Cambridge/Center for Astrophysics, CD
- Kurucz (1994) Kurucz, R. L. 1994, Solar Abundance Model Atmospheres for 0,1,2,4,8 km/s, Kurucz CD-Rom No. 19
- Langer et al. (2000) Langer, N., Deutschmann, A., Wellstein, S., & Höflich, P. 2000, A&A, 362, 1046
- Lentz et al. (2000) Lentz, E. J., Baron, E., Branch, D., Hauschildt, P., & Nugent, P. E. 2000, ApJ, 530, L966
- Lentz et al. (2001) Lentz, E. J., Baron, E., Branch, D., & Hausschildt, P. 2001, ApJ, 557, 2001
- Leibundgut et al. (1993) Leibundgut, B. et al. 1993, AJ, 105, 301
- Li et al. (1999) Li, W.-D., Modjaz, M., King, J. Y., Papenkova, M., Johnson, R. A., Friedman, A., Treffers, R. R., & Filippenko, A. V. 1999, IAU Circ. 7126
- Li et al. (2000) Li, W. -D., Filippenko, A. V., Treffers, R. R., Riess, A. G., Hu, J., & Qiu, Y. 2000, astro-ph/0006292
- Lisewski et al. (2000) Lisewski, A. M.; Hillebrandt, W.; Woosley, S. E.; Niemeyer, J. C.; Kerstein, A. R. 2000, ApJ 537, 405L
- Livingston & Wallace (1991) Livingston, W., & Wallace, L. 1991 July, NSO Tech. Rept. #91–001
- Livne (1999) Livne, E. 1999, ApJ, 527, 97
- Mazzali et al. (1997) Mazzali, P. A., et al. 1997, MNRAS, 284, 151
- Meikle et al. (1996) Meikle, W. P. S. et al. 1996, MNRAS, 281, 263
- Mendoza & Cunto (1993) Mendoza, C., & Cunto, W. 1993, A&A, 275, L5
- Mazzali et al. (2001) Mazzali, P. A., Nomoto, K., Cappelaro, E., Nakamura, T., Umeda, H., & Iwamoto, K. 2001, ApJ, in press & astro-ph/0009490
- Mihalas (1978) Mihalas, D. 1978, Stellar Atmospheres, San Francisco, Freeman
- Milne, The, & Leising (1999) Milne, P., The, L.-S., & Leising, M.D. 1999, ApJS 124, 503
- Modjaz et al. (2000) Modjaz, et al. 2000, PASP, submitted, astro-ph/0008012
- Niemeyer & Hillebrandt (1995) Niemeyer, J. C., & Hillebrandt, W. 1995, ApJ, 452, 779
- Nomoto, Sugimoto, & Neo (1976) Nomoto, K., Sugimoto, S., & Neo, S. 1976, ApSS, 39, L37
- Nomoto (1980) Nomoto, K. 1980, ApJ, 248, 798
- Nomoto (1982) Nomoto, K. 1982, ApJ 253, 798
- Nomoto, Thielemann, & Yokoi (1984) Nomoto, K., Thielemann, F. -K., & Yokoi, K. 1984, ApJ, 286, 644
- Nugent et al. (1995) Nugent, P., Phillips, M., Baron, E., Branch., D., & Hauschildt, P. 1995, ApJ, 455, L147
- Nugent et al. (1997) Nugent, P., Baron, E., Hauschildt, P., & Branch., D. 1997, ApJ, 485, 812
- Paczyński (1985) Paczyński, B., 1985, in: Cataclysmic Variables and Low-Mass X-Ray Binaries, eds. D.Q. Lamb, J. Patterson, Reidel, Dordrecht, p.1
- Papenkova, Li, & Filippenko (1999) Papenkova, M., Li, W. D., & Filippenko, A. V. 1999, IAU Circ. 7156
- Persson et al. (1998) Persson, S. E., Murphy, D. C., Krzeminski, W., Roth, M., & Rieke, M. J. 1998, ApJ, 116, 2475
- Pinto & Eastman (2000) Pinto, P., Eastman, R. G. 2000, ApJ, 530, 744
- Phillips et al. (1987) Phillips, M. M. et al. 1987, PASP90, 592
- Phillips et al. (1999) Phillips, M. M., Lira, P., Suntzeff, N. B., Schommer, R. A., Hamuy, M., & Maza, J. 1999, AJ, 118, 1766
- Rudy et al. (2001) Rudy R.J., Lynch D.K., Mazuk S., Venturini C.C., Puetter R.C., Höflich P. 2001, ApJ, submitted
- Ruiz-Lapuente et al. (1993) Ruiz-Lapuente, P., Jeffery, D., Challis, P. M., Filippenko, A. V., Kirshner, R. P., Ho, L. H., Schmidt, B. P., Sanchez, F., & Canal, R. 1993, Nature, 365, 728
- Saio & Nomoto (1998) Saio, H., & Nomoto, K. 1998, ApJ, 500, 388
- Schlegel et al. (1998) Schlegel, D. J., Finkbeiner, D. P., & Davis, M. 1998, ApJ, 500, 525
- Suntzeff et al. (1999) Suntzeff, N. B., et al. 1999, ApJ, 117, 1175
- Toth & Szabo (2000) Toth, I., & Szabo, R. 2000, ApJ, 361, 63
- Treffers et al. (1997) Treffers, R. R., Peng, C. Y., Filippenko, A. V., & Richmond, M. W. 1997, IAU Circ. 6627
- Turatto et al. (1998) Turatto, M., Piemonte, A., Benetti, S., Cappellaro, E., Mazzali, P. A., Danziger, I. J., & Patat, F. 1998, AJ, 116, 2341
- Thielemann, Nomoto, & Hashimoto (1996) Thielemann, F. K., Nomoto, K., & Hashimoto, M. 1996, ApJ, 460, 408
- Umeda et al. (1999) Umeda, H., Nomoto, K., Kobayashi, C., Hachisu, I., & Kato, M. 1999, ApJ, 522, L43
- Wallace, Hinkle, & Livingston (1993) Wallace, L., Hinkle, K., & Livingston, W., 1993 April, NSO Tech. Rept. #93–001
- Wang, Wheeler, & Höflich (1997) Wang, L., Wheeler, J. C., & Höflich, P. 1997, ApJ, 476, L27
- Wang, Howell, Wheeler, & Höflich (1997) Wang, L., Howell, A., Höflich, P., & Wheeler J.C. 2001, ApJ 550, 1030
- Webbink (1984) Webbink, R. F. 1984, ApJ, 277, 355
- Wheeler et al. (1998) Wheeler, J. C., Höflich, P., Harkness, R. P., & Spyromilio, J. 1998, ApJ, 496, 908
- Whelan & Iben (1973) Whelan, J., & Iben Jr., I. 1973, ApJ, 186, 1007
- Woosley, Weaver, & Taam (1980) Woosley, S. E., Weaver, T. A., & Taam, R. E. 1980, in: Type I Supernovae, ed. J. C. Wheeler, Austin, U. Texas, p.96
- Woosley & Weaver (1986) Woosley, S. E., & Weaver, T. A. 1986, ARA&A, 24, 205
- Woosley & Weaver (1994) Woosley, S. E., & Weaver, T. A. 1994, ApJ, 423, 371
- Yamaoka et al. (1992) Yamaoka, H., Nomoto, K., Shigeyama, T., & Thielemann, F. 1992, ApJ, 393, 55
| Date | Epoch | Setup | Exp. Time | Observer |
|---|---|---|---|---|
| 6 May | -4 d | 0.96–1.8 µm | 4600 s | Gerardy |
| ” | ” | 1.95–2.4 µm | 3600 s | ” |
| 7 May | -3 d | 0.96–1.8 µm | 3600 s | ” |
| ” | ” | 1.95–2.4 µm | 3600 s | ” |
| 8 May | -2 d | 0.96–1.8 µm | 3600 s | ” |
| 9 May | -1 d | 0.96–1.8 µm | 3600 s | ” |
| ” | ” | 1.2–2.2 µm | 3600 s | ” |
| 10 May | 0 d | 0.96–1.8 µm | 3600 s | ” |
| ” | ” | 1.2–2.2 µm | 3600 s | ” |
| ” | ” | 1.95–2.4 µm | 3600 s | ” |
| 16 May | 6 d | 0.96–1.8 µm | 3600 s | Martini & Steed |
| 18 May | 8 d | 0.96–1.8 µm | 3600 s | ” |
| 20 May | 10 d | 0.96–1.8 µm | 3600 s | ” |
| 21 May | 11 d | 0.96–1.8 µm | 3600 s | Sakai |
| 24 May | 14 d | 0.96–1.8 µm | 3600 s | ” |
| NIR Photometry | ||||
| Date | Epoch | J | H | K |
| 6 May | -4 d | |||
| 7 May | -3 d | |||
| 8 May | -2 d | |||
| Name | ||||||
|---|---|---|---|---|---|---|
| 5p0z22.8 | 8. | 0.095 | -17.21 | 13.9 | 0.47 | 1.45 |
| 5p0z22.10 | 10. | 0.107 | -17.35 | 14.1 | 0.42 | 1.37 |
| 5p0z22.12 | 12. | 0.137 | -17.63 | 14.7 | 0.38 | 1.32 |
| 5p0z22.14 | 14. | 0.153 | -17.72 | 14.9 | 0.22 | 1.30 |
| 5p0z22.16 | 16. | 0.268 | -18.72 | 15.8 | 0.14 | 1.26 |
| 5p0z22.18 | 18. | 0.365 | -18.82 | 16.6 | 0.08 | 1.21 |
| 5p0z22.20 | 20. | 0.454 | -18.96 | 17.0 | 0.02 | 1.19 |
| 5p0z22.23 | 23. | 0.561 | -19.21 | 18.2 | -0.02 | 1.05 |
| 5p0z22.25 | 25. | 0.602 | -19.29 | 18.6 | -0.02 | 1.00 |
| 5p0z22.27 | 27. | 0.629 | -19.35 | 19.0 | -0.03 | 0.91 |