STUDY OF GAMMA RAY BURST BINARY PROGENITORS
Abstract
Recently much work in studying Gamma-Ray Burst (GRB) has been devoted to revealing the nature of outburst mechanism and studies of GRB afterglows. These issues have also been closely followed by the quest for identifying GRB progenitors. Several types of progenitors have been proposed for GRBs: the most promising objects seem to be collapsars, compact object binaries, mergers of compact objects with helium cores of evolved stars in common envelope episodes, and also the recently discussed connection of GRBs with supernovae. In this paper we consider the binary star progenitors of GRBs: white dwarf neutron star binaries (WD-NS), white dwarf black hole binaries(WD-BH), helium core neutron star mergers (He-NS), helium core black hole mergers (He-BH), double neutron stars (NS-NS) and neutron star black hole binaries (NS-BH).
Using population synthesis methods we calculate merger rates of these binary progenitors and we compare them to the observed BATSE GRB rate. For the binaries considered, we also calculate the distribution of merger sites around host galaxies and compare them to the observed locations of GRB afterglows with respect to their hosts. We find that the rates of binary GRB progenitors in our standard model are lower than the observed GRB rates if GRBs are highly collimated. However, the uncertainty in the population synthesis results is too large to make this a firm conclusion. Although some observational signatures seem to point to collapsars as progenitors of long GRBs, we find that mergers of WD-NS, He-NS, He-BH, and NS-NS systems also trace the star formation regions of their host galaxies, as it is observed for long GRBs.
We also speculate about possible progenitors of short-duration GRBs. For these, the most likely candidates are still mergers of compact objects. We find that the locations NS-NS and NS-BH mergers with respect to their hosts are significantly different. This may allow to distinguish between these two progenitor models, once current and near future missions, such as HETE-II or SWIFT, measure the locations of short GRBs.
Subject headings:
gamma ray bursts: progenitors — binaries: close — stars: evolution, formation, black holes, neutron, white dwarfs1. INTRODUCTION
The last decade brought a great breakthrough in gamma-ray burst studies. The BATSE detectors on GRO have shown that GRBs are distributed isotropically on the sky, and that their brightness distribution is not consistent with a uniform source distribution in Euclidean space (Paciesas et al. 1999). Observations of GRB afterglows in X-ray, optical and radio wavelength domains (Costa et al. 1997; Groot et al. 1997b) led to identification of GRB host galaxies (Groot et al. 1997a) and measurements of their redshifts. This has solved the long standing problem of their distance scale. While we learned that GRBs come from cosmological distances, there are still two major difficulties in understanding this phenomenon. First, we do not fully understand the physics of the outburst. Although several models have been proposed, they all have yet to meet some severe constraints imposed by observations (i.e. releasing energies of – ergs in timescales as short as s in the case of some GRBs). Second we do not know what are the astronomical objects leading to gamma-ray bursts, i.e. what are their progenitors.
In recent years the black hole accretion disk model for GRBs has been given much attention (Fryer, Woosley & Hartmann 1999a; Meszaros 2000; Brown et al. 2000). Progenitors leading to this model include collapsars (Woosley 1993; Paczynski 1998, MacFadyen & Woosley 1999) and binary mergers: helium star black hole (Fryer & Woosley 1998), double neutron stars (Ruffert et al. 1997; Meszaros & Rees 1997), black hole neutron star (Lee & Kluzniak 1995; Kluzniak & Lee 1998) and black hole white dwarf systems (Fryer et al. 1999b). Also recently the connection between supernovae and gamma-ray bursts received much attention (Paczynski 1999; Woosley 2000; Chevalier 2000), however, there is still no clear evidence that these two phenomena are intrinsically correlated (Graziani et al. 1999).
A good method of discerning among the binary progenitors is to compare theoretical predictions of their merger site distributions around host galaxies with location of observed GRBs within host galaxies. Binary population synthesis can be of great help in addressing this question. One can calculate the properties of a given binary population and then place it in a galactic gravitational potential to trace each binary until its components merge due to gravitational wave energy losses. This method has to deal however with a number of uncertainties, that are inherent in the binary population synthesis. Moreover there are uncertainties in what type and mass of a galaxy to use.
The binary population synthesis method has already been applied to the study of compact object binaries in the context of GRB progenitors. However most studies have been concentrated only on double neutron stars and black hole neutron star systems. Lipunov et al. (1995) have used their “scenario machine” to model the population of double neutron star and black hole neutron star binaries in a galaxy. They calculated the expected - GRB distribution assuming that they are standard candles and compared it with the BATSE observations. Portegies-Zwart and Yungelson (1998) have considered the origin and properties of double neutron star systems and black hole neutron star binaries. They considered a few binary population synthesis models, with varying kick velocities, initial binary separations, initial mass ratios distribution and also considered cases with and without hyper accretion in the common envelope stage. They found the rates of mergers to be consistent with the GRB rate provided that GRBs are collimated to about ten degrees, and mentioned that double neutron stars may travel Mpc distances out of a Milky Way like galaxy before merging. Bloom, Sigurdsson & Pols (1999) considered double neutron stars as possible GRB progenitors, and calculated distributions of mergers of these binaries around galaxies with different masses, varying the average kick velocities in the code. They found that a significant fraction of double neutron stars merge outside their host galaxies. Bulik, Belczynski & Zbijewski (1999) considered the mergers of binaries containing neutron stars, and Belczynski, Bulik & Zbijewski (2000) investigated differences between the populations of black hole neutron star binaries and the double neutron stars. Belczynski et al. (2000) found that black hole neutron star binaries merge closer to the hosts than the double neutron stars. Fryer et al. (1999a) considered other types of binary progenitors of GRBs within the framework of the black hole accretion disk model of the GRB central engine. These were white dwarf black hole mergers, helium star black hole mergers, and collapsars in addition to the double neutron star systems and black hole neutron star binaries. They performed a thorough parameter study, and repeated the calculations with a number of modifications of their standard evolutionary model. They calculated the distribution of merger sites in the potentials of galaxies with the masses of (Milky Way), , and , however they do not vary the galactic size with mass. Bloom, Kulkarni & Djorgovski (2001) presented a very detailed study of the observational offsets between observed afterglows and GRB hosts galaxies. They compare these observations with the theoretical distributions calculated with the code of Bloom et al. (1999) and conclude that the so called delayed merging remnants i.e. double neutron star systems and black hole neutron star binaries are unlikely to be GRB progenitors, and argue in favor of the prompt bursters like collapsars and black hole helium star mergers.
In this work we extend our previous studies (Belczynski & Bulik 1999; Bulik et al. 1999; Belczynski et al. 2000) to include four more proposed binary progenitors: compact object (black hole or neutron star) white dwarf binaries and Helium star mergers with black holes or neutron stars. We use a much improved and well tested binary population synthesis code and for consistency we also present the updated results for the two previously studied types of proposed progenitors: double neutron star and black hole neutron star systems. We calculate the properties of the ensemble of each type of the proposed GRB progenitors and find their distributions around different types of host galaxies. We compare the observed GRB distribution around host galaxies with the models. In order to verify the robustness of the results we perform a detailed parameter study and discuss the population synthesis models which are responsible for the largest differences.
An additional way of telling which group of the proposed binaries might be responsible for GRBs is to predict their rates and compare them to the observed rate of GRBs. Population synthesis is a powerful tool for predicting rates of binary populations although it suffers from many uncertainties as some parameters of single and binary evolution are poorly known. Moreover, population synthesis works well in predicting the relative numbers of events, while calculation of absolute rates requires additional assumptions. However, such attempts have been made by a number of authors mentioned above. Using the population synthesis method we calculate merger rates of white dwarf neutron star, white dwarf black hole, double neutron star, neutron star black hole systems, and formation rates of Helium star black hole and neutron star mergers. We compare the BATSE detection rate of GRBs with the cosmic rates of the binary progenitors predicted in our calculations.
In § 2 we describe the population synthesis code StarTrack used to calculate properties of binary GRB progenitors, in § 3 we present the results, and finally § 4 is devoted to discussion with conclusions.
2. POPULATION SYNTHESIS MODEL
2.1. Stellar Evolution
We use the StarTrack population synthesis code (Belczynski, Kalogera & Bulik 2001b). Here, we summarize only the basic assumptions and ideas of the code.
The evolution of single stars is based on the analytic formulae derived by Hurley, Pols & Tout (2000). With these formulae we are able to calculate the evolution of stars for Zero Age Main Sequence (ZAMS) masses: and for metallicities: . We follow the stellar evolution from ZAMS through different evolutionary phases depending on the initial (ZAMS) stellar mass: Main Sequence, Hertzsprung Gap, Red Giant Branch, Core Helium Burning, Asymptotic Giant Branch, and for stars with their hydrogen-rich layers stripped off: Helium Main Sequence, Helium Giant Branch. We end the evolutionary calculations at the formation of a stellar remnant: a white dwarf, a neutron star or a black hole. There are two modifications to the original Hurley et al. (2000) formulae concerning the treatment of (i) final remnant masses, and (ii) Helium-star evolution (see Belczynski et al. 2001b; Belczynski & Kalogera 2001).
The StarTrack code employs Monte Carlo techniques to model the evolution of single and binary stars. In this work we use StarTrack to evolve large ensemble of stars, and calculate statistical properties of the binary GRB progenitors.
A binary system is described by four initial parameters: the mass of the primary (the component which is initially more massive), the mass ratio between the secondary and the primary, the semi-major axis of the orbit , and the orbital eccentricity . Each of these initial parameters is drawn from a distribution and we assume that these distributions are independent. More specifically, the mass of the primary is drawn from the Scalo initial mass function (Scalo 1986),
| (1) |
and within the mass range . The distribution of the mass ratios is taken to be
| (2) |
following Bethe & Brown (1998). The initial binary separations are assumed as in Abt (1993)
| (3) |
and finally, the initial distribution of the binary eccentricity is taken following Duquennoy & Mayor (1991)
| (4) |
As we are interested only in the systems capable of producing binary GRB progenitors, containing at least one NS or BH, we evolve only massive binaries, with primaries more massive than 5 M⊙. During the evolution of every system we take into account the effects of wind mass-loss, asymmetric SN explosions, binary interactions (conservative/non-conservative mass transfers, common envelope phases) on the binary orbit and the binary components. We also include the effects of accretion onto compact objects in common envelope (CE) phases (Brown 1995; Bethe and Brown 1998; Belczynski et al. 2001b) and rejuvenation of binary components during mass transfer episodes. Once a binary consists of two stellar remnants (NS, BH, WD), we calculate its merger lifetime, the time until the components merge due to gravitational radiation and associated orbital decay.
The StarTrack code may be used in several tens of modes, allowing for the change of main evolutionary parameters and initial distributions. In the following, together with the given above initial distributions, we define standard evolutionary model, with the set of parameters, thought to represent our best understanding of stellar single and binary evolution. (1) Kick velocities. Compact objects receive natal kicks, when they form in supernova explosions. Neutron star kicks are drawn from a weighted sum of two Maxwellian distributions with km s-1 (80%) and km s-1 (20%) (similar to the one of Cordes & Chernoff 1998). For black holes formed via partial fall back we use smaller kicks, but drawn from the same distribution as for NS. The kick scales with the amount of material ejected in SN explosion or inversely with the amount of falling back material (i.e., bigger the fall back, smaller the kick). For BH formed in direct collapse of massive stars, we do not apply any kicks, as no supernova explosion accompanies the formation of such objects. (2) Maximum NS mass. We adopt a conservative value of M⊙ (e.g., Kalogera & Baym 1996). The mass of a compact object is estimated based on the mass and evolutionary status of its immediate progenitor, and not on any a priori assumptions. Once the mass of a compact object is calculated, its type (either NS or BH) is set by the value of . Thus the choice of does not affect the overall population of compact objects. However, it affects the rates and various properties of binary GRB progenitors, as some of their groups contain either NS or BH (see § 3). (3) Common envelope efficiency. We assume , where is the efficiency with which orbital energy is used to unbind the stellar envelope (e.g., Webbink 1984), and is the measure of the central concentration of the giant (e.g., Dewi & Tauris 2000); (4) Non–conservative mass transfer. In cases of dynamically stable mass transfer between non–degenerate stars we allow for mass and angular momentum loss from the binary (see Podsiadlowski, Joss, & Hsu 1992), assuming that the fraction of the mass lost from the donor is accreted to the companion, and the rest () is lost from the system with specific angular momentum equal to /. We adopt (e.g., Meurs & van den Heuvel 1989) and (e.g., Podsiadlowski et al. 1992); (5) Star formation history. We assume that star formation has been continuous in the disk of a given galaxy. To assess the properties of the current population of GRB progenitors, we start the evolution of a single star or a binary system ago, and follow it to the present time. The birth time is drawn randomly from the range 0–10 Gyr, which corresponds to continuous star formation rate within the disk of our Galaxy (Gilmore 2001). (6) Initial Binarity. We assume a binary fraction of , which means that for any 150 stars we evolve, we have 50 binary systems and 50 single stars. (7) Metallicity. We assume solar metallicity . (8) Stellar Winds. The single-star models we use (Hurley et al. 2000) include the effects of mass loss due to stellar winds. Mass loss rates are adopted from the literature for different evolutionary phases. For H-rich massive stars on MS (Nieuwenhuijzen & de Jager (1990); using dependence of Kudritzki et al. 1989), for RG branch stars (Kudritzki & Reimers 1978), on AGB (Vassiliadis & Wood 1993) and for Luminous Blue Variables (Hurley et al. 2000). For He-rich stars W–R mass loss is included using the rates derived by Hamann, Koesterke & Wessolowski (1995) and modified by Hurley et al. (2000).
2.2. Dynamical Evolution of Stars in Model Galaxies
The population synthesis code allows us to calculate the age for each system at the time when both stellar remnants have formed, and the subsequent merger time of a given system based on the remnant masses and their orbit. We also calculate the systemic velocity gain due to asymmetric SN explosions and/or associated mass loss. We use these informations to propagate binary GRB progenitor systems in different galactic potentials, and to compute the distribution of their mergers sites around different mass and size hosts.
The potential of a spiral galaxy can be described as a sum of three components: bulge, disk, and halo. A good representation of the galactic disk and bulge potential was presented by Miyamoto & Nagai (1975):
| (5) |
where the index refers to either bulge or disk, and are the parameters, is the mass, and the coordinates span the galactic plane. The dark matter halo potential is spherically symmetric
| (6) |
where is the core radius. The halo potential corresponds to a mass distribution , and we introduce a cutoff radius beyond which the halo density falls to zero, in order to make the halo mass finite and the halo gravitational potential is when .
We consider galaxies with four masses, expressed in the units of Milky Way mass (): . For the Milky Way mass galaxy the bulge potential () is described by: kpc, kpc, ; the disk potential (): kpc, kpc, ; the halo potential: kpc, and and the kpc (Paczynski 1990; Blaes & Rajagopal 1991). To obtain the potential of a galaxy with the mass we rescale all the masses by the factor of and the distances by . Such scaling keeps the galaxy density constant, and we made sure that our model galaxies have flat rotation curves.
We adopt the following distribution of stars within the disk of a given galaxy (Paczynski 1990): The radial distribution is exponential
| (7) |
and extends up to . The vertical distribution is also exponential
| (8) |
For a Milky Way type galaxy we have , and these parameters are assumed to scale with the galaxy mass as .
Each binary moves initially with the local rotational velocity in its galaxy, and has no vertical component of velocity. After each supernova explosion the kick imparted on the binary is added and the binary trajectory is calculated until the merger occurs.
3. RESULTS
3.1. Binary GRB Progenitor Types
Fryer et al. (1999b), suggested the possibility that white dwarf neutron star (WD-NS) merger may lead to formation of a black hole accretion disk system, followed by a GRB. Since the GRB outburst mechanism is not well understood, the results of hydrodynamic calculations of stellar mergers should be treated with some caution. However, we will consider the group of WD-NS systems as potential GRB progenitors, for the sake of completeness of the study. From the entire group of coalescing WD-NS binaries we chose these, which have the best chance to produce observable GRBs, i.e., systems in which WD are more massive than to make sure that the mass transfer onto the NS is unstable, and the total mass of the system satisfies , since we require that the NS has to accrete enough material to collapse to a BH and that the disk formed in the merger must have the mass of at least to produce a GRB (Fryer et al. 1999b, 2001).
Fryer et al. (1999b) also suggested that mergers of white dwarf black hole (WD-BH) binaries may give a rise to GRBs. Following the Fryer et al. (1999b) hydrodynamical calculations, we require that WD mass is larger than to classify a coalescing WD-BH system as a potential GRB progenitor. Only for these high WD masses, the accretion of WD onto BH is dynamically unstable and the rapidly disrupted (in several binary rotations) WD forms a thick disk around BH, which may give a rise to GRB.
In Figure 1 we present the distribution of WD masses in coalescing WD-NS and WD-BH systems. For WD-BH binaries, WD masses distribution rises sharply at and then falls approximately exponentially to flatten out for masses higher that . Therefore, changing the to slightly higher/smaller values, will decrease/increase the number of WD-BH GRB progenitors roughly proportionally to the WD mass limit change. For WD-NS systems, the WD masses distribution is also rather flat close to and over . However, as the value of limiting mass of WD is highly uncertain, we will present two models with the decreased and increased .
Fryer & Woosley (1998) proposed yet another type of binary GRB progenitors, i.e. binaries merging in CE events, with one component being an evolved (giant) star and the other already a compact object, either NS or BH. In this scenario, the binary does not have enough orbital energy to eject the common envelope, so the compact object spiraling in finally merges with the helium core of the giant. The compact object disrupts tidally the helium star, accreting part of its material, and becoming a BH, if it was not one already. The remainder of the giant’s helium core forms a thick accretion disk around the BH, a configuration, which is believed to give a rise to a GRB.
In our models we distinguish systems that contain either a NS or a BH at the onset of the CE phase, leading to the final merger. We will denote systems containing NS as helium star/neutron star mergers (He-NS), and containing BH as helium star/black hole mergers (He-BH). Following the detailed studies of He-NS and He-BH mergers (Bottcher & Fryer 2000; Zhang & Fryer 2000), we choose only these systems in which helium core mass exceeds as GRB progenitors.
The distributions of helium core masses for He-NS and He-BH at the onset of the final CE phase are shown in Figure 2. Both distributions rise sharply at , then for He-NS mergers the distribution falls down rapidly above , while for He-BH mergers the distribution decrease starts at a higher mass, , and is more gradual. Thus the number of GRB progenitor He-NS mergers depends strongly on the value of , so we will present models with different value of this limiting helium core mass.
Finally, the most intensively studied binary progenitors of GRBs are double neutron stars (NS-NS) and neutron star black hole systems (NS-BH). In defining the boundary between NS-NS systems and NS-BH systems we assume that the maximal mass of a neutron star is , however we will also present results for two smaller limiting masses of . The mass distribution of compact objects in these types of binaries, starts in our code with the maximum at the , followed by a rapid decline (which reflects the shape of the assumed initial mass function) and then at around flattens out and stays roughly constant up to the highest BH masses of . The maximum BH mass is set by the effect of wind mass loss on massive stars. This distribution is presented and discussed in detail by Belczynski et al. (2001b).
Belczynski & Kalogera (2001) and Belczynski, Bulik & Kalogera (2001a) identified new subpopulations of NS-NS binaries. The new subpopulations dominate the group of coalescing NS-NS systems, and moreover, they were found to exhibit quite different properties than the systems studied to date. Given the importance of these subpopulations to our conclusions, in the following subsection we briefly summarize the results of Belczynski & Kalogera (2001) and Belczynski et al. (2001a).
3.2. Double neutron star binaries
Double neutron stars are formed in various ways, including more than 14 different evolutionary channels, identified in Belczynski et al. (2001b). We find that the entire population of coalescing NS-NS systems, may be divided into three subgroups.
Group I consists of non-recycled NS-NS systems (containing two non-recycled pulsars), which finish their evolution in a double CE of two helium giants. Two bare CO cores emerge after envelope ejection, and they form two NS in two consecutive SN type Ic explosions. Provided that the system is not disrupted by SN kicks and mass loss, the two NS form a tight binary, with the unique characteristic that none of the NS had a chance to be recycled. For more details see Belczynski & Kalogera (2001). Group II includes all the systems that finished their evolution through a CE phase, with a helium giant donor and a NS companion. During the CE phase a NS accretes material from the envelope of the giant, becoming most probably a recycled pulsar. The carbon-oxygen core of the Helium giant forms another NS soon after the CE phase ends. The system has a good chance to survive even if the newly born NS receives a high kick because it is very tightly bound after the CE episode. For more details see Belczynski et al. (2001a). Group III consists of all the other NS-NS systems formed, through the classical channels (e.g. Bhattacharya & van den Heuvel 1991).
In our standard model, group II strongly dominates the population of coalescing NS-NS systems (81%) over group III (11%) and I (8%). This is due to the fact that we allow for helium star radial evolution, and usually just prior to the formation of a tight (coalescing) NS-NS system we encounter one extra CE episode, as compared to the classical channels. This has major consequences for the merger time distribution of the NS-NS population, and in turn for the distribution of NS-NS merger sites around their host galaxies. Merger times of classical systems are comparable with the Hubble time, and that gives them ample time to escape from their host galaxies. As it has been shown in previous studies (e.g., Bulik et al. 1999; Bloom et al. 1999) which did not include Helium star detailed radial evolution, a significant fraction of the NS-NS population tended to merge outside host galaxies, exactly like group III - the classical systems. In contrast, the binaries of Groups I and II, due to the extra CE episode, are tighter, and their merger times are much shorter: of order of Myr. Thus even if they acquire high systemic velocities due to the asymmetric SN explosions, they will merge within the host galaxies, near the places they were born. Group I and II dominate the population, and thus the overall NS-NS distribution of merger sites will follow the distribution of primordial binaries or star formation regions in the host galaxies.
The formation of NS-NS systems of group I and II depends on the assumption that evolved low mass helium donors can initiate and survive CE phase. This assumption have yet to be proven by detailed hydrodynamical calculations.
Since, the properties of these new subpopulations were already discussed separately (Belczynski et al. 2001a) we present here only the results for the overall population of NS-NS binaries.
3.3. Characteristic Binary Timescales
We call the time a given system needs to evolve from ZAMS to form two stellar remnants, the evolutionary time and denote it by . We call the time required for these stellar remnants to merge due to gravitational radiation the merger time and denote it by . The total lifetime of a given system is the sum of the two: . In Figure 3 we show the distributions of both evolutionary and merger times for all GRB binary candidates, while in Table 1 we list the distributions medians and spans defined as the time range containing 90% of the systems around the median.
In general, the evolutionary delays are of the order of a few to several tens Myrs, and their distributions are rather narrow for different types of systems. Since the rate of evolution of a given star depends primarily on its mass, is set mainly by the mass of a given binary components. The evolution proceeds slower for less massive stars, and is determined in general by the mass of the secondary (unless the mass ratio is reversed due to the mass transfer). This is why for WD-NS and WD-BH systems is the longest and almost equal ( Myr), as WD are the lightest components of binary GRB candidates. The NS-NS and NS-BH binaries are formed in shorter times, with the median of distributions of and Myr, respectively. Evolutionary times for He-NS and He-BH are very short ( Myr), as they finish their evolution even before formation of a second remnant.
Merger times are quite different for various binary GRB candidates. For He-NS and He-BH mergers we do not list , as these events take place even before two stellar remnants are formed, due to the components merger in CE spiral in. The shortest merger times are found for NS-NS binaries and for WD-NS systems, with the medians of and Myr, respectively. Much longer merger times are characteristic of WD-BH systems ( Myr), with the longest found for NS-BH binaries ( Myr).
3.4. Event Rates
The method of population synthesis requires use of quite a number of parameters, and initial distributions of variables which may affect the final results. In order to assess their influence on the final results we have repeated the calculations with varying evolutionary parameters. The models and the differences with the standard model are listed in Table 2. The coalescence rates of different types of GRB progenitors within each model are shown in Table 3. They have been calibrated to the Type II supernova empirical rates and normalized to our Galaxy (Capellaro, Evans & Turatto 1999). The standard model (A) results are based on a simulation of binaries, while the remaining models are the simulations of at least binaries. The statistical accuracy of most rates is better than a few percent, however in some cases where the rates are smaller than Myr-1 the accuracy is of the order of a few tens percent, yet improving them would require a huge computational effort.
Models B1-13 represent the results of evolution with different kick velocities imparted on the compact objects. In model B1 we assume symmetric SN explosions, whereas in models B2–12 we draw the kick velocity from a single Maxwellian:
| (9) |
varying values in the range . In model B13 we use a kick distribution of the form suggested by Paczynski (1990):
| (10) |
which allows for a significant fraction of low–magnitude kicks. We use , which gives a reasonable fit to the population of single pulsars in the solar vicinity (Hartman 1997).
In Figure 4 we show the dependence of coalescence rates on the assumed kick velocity distribution. Due to the fact that high kicks tend to disrupt binaries, the number of systems formed with at least one compact object, falls off quickly with the kick velocity. This has already been noticed for NS-NS and NS-BH binaries (e.g., Lipunov, Postnov & Prokhorov 1997; Belczynski & Bulik 1999), and also for WD-BH systems and He-BH mergers (Fryer et al. 1999a). As seen from Figure 4, the coalescence rates of GRB progenitors fall off approximately exponentially with the kick velocity. Note however, that the slope is smaller for He-NS and He-BH mergers than for other types of progenitors. This is due to (i) only one kick the system receives, (ii) the relatively high total mass of the binary (recall that ), so the kick imparted to NS or BH does not have a big impact on such systems.
For the majority of models the rates for WD-NS mergers stay close to several coalescence events per Myr per Galaxy. However, the rate changes significantly ( Myr-1) for a few extreme models. Besides the strong dependence of the rates on kick velocity discussed above, a large number of WD-NS is produced in models D1 and D2, in which the neutron star maximal mass is smaller than in the other models. This increase is due to our requirement that only systems with total mass higher than the maximal neutron star mass increased by 0.3 are classified as GRB progenitors.
In fact, the coalescence rate of all WD-NS systems (irrespective of WD or total system mass) is as high as Myr-1 and Myr-1 for our standard model and model D2, respectively. For the very low CE efficiency of model E1, the rate drops down almost to zero, since in this model many systems potentially able to form a WD-NS GRB progenitor evolve through CE phase. Once the CE efficiency drops, a system needs to use more orbital energy to expel the envelope, and it becomes tighter. At very small efficiencies, there is not enough orbital energy for envelope ejection, and the two stars merge, thus decreasing the final number of WD-NS systems.
Coalescence rates of WD-BH vary much less than these of WD-NS progenitors, and they stay close to few coalescence events per Myr per Galaxy for most models. The largest change ( Myr-1) appears for models D2 and E1 similarly to the case of WD-NS. The lowest rate of model E1 is explained in the same way as for WD-NS progenitors. The highest rate of model D2, reflects the fact of the lowest NS/BH mass limit, and many systems classified in other models as WD-NS, here are counted as WD-BH.
The coalescence rates of He-NS change almost by 3 orders of magnitude ( Myr-1), although for most models, including the standard one, they remain close to several events per Myr per Galaxy. The number of helium star mergers strongly (2 orders of magnitude) depends on the required minimum mass of the Helium core - see models P1-2 and also Figure 2. This is explained by our adopted IMF, which gives more low mass stars, therefore low-mass helium cores are much more abundant (note the high rate of model P1 with ) than the massive ones (low rate of model P2 with ). The lowest rates are found for models D1 and D2, with the maximal NS mass of 2.0 and 1.5 . With decreased , as compared to our standard model, we choose only the lightest possible primaries, which will evolve to form NS. On the other hand we require that the secondary must form helium core, so it needs to have been massive already at the start. In these models only the binaries with relatively comparable mass components () may evolve to form He-NS mergers. Thus, decreasing , narrows down the range of in which He-NS mergers may be formed, which results in drop of their rate (recall that we adopted a flat initial mass ratio distribution).
The rates for He-BH mergers are the most independent of model parameters varying just by an order of magnitude ( Myr-1), which considering the extreme changes in model parameters and initial distributions is quite remarkable. The coalescence rate for standard model is 23.5 events per Myr per Galaxy, and it remains approximately at this level for the majority of models.
The dependence of NS-NS and NS-BH merger rates on the model parameters is discussed in detail by Belczynski et al. (2001b), and in what follows we restrict the description just to a brief summary.
Merger rates for NS-NS systems change by two orders of magnitude in various models ( Myr-1) and the standard model rate is about 50 merger events per Myr per Galaxy. As these systems experience two SN explosions, and the NS receive highest possible kicks (not lowered as in the case of BH), their rate depends very strongly on the assumed kick velocity distribution. The highest rates are found for smallest kick models (B1-5). Production of coalescing NS-NS binaries is greatly reduced by reducing CE efficiency (model E1), for the reasons described above (see the discussion of WD-NS merger rates). Also altering the distribution of the initial mass ratio (model M2) changes the rates significantly and leads to an enhanced production of NS-NS systems.
Finally, the merger rate of NS-BH systems stays at a rather constant level ( Myr-1), with most model rates of approximately 10 events per Myr per Galaxy. The rate is not so sensitive to the kick velocity as the merger rates of NS-NS systems, because NS-BH binaries receive at least one smaller kick (that imparted on the BH) and also NS-BH systems are more massive, so the kicks have smaller chance to disrupt them. The smallest merger rate is found for the model with the enhanced wind mass loss rate (model G2). Due to the high mass loss the stars do not form massive compact objects, and the number of BH formed (and systems harboring BH) is greatly reduced. The highest rate is achieved by the shift in NS maximal mass of model D2 to its lowest value adopted here, which enhances the rate of NS-BH and depletes the rate of NS-NS systems.
3.5. Redshift distribution
Standard Model The results of the population synthesis code can be combined with the cosmic star formation rate history to yield the rate of various types of GRB progenitors as a function of redshift. Star formation history at high redshift is not well known, however it is generally agreed that the star formation rate rises steeply up to . At higher redshifts the analysis of the Hubble Deep Field (Madau et al. 1996) provided lower limits on the rate, yet these limits decrease with increasing redshift. On the other hand Rowan-Robinson (1999) argues that the star formation does not decrease and remains roughly at the same level above . We consider two cases: a star formation function falling down steeply above (the thin line in Figure 5), and a case of strong star formation continuing up to (the thick line in Figure 5). We adopt a flat cosmology model with density parameter of matter , density parameter of cosmological constant and for Hubble constant .
For a given type of the GRB progenitor we can calculate the number of events up to the redshift per unit of observed time:
| (11) |
where is the effective distance , and is the speed of light. is the rate of a given type of event at the redshift of :
| (12) |
where is the dynamical time, , is the probability density of a merger of a given type as a function of time since formation of the system, and is the mass fraction of the binaries in the entire stellar population (single and binary) of mass range [0.08–100 ] that can lead to formation of GRB progenitors of type . is the cosmic star-formation rate at a time or a corresponding redshift . We obtain the probability density numerically for each type of a merger using the population synthesis code. In calculation of we take into account both, the evolutionary time delay (from formation of the system until two components form stellar remnants) and the merger time delay (the time needed for two stellar remnants to merge due to gravitational wave emission).
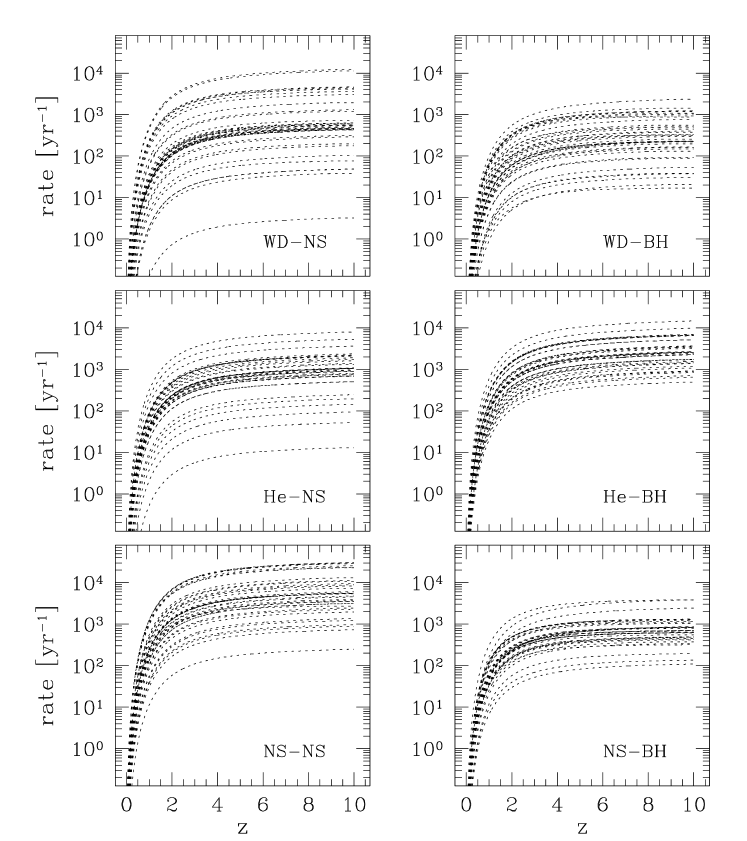
The redshift dependence of GRB progenitor rate is presented for our standard model and for the two adopted star formation rate histories in Figure 6. For any given the GRB progenitor merger rates are the highest for NS-NS binaries, than for He-BH and He-NS mergers, which are closely followed by the NS-BH systems. We find the lowest rates for mergers of WD-NS and WD-BH binaries.
The shape of the star formation rate determines the shape of the GRB progenitor rate redshift distribution. For the Rowan-Robinson (1999) SFR, progenitors are expected even at very high redshifts (), while for the SFR of Madau et al. (1996) we do not expect to produce any GRBs from binary mergers over . However, GRBs are observed at high redshifts. The highest spectroscopic redshift was measured for GRB 000131 (Andersen et al. 2000), while Fruchter et al. (1999) estimated photometrically the redshift of GRB 980329 to be (although following Bloom et al. 2001, in the Table 4 we list for this burst a more moderate estimate of ). Therefore, if we assume that GRBs originate in binary progenitors our results argue against the SFR drawn along the lower limits of Madau et al. (1996), while GRBs observed at high redshifts are in agreement with our results based on SFR of Rowan-Robinson (1999).
The curves in Figure 6 can be compared with the BATSE gamma-ray burst detection rate corrected for BATSE sky exposure, which is events per year. Only the rate of NS-NS and He-BH mergers is significantly above the BATSE observed rate, if we count the merging events up to the highest GRBs observed redshifts of . The He-NS and NS-BH merging rates in our standard model are marginally consistent with the observed rate, and these only for the Rowan-Robinson (1999) SRF model. Within the standard population synthesis model progenitors with WD merge at considerably lower rates than that expected for GRB progenitors. The predicted cumulative rates presented in Figure 6 will decrease if we account for collimation and thus restricted visibility of gamma-ray bursts. Since GRBs are thought to be collimated (Harrison et al. 1999; Stanek et al. 1999; Kuulkers et al. 2000; Panaitescu & Kumar 2001) this puts further limits on the binary progenitors. If any degree of collimation is taken into account, we may also argue against NS-BH and He-NS mergers besides WD-NS and WD-BH binaries as the sole progenitors of GRBs. Moreover, for most frequent NS-NS and He-BH mergers it would be difficult to reproduce the observed GRB rate with any significant degree of GRB collimation. The total rate of all binary mergers is per year (up to ), and the collimation which would reduce this number to the observed BATSE rate would be (the outflow half-opening angle). Of course, if any single binary merger model was to reproduce the observed rate, the required collimation would be much smaller (i.e., much bigger).
Parameter Study The redshift dependence of GRB cosmic rate is presented for all the different evolutionary models listed in Table 2 and for Rowan-Robinson (1999) SFR in Figure 7. For each progenitor type, we see that there are models which fail to reproduce and at the same time there are always models which exceed, sometimes significantly, the observed rate. Moreover the rates for most of progenitors are very sensitive to the assumed evolutionary model. Therefore, due to the population synthesis uncertainties, we are not able to confirm or reject any binary GRB progenitors just purely on the basis of their rates. A similar note of caution should be added to any conclusions about GRB collimation based on the population synthesis results (e.g. Lipunov et al. 1995, Portegies-Zwart and Yungelson 1998). The intrinsic spread in the rates when considering different population synthesis models is up to two orders of magnitude which corresponds to a factor of ten in the estimates for collimation.
3.6. Distribution around host galaxies
Standard Model In the standard model (model A) we have evolved initial binaries and 4577 WD-NS, 2369 WD-BH, 9656 He-NS, 23494 He-BH, 52599 NS-NS and 8105 NS-BH coalescing systems formed. Next, we distributed the systems in a galactic disk and assigned galactic velocities and propagated until the merger times as described in § 2.2. Besides the GRB progenitor systems, for each galaxy mass we also propagated a number of coalescing WD-WD binaries, to trace the galactic distribution of stars.
We show the results of the propagation calculations in Figures 8, 9, 10. In each figure we show the cumulative distributions of the projected distances of a given type merger. The projected distance is the distance in the direction perpendicular to the line of sight and we have averaged over all possible orientations of the host galaxy. In each figure, we also show, with a dashed line, the initial stellar distribution within a galaxy of a given mass. Note the different cut off radius () of the initial distribution at , , and kpc for the four galaxy masses defined in § 2.2.
The case of NS-BH mergers is shown in Figure 8. The mergers spread out with decreasing mass of the galaxy and even in the case of a large galaxy a significant number of NS-BH mergers takes place outside of the host. For a massive galaxy () 20% of NS-BH mergers will take place outside the disk of the host, and as much as 70% will escape hosts of small mass (). This is due to the kicks that lead to velocities above the host escape velocity and relatively long lifetimes of NS-BH binaries.
Mergers of WD-BH binaries take place within massive hosts while a significant fraction escapes from low mass galaxies (see Figure 9). For galaxy masses almost all WD-BH system mergers trace their initial distribution. For galaxy masses of , 15% and 35% WD-BH mergers take place outside of hosts, respectively. These systems receive at most one kick during the evolution, and the gain of the velocity is not large enough for these binaries to escape from the potential well of a massive galaxy. On the other hand, WD-BH systems have rather long lifetimes, and if the potential well is not deep enough to keep them inside the galaxy, they escape and merge far away from the galaxies, as in the case of small mass hosts.
Lighter WD-NS systems tend to merge within host galaxies, with only a slight dependence on the host mass (see Figure 10). For massive galaxies, all their mergers take place close to the places they were born, while for smallest galaxies up to 10% merge outside but close to the host outer regions. Since they are lighter than the WD-BH systems, and on average they receive higher kicks, one could expect that their mergers should be spread out more than these of WD-BH binaries. The distribution of the merger sites for a given mass galaxy is in general the result of two competing effects; (i) the magnitude of kicks the systems of a given type receive and (ii) the systems characteristic lifetimes. These two effects are not independent; the binary lifetimes become smaller with stronger kicks because then only the tight, strongly bound systems survive. As it turns out, for WD-NS systems the short lifetime effect dominates over the velocity effect, and although they receive higher kicks they do not have enough time to travel outside the host before the merger takes place.
Locations of He-NS and He-BH merger sites follow closely the initial distribution of their birth places, independently of the host galaxy mass (see Figure 10). This is primarily due to their very short lifetimes but also to their small systemic velocity gain. Both, He-NS and He-BH systems have the shortest lifetimes of all the potential GRB progenitors studied here (see Table 1). Their mergers take place even before the secondary finishes its nuclear evolution (i.e., before it forms a remnant) in the CE phase, when the secondary evolves off the main sequence and expands to giant size. For all the other progenitor types, both stars have to first form the stellar remnants, and then usually considerable time is needed for gravitational radiation to bring the two remnants together to a final merger. Also He-NS and He-BH systems are relatively heavy, so the one kick the system experiences, does not have a great effect on the systemic velocity.
Distribution of the projected distances of NS-NS merger sites follows very closely the initial distribution of primordial binaries (see Figure 10). Only 2% of NS-NS stars merge outside a massive host, and as little as 8% escape and merge outside of the lightest dwarf galaxies. These systems receive two kicks, however due to their very short merger times of the order Myr (see Belczynski et al. 2001b for a discussion of the merger time distribution) they predominantly merge within even the smallest hosts. The NS-NS merger site distribution is quite similar to that of WD-NS systems. However, for NS-NS merger distribution there is a tail extending to large distances from the host for small mass galaxies. This tail is due, to these systems which were formed along classical channels. These NS-NS have much longer merger times (typically Gyr) than the rest of systems formed through one of the newly recognized pathways. The small contribution of these systems to the entire population of coalescing NS-NS binaries does not change the overall tendency of NS-NS to merge within even the lowest mass hosts.
Parameter Study To study the dependence of our results on the assumed evolutionary parameters and initial distributions, we have calculated distributions of GRB progenitor merger sites for all models listed in Table 2. For all our models, and for all simulated galaxy masses, He-NS and He-BH mergers follow the initial distribution of initial binaries, and merge within their host galaxies. For all other systems, the results of our calculations are presented in Figure 11, 12, for two extreme host galaxy masses of and .
The distribution of merger sites of WD-NS systems is rather independent of the model parameters and these systems merge mainly within host galaxies, irrespective of the host mass. Most of the models are concentrated around the standard model distribution. Just in a few models more than 10-15% of WD-NS mergers take place outside of the smallest hosts. The two most extreme cases were identified in Figure 11 and they correspond to models N and F2. Model N represents nonphysical case of stellar evolution (and shall be treated as such), in which no helium giant radial evolution is allowed. This model was calculated just for comparison with previous results which did not take in to account this effect. Model F2, represents evolution in which every mass transfer episode (except CE phase) is treated conservatively, i.e., all material lost from the donor is accreted by the companion (). The effect of such a treatment, as compared to our standard evolution where half of the material is lost form the system, is that post-MT systems have wider separations, since no material and thus no angular momentum is lost from the binary. Naturally, the final WD-NS binaries are wider as well, and have longer merger times, which allow some systems to escape from host galaxies. Such a model is rather extreme, as we know that during MT events material is lost from at least some systems (e.g., Meurs & van den Heuvel 1989).
Distributions for WD-BH merger sites show quite significant spread, allowing the possibility that majority of these systems merge outside the low-mass hosts. Although for massive hosts, most of the models show that these systems merge within the host boundary, for low mass galaxies as much as 40%, or even more merge outside the hosts. Two most extreme cases are these for models designated as E3 and L1. For both models, the systems formed after CE or a MT phase are wider than for our standard evolutionary scenario. Therefore, it is natural that WD-BH binaries have longer merger times and have greater chances of escaping the hosts. As we double the CE efficiency to ) in model E3, during the CE phase binaries use much less of their orbital energy to expel the common envelope. Due to this smaller energy loss post-CE binaries are left with wider orbital separations than they would have for of our standard model. Decreased to half of its value the angular momentum loss, of model L1, directly influences the separations of post-MT systems. And although, in this model some material is lost from the systems during MT, unlike for model F2 discussed above, the angular momentum loss is much decreased, so binaries are much wider than for our standard model ().
Mergers of NS-NS predominantly take place inside host galaxies. For massive host, all models follow very closely the initial distribution binaries, and depending on the model 95% or more of mergers take place within massive hosts. For lowest mass galaxies, all but two models, give 90% or more mergers within a host boundary of 2 kpc. Models E3 and F2 stand out, but still even for these two, more than 80% of NS-NS mergers happen within the smallest mass hosts. In the above, we haven’t taken into account model N, marked in Figure 12 with a dot long dashed line. As mentioned before, this is an nonphysical model, and is shown here just for comparison with previous results. In agreement with previous calculations (e.g., Belczynski et al. 2000) for the case of massive galaxy, in model N about 30–50% of NS-NS stars merge outside host, or further away from host than 10–20 kpc. For lowest mass galaxies, in model N, as many as 70% of NS-NS mergers take place outside hosts, or a few kpc from the center of the hosts. Detailed discussion of this significant change of results for NS-NS is presented in Belczynski et al. (2001a).
Distribution of NS-BH merger sites around host galaxies is quite sensitive to the model parameters. Although for the case of propagation in the potential of a very massive galaxy at least 70% of these systems merge within hosts, majority of these mergers takes place far away from low-mass hosts. The curves corresponding to models D1 and D2 clearly differ from all the remaining distributions. Since these two models, have lower maximum NS mass (), many objects classified in the standard model () as NS-NS are included as NS-BH in the distributions of models D1 and D2. These is the reason why the NS-BH distributions in models D1 and D2 resemble the standard model NS-NS distribution. If in fact, the maximum neutron star mass is much lower than our assumed , most of the NS-BH are expected to merge within even small galaxies, with only the heaviest binaries escaping their hosts.
3.7. Comparison of the merger sites with GRB observations
The discovery of gamma-ray burst afterglows by the Beppo SAX satellite have lead to the identification of GRB host galaxies, and to the localization of GRB events with respect to these galaxies. In Table 4 we list the data on GRB positions around host centers. Most of these are taken from Bloom et al. (2001), and we have added the entries for three recent bursts.
From Table 4 we see that GRBs take place not far from the centers of their host galaxies. For some bursts, GRB970508, GRB000418 and GRB010222, the offsets are very small, and positions of the optical afterglows are coincident with host centers. Moreover, the host galaxies are typically small, irregular, with intense star formation (e.g., Fruchter et al. 1999; Holland 2001; Ostlin et al. 2001; Bloom et al. 2001). One has to note that the data presented in Table 4 describes only the long GRBs since only for these bursts afterglows have been observed so far.
Comparing the theoretical distributions like these calculated above with observations is a difficult task. Ideally one would like to compute the theoretical distribution of angular offsets between the GRB and its nearest galaxy, taking into account the fact that the nearest galaxy may not necessarily be the host galaxy. Such a calculation would require a number of assumptions, about the evolution of galaxies with redshift, about the rate of star formation in galaxies, and about the mass and size distribution of galaxies as a function of redshift. Each of these quantities is uncertain by itself. Thus a calculation like that in our current knowledge of the evolution of galaxies would depend on a number of uncertain assumptions and thus could lead to very uncertain results. However, results of calculations, which take into account some of the listed above effects, were independently obtained and presented by Perna & Belczynski (2001). Here we adopt a more straightforward approach. We assume a cosmological model with km s-1 Mpc-1, , and , and calculate the physical distance to the galaxy claimed to be the host galaxy. We then use the Kolmogorov-Smirnov test (e.g., Press et al. 1992) to verify the hypothesis that the observed distribution of offsets has been drawn from the distribution of offsets for a given type of GRB progenitor around a galaxy of a given mass. In each case we repeat such calculation for a number of population synthesis models listed in Table 2 to assess the range of systematic errors introduced by the population synthesis.
We present the results of these calculations in Table 5. For each progenitor type we list the Kolmogorov-Smirnov test probabilities in case of the four galaxy masses defined in § 2.2. We also list the highest and the lowest probability obtained when different models (with the exception of nonphysical model N) of population synthesis were used. Table 5 allows to evaluate the viability of each type of the GRB progenitor.
Let us assume in this discussion that we reject a given hypothesis if the KS test probability is below 1%. One thing becomes immediately clear from Table 5, i.e. GRB progenitors do not reside in large galaxies like the Milky Way. GRB afterglows are related to small galaxies with the masses around (). This has been noted by the observers claiming that the typical host galaxy mass will lie in the range of (e.g., Ostlin et al. 2001, Bloom et al. 2001). It has to be noted that for each type of progenitor the value of the Kolmogorov-Smirnov test probabilities is a strong function of the model galaxy used.
Double neutron star mergers are an acceptable choice and in the case of a low mass galaxy , the probability that the observed offset distribution is the same as the theoretical one is very high. Thus inclusion of the additional formation channels for this type of binaries has a significant effect (e.g., this possibility was rejected by Bloom et al. 2001). The range of probabilities covered by several different models of population synthesis is small. In our models the population of NS-NS mergers is dominated by short lived systems. Only in the case of a very low mass galaxy , do the kick velocities play a role. Here the lowest KS test probability corresponds to the model B1 with very small kick velocities B1. Since, for the smallest kicks, NS-NS binaries form in wider orbits and with longer lifetimes (e.g., Kalogera 1996) they have more time to escape from their host galaxies.
The Kolmogorov-Smirnov test results presented in Table 5 show that we can certainly reject NS-BH mergers as GRB progenitors. The highest probability is obtained for the case of a mass galaxy, but its value is still not acceptable. This is due to the fact that these binaries are rather long lived (see Table 1), therefore NS-BH can escape from host galaxies and merge far away from host centers. KS test probabilities rise to acceptable values in models D1 and D2, where the maximum mass of a neutron star is lower. In such models a number of binaries classified typically as double neutron stars contribute to the NS-BH population.
The values of the probabilities for the mergers involving white dwarfs (WD-NS and WD-BH) are large and make these models acceptable. In the case of WD-BH mergers the probability even rises to 0.94 for the case of a very small mass galaxy, however this number is rather uncertain due to the very wide range of K-S probabilities obtained for different population synthesis models. These uncertainties are not that large in the case of and larger galaxies.
Similarly we can not reject the He-BH and He-NS mergers. In these cases the probabilities are not as large as in the case of WD mergers, however these groups also constitutes a viable GRB progenitor. One should note that the systematic errors due to different population synthesis models are very small in this case, and the main factor that influences the value of the KS test probability is the distribution of stars in a model galaxy. He-BH and He-NS mergers evolve on very short timescales and therefore take place in star forming regions.
3.8. Comparison with other studies
Merger Rates A comparison of our merger rates of NS-NS and NS-BH binaries with a number of other studies has been discussed in detail by Belczynski et al. (2000b). In short, our rates are in good agreement with previous theoretical predictions. Although we have noted some significant differences, we attributed them to the more approximate treatment of stellar and binary evolution in earlier studies and to our recognition of new NS-NS populations. Recognition which was based on the assumption that CE phases initiated by evolved low-mass helium stars do not always lead to binary component mergers.
Merger rates for several other binary GRB candidates have been so far presented only by Fryer et al. (1999a). We are not able to directly compare the rates because Fryer et al. (1999a) did not define the masses of WD selected to enter the WD-BH GRB progenitor candidate group. We encountered a similar problem in the case of He-BH mergers, for which the masses of He cores are not given. However, if we assume that their systems correspond to our definition of GRB binary candidates, then we note a very close resemblance of the He-BH the rates, and a rather good agreement of WD-BH rates. Fryer et al. (1999a) found their rates of Myr-1 for WD-BH and Myr-1 for He-BH for their standard evolutionary model. In our models closely resembling the Fryer et al. (1999a) standard model, in particular these with smaller binary fraction (K1) and higher kicks (B9-12), we predict WD-BH rates of Myr-1 and He-BH rates of Myr-1.
Host Merger Site Distributions We may compare our results to those of Bloom et al. (1999), Bulik et al. (1999), Fryer et al. (1999a), and Belczynski et al. (2000). These authors calculated distributions of NS-NS and NS-BH mergers around different mass galaxies. The main conclusion of these studies was that a significant fraction (up to 40% for massive hosts, and up to 80% for low mass hosts) of NS-NS and NS-BH binaries merge outside of host galaxies. For NS-BH binaries we find very good agreement with previous studies, as we find that up to 25% and 80% of these binaries will merge outside a massive and low mass host (see Figure 12). Although our calculations show bigger concentration of NS-BH mergers in massive hosts, it is explained by the fact that we have adopted decreased kicks for BH, and therefore systemic velocity gain is decreased as well. However, our conclusions for NS-NS mergers are very different from all previous studies, due to the newly recognized short lived populations of these binaries, as discussed throughout this work.
Both Fryer et al. (1999a) and Bloom et al. (2001) assumed that He-BH mergers will take place in the star formation regions of the host galaxies. With our calculations we may confirm that, in fact, He-BH and He-NS merger sites, follow exactly star formation regions in their host galaxies.
Fryer et al. (1999a) argued that WD-BH merger sites are also concentrated within host galaxies, a conclusion that was later adopted by Bloom et al. (2001). Our detailed calculations show that, in fact, for massive galaxies these systems follow closely the initial primordial binary distribution, and merge within hosts. However, for small mass galaxies, a significant fraction of WD-BH binaries merge outside of hosts. Depending on the assumed evolutionary model as many as 50% of these systems may merge outside of small mass hosts (see Figure 11) as discussed in § 3.6. Fryer et al. (1999a) argued that as these systems have very short merger times of Myr, and they will not have enough time to escape from hosts. We find that the merger times of these systems are indeed of order of Myr (see Table 1). Nevertheless, the actual calculations of WD-BH trajectories prove that this conclusion is not valid for small mass and size hosts ().
4. Discussion and conclusions
We have presented calculation of rates and spatial distributions around host galaxies of several binary merger events, which were proposed as possible GRB progenitors. We have used the StarTrack population synthesis code in our calculations.
We have found that the rates are very sensitive to the assumed set of stellar evolutionary parameters. Using the rates alone we were not able to exclude any of the proposed binaries as GRB progenitors, since the highest rates obtained were always higher than observed BATSE GRB rate for any type of a binary. In the framework of the standard population synthesis model (model A) we find that the total rate of all the proposed binary events is roughly ten times larger than the observed GRB rate. However, we find that the spread in the rates due to uncertainties in population synthesis is large, and in some cases exceeds a factor of . This corresponds to the uncertainty in the estimate of the collimation of a factor of ten. On the other hand we note that our standard model (model A) leads to an expected collimation half–opening angle of . The measured collimation angles are somewhat smaller than this value, typically a few degrees (Panaitescu & Kumar 2001). Estimates of the GRB rates or collimation based on population synthesis alone carry large systematic errors.
Distributions of binary system merger sites around galaxies may be compared to the locations of GRB optical afterglows with respect to the galaxies identified as their hosts. Most of GRBs take place inside or close to the host galaxies (e.g., Bloom et al. 2001). Observed GRB hosts are small-mass galaxies, often thought to be going through vigorous star formation phase.
There are no reliable GRB host mass estimates, and thus we have calculated models for a range of galaxy masses. Our standard model calculations were repeated for a number of different evolutionary models to assess the robustness of our results. We have found that the NS-BH mergers take place mainly outside of their host galaxies, and thus are inconsistent with the observed locations of GRBs around hosts. Some WD-BH binaries may merge outside the star formation regions of their host galaxies. However, the distribution of the WD-BH merger sites around their host galaxies is consistent with the observed distribution of GRB offsets from the centers of galaxies. Thus one can not reject the WD-BH mergers purely on the basis of comparison with the observed offsets. However, if one additionally requires that the mergers should take place in the proximity of star forming regions in galaxies then the WD-BH mergers can be rejected as potential GRB candidates. Merger sites of WD-NS, He-NS, He-BH, and NS-NS trace the star formation regions of the hosts, for all the cases of the host mass and size considered here, and independently of the adopted population synthesis model. We conclude that these types of binaries may be responsible at least for a part of observed GRBs.
GRBs form a very nonuniform group of events, with different outburst times, very different light curves and observed energies. Thus, there is a possibility that GRBs originate in more than one type of progenitor. Locations of GRBs with respect to host galaxies has so far been measured only for long GRBs. There is a growing evidence that these GRBs are related to collapsing massive stars: collapsars. However, our results show that several types of binary system progenitors cannot be rejected purely on the basis of their merger site distribution. Additionally, if binaries were responsible for only a part of the observed GRBs, we also can not exclude them purely on the basis of their expected coalescence rates.
Because of the expected short duration times, NS-NS and NS-BH mergers are the primary candidates as short burst progenitors. These two populations exhibit very different distributions of merger sites. Mergers of NS-NS systems take place predominantly within hosts, to the contrary of what was so far believed, provided that CE phases initiated by low-mass helium stars do not always lead to binary component mergers, assumption which yet have to be tested by detailed hydrodynamical calculations. On the other hand, a significant fraction of NS-BH systems merge outside of their host galaxies. At some point in the future afterglows from short GRBs will be observed and their locations with respect to host galaxies will be measured, and then such calculations may provide a useful tool to distinguish between these two progenitor models (Perna & Belczynski 2001). Future and current space missions like HETE-II, INTEGRAL, GLAST or SWIFT will hopefully measure precise positions of a large number of bursts even of the short duration and settle down the issue of GRB progenitors.
References
- (1)
- (2) Abt, H. A. 1983, ARA&A, 21, 343
- (3)
- (4) Andersen, M. I. et al. 2000, A&A, 364, L54
- (5)
- (6) Belczynski, K., & Bulik, T. 1999, A&A, 346, 91
- (7)
- (8) Belczynski, K., Bulik, T, & Zbijewski, W. 2000, A&A, 355, 479
- (9)
- (10) Belczynski, K., & Kalogera, V. 2001, ApJ, 550, L183
- (11)
- (12) Belczynski, K., Bulik, T, & Kalogera, V. 2001a, ApJ, submitted [astro-ph/0111452]
- (13)
- (14) Belczynski, K., Kalogera, V., & Bulik, T. 2001b, in preparation
- (15)
- (16) Berger, E., Kulkarni, S. R., & Frail, D. A. 2001, ApJ, submitted [astro-ph/0105081]
- (17)
- (18) Bethe, H., & Brown, G. E. 1998, ApJ, 506, 780
- (19)
- (20) Bhattacharya, D., & van den Heuvel, E. P. J. 1991, Phys. Rep., 203, 1
- (21)
- (22) Blaes, O., & Rajagopal, M. 1991, ApJ, 381, 210
- (23)
- (24) Bloom, J.S., Kulkarni, S.R., & Djorgovski, S.G. 2001, ApJ, accepted [astro-ph/0010176]
- (25)
- (26) Bloom, J. S., Sigurdsson, S., & Pols, O. R. 1999, MNRAS, 305, 763
- (27)
- (28) Bottcher, M., & Fryer, C. L. 2001, ApJ, 547, 338
- (29)
- (30) Brown, G.E. 1995, ApJ, 440, 270
- (31)
- (32) Brown, G. E., Lee, C. H., Wijers, R. A. M. J., Lee, H. K., Israelian, G., & Bethe, H. A. 2000, New Astronomy, 5, 191
- (33)
- (34) Bulik, T., Belczynski, K., & Zbijewski, W. 1999, MNRAS, 309, 629
- (35)
- (36) Cappellaro, E., Evans, R., & Turatto, M. 1999, A&A, 351, 459
- (37)
- (38) Chevalier, R. A. 2000, in ‘ Gamma-ray Bursts, 5th Huntsville Symposium”, eds., R. M. Kippen et al., AIP Conference Series, 526, 608
- (39)
- (40) Cordes, J., & Chernoff, D.F. 1998, ApJ, 505, 315
- (41)
- (42) Costa E., et al. 1997, IAU Circ. 6576, 1
- (43)
- (44) Dewi, J. D. M., & Tauris, T. M. 2000, A&A, 360, 1043
- (45)
- (46) Duquennoy, A., & Mayor, M. 1991, A&A, 248, 485
- (47)
- (48) Fruchter, A., Burud, I., Rhoads, J., & Levan, A. 2001, GCN GRB Obesrvation Report No.1087 [http://gcn.gsfc.nasa.gov/gcn/gcn3]
- (49)
- (50) Fruchter, A. et al. 1999, ApJ, 519, L13
- (51)
- (52) Fryer, C. L., Holz, D. E., & Hughes, S. A. 2001, ApJ, accepted [astro-ph/0106113]
- (53)
- (54) Fryer, C. L., & Woosley, S. E. 1998, ApJ, 502, L9
- (55)
- (56) Fryer, C. L., Woosley, S. E., & Hartmann, D. H. 1999a, ApJ, 526, 152
- (57)
- (58) Fryer, C. L., Woosley, S. E., Herant, M., & Davies, M. B. 1999b, ApJ, 520, 650
- (59)
- (60) Fynbo, J. P. U., et al. 2001, GCN GRB Obesrvation Report No.871 [http://gcn.gsfc.nasa.gov/gcn/gcn3]
- (61)
- (62) Gilmore, G. 2001, to appear in ‘Galaxy Disks and Disk Galaxies”, eds. J.G. Funes & E.M. Corsini (San Francisco: ASP)
- (63)
- (64) Graziani, C., Lamb, D. Q., & Marion, G. H. 1999, A&AS, 138, 469
- (65)
- (66) Groot P. J., et al. 1997a, IAU Circ. 6588, 1
- (67)
- (68) Groot P. J., et al. 1997b, IAU Circ. 6584, 1
- (69)
- (70) Hamann, W. R., Koesterke, L., & Wessolowski, U. 1995, A&A, 299, 151
- (71)
- (72) Harrison, F. A., et al. 1999, ApJ, 523, L121
- (73)
- (74) Hartman, J. W. 1997, A&A, 322, 127
- (75)
- (76) Holland, S. 2001, to appear in the Proceedings of the 20th Texas Symposium on Relativistic Astrophysics, [astro-ph/0102413]
- (77)
- (78) Hurley, J. R., Pols, O. R., & Tout, C. A. 2000, MNRAS, 315, 543
- (79)
- (80) Jha, S. et al. 2001, ApJ, 554, L155
- (81)
- (82) Kalogera, V. 1996, ApJ, 471, 352
- (83)
- (84) Kalogera, V., & Baym, G.A. 1996, ApJ, 470, L61
- (85)
- (86) Kluzniak, W., & Lee, W. H. 1998, ApJ, 494, L53
- (87)
- (88) Kudritzki, R. P., & Reimers, D. 1978, A&A, 70, 227
- (89)
- (90) Kudritzki, R. P., Pauldarch, A., Puls, J., & Abbot, D. C. 1989, A&A, 219, 205
- (91)
- (92) Kuulkers, E., et al. 2000, ApJ, 538, 638
- (93)
- (94) Lee, W. H., & Kluzniak, W. 1995, Acta Astronomica, 45, 705
- (95)
- (96) Lipunov, V. M., Postnov, K. A., & Prokhorov, M. E. 1997, MNRAS, 288, 245
- (97)
- (98) Lipunov, V. M., Postnov, K. A., Prokhorov, M. E., & Panchenko, I. E. 1995, ApJ, 454, 593
- (99)
- (100) MacFadyen, A., & Woosley, S. E. 1999, ApJ, 524, 262
- (101)
- (102) Madau, P., Ferguson , H. C., Dickinson, M. E., Giavalisco, M., Steidel, C. C., & Fruchter, A. 1996, MNRAS, 283, 1388
- (103)
- (104) Meszaros, P. 2000, Nuclear Phys. B, 80, 63
- (105)
- (106) Meszaros, P., & Rees, M. J. 1997, ApJ, 476, 232
- (107)
- (108) Meurs, E. J. A., & van den Heuvel, E. P. J. 1989, A&A, 226, 88
- (109)
- (110) Miyamoto, M., & Nagai, R. 1975, PASJ, 27, 533
- (111)
- (112) Nieuwenhuijzen, H., & de Jager, C. 1990, A&A, 231, 134
- (113)
- (114) Ostlin, G., Amram, P., Bergvall, N., Masegosa, J., Boulesteix, J., & Marquez, I. 2001, A&A, 374, 800
- (115)
- (116) Paciesas, W. et al., 1999, ApJS, 122, 465
- (117)
- (118) Paczynski, B. 1990, ApJ, 348, 485
- (119)
- (120) Paczynski, B. 1998, ApJ, 494, L45
- (121)
- (122) Paczynski, B. 1999, to appear in ‘The Largest Explosions Since the Big Bang: Supernovae and Gamma Ray Bursts”, eds., M. Livio, K. Sahu, & N. Panagia, Cambridge, Cambridge University Press [astro-ph/9909048]
- (123)
- (124) Panaitescu, A., & Kumar, P. 2001, ApJ, 554, 667
- (125)
- (126) Perna, R., & Belczynski, K. 2001, ApJ, submitted
- (127)
- (128) Podsiadlowski, P., Joss, P.C., & Hsu, J.J.L. 1992, ApJ, 391, 246
- (129)
- (130) Portegies-Zwart, S. F., & Yungelson, L. R. 1998, A&A, 332, 173
- (131)
- (132) Press, W. H., Teukolsky, S. A., Vetterling, W. T., & Flannery, B. P. 1992, “Numerical Recipes in C”, Second Edition, Cambridge University Press
- (133)
- (134) Rowan-Robinson, M. 1999, Ap&SS, 266, 291
- (135)
- (136) Ruffert, M., Janka, , H., Takahashi, K., & Schaefer, G. 1997, A&A, 319, 122
- (137)
- (138) Scalo, J. M. 1986, Fundam. Cosmic Phys., 11, 1
- (139)
- (140) Stanek, K. Z., Garnavich, P. M., Kaluzny, J., Pych, W., & Thompson, I. 1999, ApJ, 522, L39
- (141)
- (142) Vassiliadis, E., & Wood, P. R. 1993, ApJ, 413, 641
- (143)
- (144) Webbink, R. F. 1984, ApJ, 277, 355
- (145)
- (146) Woosley, S.E. 1986, in “Nucleosynthesis and Chemical Evolution”, 16th Saas-Fee Course, eds. B. Hauck et al., Geneva Obs., p. 1
- (147)
- (148) Woosley, S.E. 1993, ApJ, 405, 273
- (149)
- (150) Woosley, S. E. 2000, in “Gamma-ray Bursts, 5th Huntsville Symposium”, eds., R. M. Kippen et al., AIP Conference Series, 526, 555
- (151)
- (152) Zhang, W., & Fryer, C. L. 2001, ApJ, 550, 357
- (153)
| Type | aadistribution median of evolutionary time delay | bbdistribution median of merger time delay | ||
|---|---|---|---|---|
| WD-NS | 26.6 | 20.0–35.7 | 6.8 | 0.014–1238 |
| WD-BH | 25.6 | 20.1–34.6 | 96.9 | 16.1–1831 |
| He-NS | 10.0 | 7.04–11.1 | … | … |
| He-BH | 7.9 | 5.62–9.96 | … | … |
| NS-NS | 18.5 | 10.7–27.8 | 0.7 | 0.017–390 |
| NS-BH | 7.7 | 5.92–17.4 | 534.6 | 1.68–5170 |
| Model | Description |
|---|---|
| A | standard model described in § 2 |
| B1–13 | zero kicks, single Maxwellian with |
| km s-1, | |
| “Paczynski” kicks with km s-1 | |
| C | no hyper–critical accretion onto NS/BH in CEs |
| D1–2 | maximum NS mass: M⊙ |
| E1–3 | |
| F1–2 | mass fraction accreted: f |
| G1–2 | wind changed by |
| H | Convective Helium giants: |
| I | burst–like star formation history |
| J | primary mass: |
| K1–2 | binary fraction: |
| L1–2 | angular momentum of material lost in MT: |
| M1–2 | initial mass ratio distribution: |
| N | no helium giant radial evolution |
| O | partial fall back for |
| P1–2 | minimum Helium core mass in He-NS/BH mergers |
| R1–2 | minimum WD mass in WD-NS/BH mergers: |
| Modelaafor definition of models see Table 2 | WD-NS | WD-BH | He-NS | He-BH | NS-NS | NS-BH |
|---|---|---|---|---|---|---|
| A | 4.6 | 2.4 | 9.7 | 23.5 | 52.7 | 8.1 |
| B1 | 46.3 | 13.4 | 20.9 | 64.2 | 292.4 | 18.2 |
| B2 | 50.9 | 12.9 | 21.4 | 62.9 | 299.6 | 19.4 |
| B3 | 48.7 | 13.6 | 20.8 | 63.7 | 302.2 | 19.6 |
| B4 | 44.6 | 12.2 | 20.7 | 66.5 | 285.2 | 19.1 |
| B5 | 38.2 | 11.3 | 22.8 | 67.2 | 251.0 | 19.5 |
| B6 | 32.2 | 10.3 | 19.9 | 64.0 | 226.8 | 16.4 |
| B7 | 13.4 | 5.3 | 15.2 | 48.9 | 128.1 | 14.6 |
| B8 | 4.8 | 2.6 | 9.9 | 23.5 | 57.5 | 10.1 |
| B9 | 1.9 | 0.9 | 8.9 | 12.8 | 33.2 | 5.7 |
| B10 | 0.8 | 0.9 | 6.9 | 9.7 | 18.2 | 3.7 |
| B11 | 0.4 | 0.4 | 6.2 | 7.6 | 12.5 | 2.1 |
| B12 | 0.4 | 0.4 | 4.6 | 5.8 | 8.2 | 1.5 |
| B13 | 12.2 | 4.0 | 12.3 | 29.8 | 91.0 | 10.3 |
| C | 0.4 | 1.7 | 33.3 | 12.7 | 43.2 | 5.6 |
| D1 | 104.8 | 7.7 | 1.8 | 33.8 | 33.6 | 23.3 |
| D2 | 114.7 | 22.1 | 0.1 | 32.4 | 9.1 | 36.2 |
| E1 | 0.03 | 0.2 | 0.5 | 91.6 | 2.5 | 4.7 |
| E2 | 1.7 | 0.3 | 8.5 | 47.8 | 23.5 | 6.3 |
| E3 | 5.4 | 6.0 | 4.6 | 8.1 | 109.0 | 8.7 |
| F1 | 4.2 | 2.1 | 2.3 | 14.5 | 22.1 | 9.3 |
| F2 | 6.5 | 11.1 | 8.2 | 4.5 | 54.3 | 8.6 |
| G1 | 5.7 | 5.8 | 7.2 | 20.3 | 43.9 | 14.2 |
| G2 | 4.8 | 0.6 | 19.7 | 15.1 | 94.8 | 1.3 |
| H | 4.7 | 2.0 | 8.2 | 24.3 | 37.9 | 7.8 |
| I | 4.3 | 3.5 | 9.7 | 23.9 | 54.5 | 10.0 |
| J | 4.8 | 3.8 | 12.6 | 34.8 | 58.1 | 12.8 |
| K1 | 1.9 | 1.0 | 4.1 | 9.9 | 22.5 | 3.4 |
| K2 | 7.8 | 4.0 | 16.3 | 39.6 | 90.2 | 13.5 |
| L1 | 6.0 | 3.6 | 6.9 | 8.4 | 78.9 | 9.2 |
| L2 | 4.3 | 2.2 | 6.6 | 21.3 | 12.0 | 6.2 |
| M1 | 0.9 | 4.3 | 1.2 | 5.9 | 6.2 | 4.0 |
| M2 | 5.8 | 0.2 | 17.4 | 22.9 | 114.2 | 8.4 |
| N | 7.5 | 4.0 | 8.7 | 22.3 | 34.4 | 10.7 |
| O | 4.2 | 1.6 | 10.0 | 25.0 | 51.9 | 5.7 |
| P1 | 4.6 | 2.4 | 73.6 | 33.3 | 52.7 | 8.1 |
| P2 | 4.6 | 2.4 | 0.9 | 10.7 | 52.7 | 8.1 |
| R1 | 5.6 | 3.5 | 9.7 | 23.5 | 52.7 | 8.1 |
| R2 | 2.9 | 1.4 | 9.7 | 23.5 | 52.7 | 8.1 |
| GRB | redshift | Offset | RPROJECTED [kpc] | Comments |
|---|---|---|---|---|
| 970228 | 0.695 | ” | edge of host | |
| 970508 | 0.835 | ” | host center | |
| 970828 | 0.958 | ” | edge/outside | |
| 971214 | 3.418 | ” | inside host | |
| 980326 | ” | … | edge/outside? | |
| 980329 | ” | … | inside host | |
| 980425 | 0.008 | ” | inside host | |
| 980519 | … | ” | … | inside host |
| 980613 | 1.096 | ” | ??? | |
| 980703 | 0.966 | ” | inside host bbBerger et al. (2001) | |
| 981226 | … | ” | … | ??? |
| 990123 | 1.600 | ” | edge of host | |
| 990308 | … | ” | … | ??? |
| 990506 | 1.310 | ” | ??? | |
| 990510 | 1.619 | ” | edge of host | |
| 990705 | 0.840 | ” | inside host | |
| 990712 | 0.434 | ” | inside host | |
| 991208 | 0.706 | ” | edge? | |
| 991216 | 1.020 | ” | inside? | |
| 000301C | 2.030 | ” | inside? | |
| 000418 | 1.118 | ” | host center | |
| 000926 | 2.066 | ” | edge/inside ccFynbo et al. (2001) | |
| 010222 | 1.477 | ” | inside host ddJha et al. 2001; Fruchter et al. 2001 |
| Galaxy mass: | ||||
|---|---|---|---|---|
| WD-NS mergers | ||||
| Standard model | ||||
| maximal modelbbcorresponding models are given in parenthesis | (B7) | (B8) | (L1) | (F2) |
| minimal modelbbcorresponding models are given in parenthesis | (F2) | (F2) | (B12) | (B12) |
| WD-BH mergers | ||||
| Standard model | ||||
| maximal model | (B6) | (B2) | (E2) | (J) |
| minimal model | (E3) | (E3) | (G2) | (G2) |
| He-NS mergers | ||||
| Standard model | ||||
| maximal model | (B7) | (C) | (J) | (F1) |
| minimal model | (E3) | (F1) | (B6) | (B1) |
| He-BH mergers | ||||
| Standard model | ||||
| maximal model | (F1) | (G2) | (I) | (L2) |
| minimal model | (B1) | (B4) | (B7) | (B1) |
| NS-NS mergers | ||||
| Standard model | ||||
| maximal model | (B2) | (B1) | (M2) | (F2) |
| minimal model | (F2) | (F2) | (B1) | (B1) |
| NS-BH mergers | ||||
| Standard model | ||||
| maximal model | (D2) | (D2) | (D1) | (D1) |
| minimal model | (O) | (O) | (O) | (O) |