X-Ray Spectral Components of Starburst Galaxies
X-ray emission processes in starburst galaxies (SBGs) are assessed, with the aim of identifying and characterizing the main spectral components. Our survey of spectral properties, complemented with a model for the evolution of galactic stellar populations, leads to the prediction of a complex spectrum. Comparing the predicted spectral properties with current X-ray measurements of the nearby SBGs M82 and N253, we draw the following tentative conclusions: 1) X-ray binaries with accreting NS are the main contributors in the 2-15 keV band, and could be responsible for the yet uninterpreted hard component required to fit the observed 0.5-10 keV spectra of SBGs; 2) diffuse thermal plasma contributes at energies 1 keV; 3) nonthermal emission, from Compton scattering of FIR and CMB radiation field photons off supernova-accelerated relativistic electrons, and AGN-like emission, are likely be the dominant emission at energies 30 keV; 4) supernova remnants make a relatively minor contribution to the X-ray continuum but may contribute appreciably to the Fe-K emission at 6.7 keV.
Key Words.:
Galaxies: X-ray – Galaxies: spiral – Galaxies: star formation1 Introduction
In starburst galaxies (SBGs) enhanced star formation activity (lasting typically yr) drives a chain of coupled stellar and interstellar (IS) phenomena that are manifested as intense far-infrared (FIR) and X-ray emission. The SBG class is a heterogeneous group of galaxies that are selected based on optical, UV and FIR properties. Historically, optically selected galaxies, like HII galaxies, were first recognized to undergo a burst of star formation (Searle et al. 1973); the term ”starburst galaxy” was introduced by Weedman (1981; see also Balzano 1983). Subsequently, FIR-luminous galaxies were also recognized to be SBGs, a consequence of efficient heating of IS dust by the radiation from abundant massive stars (Soifer et al. 1986). Increased stellar activity leads also to a higher supernova (SN) rate, shock heating of IS gas, and a more efficient particle acceleration mechanism in SBGs compared to ‘normal’ spirals.
Interest in SBGs stems also from the realization that these resemble young galaxies in the earlier universe. Indeed, a SB phase was very common in the earlier universe, as the cosmic star formation rate (and hence the cosmic chemical enrichment) was substantially higher at epochs corresponding to (with the data being interpreted with the SFR having either a peak in the redshift range (Madau et al. 1996), or – due to small number statistics and dust correction effects – a plateau out to (Thompson et al. 2001). So, if the main properties of SBGs in the present universe resemble those of normal galaxies during the evolutionary phase at , the study of local SBGs may provide insight into processes that occurred at that earlier epoch.
A primary manifestation of the SB activity is X-ray emission. Given the greatly enhanced star formation rate, energetic phenomena related to the final stages of stellar evolution – X-ray binaries, supernova remnants (SNRs), galactic winds, and Compton scattering of ambient FIR photons off SN-accelerated relativistic electrons – clearly suggest that SBGs are typically more powerful X-ray emitters than normal galaxies. In fact, normalized to the 7000 Å flux (i.e., gauging activity by the old stellar population), in the X-ray band SBGs (as well as of other classes of active galaxies) are brighter than normal (spiral and elliptical) galaxies (Schmitt et al. 1997). The mean X-ray spectrum of SBGs is expected to reflect the diverse nature of high energy activity in SBGs.
The earliest attempt to determine a mean broad-band spectrum of SBGs (based on Einstein/IPC, HEAO1-A2, and HEAO1-A4 data for a sample of 51 FIR-selected putative SBGs) yielded some evidence that the (co-added) emission from SBGs was detectable beyond 10 keV even based on limited-quality survey data, and that the mean SBG spectrum was somewhat harder (photon spectrum index 1.5) than the mean AGN spectrum (Rephaeli et al. 1991, 1995). Individual spectral studies (based on data of limited spatial resolution) have shown the 0.5-10 keV spectra of SBGs to be complex: these are best-fit by one (or more) low-temperature ( keV) component(s) plus a harder component, the latter interpreted as being either thermal with keV or nonthermal with (M82, N253: Ptak et al. 1997, Cappi et al. 1999; M83: Okada et al. 1997; N2146: Della Ceca et al. 1999; N3256: Moran et al. 1999; N3310, N3690: Zezas et al. 1998). A purely thermal hard component would imply low chemical abundance (), whereas comparable contributions of thermal and nonthermal emissions would imply 111Solar abundances can also be recovered using different spectral models (Weaver et al. 2000). More generally, however, it should be emphasized that abundance determinations are difficult due to the uncertainties in the Fe-L atomic physics, because Fe-L lines couple with O and Ne-K lines upon which abundance determinations rely strongly (e.g., Matsushita et al. 2000).. The issue of whether the hard component is actually thermal with inferred high temperatures and strongly subsolar abundance, and whether it originates from genuinely hot diffuse gas or from unresolved point sources, is not settled yet (e.g.: Weaver et al. 2000, Dahlem et al. 2000). Furthermore, the spectrum of at least some SBGs may also include a substantial contribution from a compact nuclear source: see, e.g., the apparent temporal variability of the 2-10 keV flux found in ASCA and RXTE measurements of M82 (Tsuru et al. 1997, Ptak & Griffiths 1999, Rephaeli & Gruber 2001). More recently, for N253, Chandra data have resolved the regions where the soft thermal X-rays originate (Strickland et al. 2000), and XMM has separated the extended and point-like emission components in the disk and the nuclear region: the unresolved (diffuse?) emission is spatially and spectrally complex, with two warm plasma components in the disk and three (warm and hot) in the nucleus (Pietsch et al. 2001). For both N253 and M82, Chandra data have shown that the 2-10 keV flux is dominated by point-source emission (Strickland et al. 2000, Griffiths et al. 2000).
The main goal of this paper is an attempt to quantify the X-ray characteristics of the (stellar and non-stellar driven) modes of activities in SBGs, in order to identify basic spectral features that will help elucidate the nature of these galaxies. Starting from a realistic stellar population model for X-ray binaries and SNRs in our Galaxy, we account for all the viable stellar and gaseous X-ray emitting processes in a galactic environment, and describe the respective spectra in Section 2. In section 3 we construct a template for the composite X-ray spectrum of a galaxy; this is then compared (in Section 4) with measurements of the nearby SBGs M82 and N253. We conclude with a summary of our main findings (Section 5).
2 Galactic sites of X-ray emission
X-ray emission in galaxies is either directly related to stellar activity, or closely associated with it through SN and SN-driven gas heating and particle acceleration processes. X-ray emission processes that are associated with stellar activity can be modelled self-consistently based on our knowledge of the evolution of stellar populations. Specifically, assume that any spectral differences among the various components stem from differences in mass, mass ratio, and geometry of the system. If so, the birthrate function , the duration of the X-ray bright phase , the X-ray luminosity (in a given spectral band), and the profile of the emitted spectrum , will all be functions of the initial primary stellar mass , the initial separation , and the initial mass ratio (i.e., allowing for binary systems). The resulting X-ray spectrum is then
As it will be discussed in the following sections, high-luminosity and low-luminosity X-ray binaries differ mainly in the range of values, whereas SN of types Ia and II differ mainly in the range of values. X-ray binaries span a similar mass range as SN of both types, but have very different periods of X-ray bright phase, as well as different spectral emission profiles. Based on these considerations, our aim here is to provide a ‘handbook’ of the most relevant emission processes in SBGs, a convenient scheme for calculation of superposed spectra under various conditions that can be easily updated as new data become available. In this sense, the work reported here is a more detailed study of galactic X-ray emitting environments; as such, it is an extension of our previous work (Rephaeli et al. 1995), and more comprehensive than, e.g., the work of David et al. (1992) in which the respective role of various sources of emission in FIR-selected normal and SB galaxies was discussed on the energetic grounds alone.
In general, theoretical population synthesis models of SBs have been constructed based on the emission from individual stars (Mas-Hesse & Kunth 1991, Leitherer & Heckman 1995, Meynet 1995), and also binary systems (Vanbeveren et al. 1997, Schaerer & Vacca 1998, Vanbeveren et al. 1998, Van Bever & Vanbeveren 1998, Van Bever et al. 1999, Mas-Hesse & Cerviño 1999).
In particular, syntheses of X-ray emitting stellar populations in SBs have already been performed in recent years. Mas-Hesse et al. (1996), who used evolutionary models by Mas-Hesse & Kunth (1991) and Cerviño & Mas-Hesse (1994), computed the multiwavelength energy distribution for two SBGs, including X-ray emission from massive O stars, HMXBs, and SNRs. Lipunov et al. (1996a) studied the temporal evolution of the HMXB binary population in a SB on a timescale of yr, and concluded that the statistics of X-ray binaries depend very much on the SB age. Van Bever & Vanbeveren (2000), combining a close-binary population-number synthesis code with mechanisms of X-ray emission in young SNRs and HMXBs, studied the temporal evolution of the X-ray luminosity of SBs noting the importance of interacting binaries in the evolution and X-ray emission of SBs.
The main difference between the work reported here and previous works is in their respective scopes: ours is a detailed discussion of a synthetic X-ray spectrum of SBGs. Other differences concern: (i) the neglect, in earlier works, of the contributions of LMXBs, galactic winds, and Comptonized emission to the X-ray luminosity of SBs; (ii) the shapes of the X-ray spectra assumed for the various classes of sources; and (iii) the steady state SB considered in this work versus the evolving SBs investigated by others 222As for the populations of X-ray binaries observed in external galaxies (see Fabbiano 1995, and Roberts & Warwick 2000), a birth-death model (Wu 2001) can calculate their luminosity functions: by modelling the star formation history, i.e. by assuming a bursting (or continual) formation process, the model can reproduce the presence (or absence) and location of the luminosity break in the binaries’ log-log curves. (e.g., Lipunov et al. 1996a; Van Bever & Vanbeveren 2000).
Similarities to previous work mainly concern the overall physics underlying the assumed population-number synthesis models for massive stars with realistic frequencies of massive close binaries. Several such models exist (Dewey & Cordes 1987; Meurs & van den Heuvel 1989; Pols et al. 1991; Pols & Marinus 1994; Tutukov et al. 1992; Iben et al. 1995a, 1995b; Dalton & Sarazin 1995a, 1995b; Lipunov et al. 1996b; Jørgensen et al. 1997) and have been adopted in synthetic works on stellar populations. The overall physics of the binary evolution scenario is similar in all models, the differences concerning mainly the distribution of the initial binary parameters and the detailed treatment of the effects of SN explosions within massive binaries.
2.1 X-ray binaries
Binary systems constitute the brightest class of Galactic X-ray sources (see reviews by White et al. 1995, and van Paradijs 1998). The primary factors that determine the emission properties of X-ray binaries are (1) nature of the accreting object, either a black hole (BH) or a neutron star (NS), (2) if a NS, strength and geometry of its magnetic field, (3) geometry of the accretion flow (disk vs. spherical accretion) from the optical companion, (4) mass of the accreting object, and (5) the mass accretion rate. Properties (1)-(3) determine the nature and location of the emission region (i.e., a hot accretion disk surrounding a BH, the polar cap of a NS, the boundary layer between the accretion disk and the NS surface), while the mass (of the accreting companion) and accretion rate largely determine the overall luminosity, spectral shape, and time variability of the emission.
An important and essentially full characterization of X-ray binaries can be made according to the mass of the donor star: (a) high-mass X-ray binaries (HMXB), where the optical component is a main-sequence star with , and (b) low-mass X-ray binaries (LMXB), where the optical component is a post-main-sequence, Roche-lobe-overflowing star with 333If the optical component is a main-sequence star with , either it does not support strong radiatively driven winds, and/or the common binary envelope (which forms when the accretion rate onto the compact component is so large that ; see below) is very short lived, so that the ensuing X-ray emission is unlikely to be observed.. The main distinction between HMXBs and LMXBs has to do with the nature of the mass transfer – inefficient wind accretion in HMXBs, and efficient transfer through Roche-lobe throat in LMXBs [as a consequence, generally, ].
An alternative and equally effective distinction, partially overlapping with the previous one, can be made by the nature of the accreting object:
(a) systems containing a strongly magnetized neutron star (NS): these systems are HMXBs;
(b) systems containing a weakly magnetized NS: these systems are LMXBs; and
(c) systems containing a black hole (BH): these systems can be both HMXBs and LMXBs.
The following brief comments should be noted (see van Paradijs 1998).
Virtually all HMXBs harbor strongly magnetized X-ray pulsars ( G, as also inferred from the presence of cyclotron lines in their X-ray spectra; see Mihara et al. 1991 and references therein); on the other hand, X-ray pulsations occur only rarely in LMXBs, while bursts 444Luminosity increases by a factor 10 usually within 1 s, followed by a decay to pre-burst X-ray flux level within 10 s to a minute. do occur only in LMXBs. The mutual exclusion of pulsations and bursts (but see Kouveliotou et al. 1996) suggests that the feature distinguishing the NSs in LMXBs from those in HMXBs is either a weaker magnetic field, or the alignment of the NS magnetic and rotational axes. However, the difference in the X-ray spectral properties of HMXBs and LMXBs (the former usually having harder spectra, see White & Marshall 1984) strongly points to a difference in the geometry of the accretion flow, and hence of the magnetic field strength. 555The difference in magnetic field strength between NSs in HMXBs and those in LMXBs could be either primordial or evolutionary. In the former case it may be related to a difference in the formation mechanisms of NSs in HMXBs and in LMXBs, i.e., via the normal evolution of a massive star and via the accretion-induced collapse of a white dwarf, respectively. In the latter case, a decay of the NS magnetic field – either spontaneous or caused by (e.g.) the accretion process – has been suggested by the observation that (strongly magnetized) NSs in HMXBs are all young objects, whereas those (weakly magnetized) in LMXBs are typically much older. In fact, in a NS with magnetic fields of G (and sub-Eddington accretion rates), the accretion flow is disrupted at several hundred NS radii and most of the inflowing material is funneled onto the magnetic pole and reaches the NS on a relatively small area near the magnetic polar cap. The emission is magnetically beamed (either along or perpendicular to the field lines, corresponding to, respectively, ”pencil beam” or ”fan beam” emission) and hence, if the magnetic and rotation axes are misaligned and if the beamed emission from the magnetic poles rotates through the line of sight to the observer, X-ray pulsations are observed; the emitted X-ray spectrum has a broken-power-law profile. (Note that these features collectively correspond to overall HMXB phenomenology.) On the other hand, for much weaker ( G) magnetic fields, the accretion disk may touch or come close to the NS surface, and the accreting material is distributed over a larger fraction of the NS surface: consequently, X-ray emission shows no pulsations (but it may show bursts 666After sufficiently large amount of matter has accreted on the NS surface, critical conditions may develop at the base of the accreted flow, causing unstable helium burning: the sudden release of nuclear energy gives rise to an X-ray burst. ), and has a partially Comptonized thermal spectrum , with . (These features collectively correspond to overall LMXB phenomenology.)
Spectra of BH X-ray binaries (BHXBs) have a distinct two-component signature (which has turned out to be a very good predictor for the presence of a BH in an X-ray binary; e.g., Tanaka & Lewin 1995). One component is ultrasoft with a characteristic temperature of 1 keV, which can be modelled as an optically thick, geometrically thin accretion disk (e.g., Ebisawa et al. 1994). The other component is an ultrahard power law with photon index in the range 1.5 to 2.5 that extends up to several hundred keV (e.g., Wilson & Rothschild 1983). There is a correlation between luminosity and shape of the 2-10 keV spectrum: a spectral hardening, caused by the weakening of the ultrasoft component, signals a transition from a high state, where the ultrasoft component may even completely dominate the emission, to a low state, where the ultrasoft component is weak or absent, and the X-ray spectrum is dominated by the hard power-law component. Out of 10 BHXBs currently known in the Galaxy 777Other 17 systems are suspected to be BHXBs based on spectral considerations (see van Paradijs 1998)., 3 are HMXBs, and 7 are transient LMXBs (White & van Paradijs 1996). The total number of BH X-ray transients is estimated to be 500, with typical recurrence time yr, and decay time yr (White & van Paradijs 1996). This implies that at any given time only X-ray active BHXBs are expected in the Galaxy. Given the relative paucity of such sources within the two main families of X-ray binaries, the contribution from BHXBs will not be considered further in this paper.
We adopt the model of Iben et al. (1995a,b) for the formation of the Galactic X-ray binary population. The model is based on standard stellar evolution theory, and a numerical code with a semi-empirical birth function for binary stars (normalized to parameters appropriate for the Galaxy),
where is the semimajor orbital axis of the binary orbit (in the range ), is the mass of the primary, and () is the secondary-to-primary mass ratio (all quantities refer to the primordial system). The Iben et al. model is based on the assumption of equal binary birth and death rates and the attainment of steady state, valid when the age of the stellar population is much longer than the characteristic system lifetime.
2.1.1 HMXBs
Persistent HMXBs have short periods ( days) and show significant flux variability; these objects form in systems with and , and (so the primary star can make Roche-lobe contact when it leaves the main sequence). Transient HMXBs have recurrent pronounced flux spikes and periods of quiescence where their X-ray emission is below the limit of detectability; these objects have long periods ( days) and form in systems with . Conservative (binary) mass transfer increases the secondary mass and the separation. A NS is formed as the remnant of a SN explosion of the primary star with mass . (The lower limit can be for binaries wide enough that the primary never fills the Roche lobe, but such systems do not evolve into X-ray binaries.) A 40 (primary) star is assumed to evolve into a 10 BH.
X-rays from HMXBs result from accretion by a NS of matter from the radiatively driven wind of an OB star. The bright X-ray phase of persistent HMXBs begins when the optical component approaches the Roche lobe in size and the fraction of the donor-emitted wind matter captured by the NS (or BH) increases towards maximum. In order to estimate the birthrate of binary systems in the correct configuration, Iben et al. (1995a) assume that the accretion occurs at the Bondi & Hoyle (1944) rate, and that all the gravitational potential energy released in the accretion process in converted to X-rays. The luminosity is
where and are the donor (OB star) mass and radius, is the primary mass, is the mass-loss rate from the donor, and (Waters & van Kerkwijk 1989). Choosing the fairly typical values , , , and yr-1 (see Iben et al. 1995a), we obtain:
Thus, to achieve the highest possible and persistence of the source, the optical component must be close to filling its Roche lobe (). In this case the gas stream dominates the accretion flow and a stable accretion disk forms around the primary, smoothing out inhomogeneities in the accretion and reducing the time variability of the source.
Using , , and in eq.(2), so as to obtain a crude estimate of the birthrate of systems having a NS and an OB star in the correct configuration, Iben et al. (1995a) estimate . Since the average duration of the bright X-ray phase ( erg s-1) is yr (Meurs & van den Heuvel 1989), the expected number of such systems that are produced during the massive star formation phase, , is
in agreement with observational estimates.
The phase-averaged X-ray photon spectrum from persistent, bright ( erg s-1) HMXBs in the 2-50 keV band can be represented (White et al. 1983) as a broken power law 888This spectral steepening has been interpreted as the result of the anisotropic energy dependence of the cross sections below the cyclotron resonance in strong (1012 G) magnetic fields (e.g., Boldt et al. 1976), and it may give an independent measure of the field strength. But other parameters, e.g. the temperature and optical depth of the NS atmosphere, could be important in determining the break energy.:
where denotes energy (in keV), and with photon index , cutoff energy keV, and -folding energy keV. In addition, a small amount of low-energy absorption by cool material and an Fe-K feature between 6 and 7 keV are required in the fits. There appears to be no correlation of , , or Fe-K equivalent width with luminosity.
The mean HMXB spectrum is then formally obtained by integrating over the HMXB birthrate function:
Because there appears to be no obvious correlation between X-ray spectral shape and mass ratio , primary mass , and/or separation (while the system must be close, , in order for erg s-1), eq.(6) reduces to:
A striking characteristic in the HMXB spectrum is a prominent Fe-K emission feature with central energy in the range keV, and equivalent width keV, only weakly dependent on (White et al. 1983). This emission is unlikely to come from the region close to the NS surface, because the line would be gravitationally redshifted to keV. It is also unlikely that the line is produced near the photosphere of the optical companion, or from the accretion disk surrounding the NS, because given the small angular sizes involved, the expected contributions to fluorescent emission should be both too modest and dependent on the orbital phase, contrary to observations. The two remaining potential sites for fluorescent emission to occur are the stellar wind of the optical companion and the magnetosphere of the NS (see Pravdo et al. 1977; White et al. 1983; Ebisawa et al. 1996). Another relevant emission feature observed in HMXB spectra (at least when the NS companion is eclipsed) is due to SXV (Sako et al. 1999; Ebisawa et al. 1996; Nagase et al. 1994).
2.1.2 LMXBs
Galactic LMXBs are divided into bulge and disk populations. It is estimated that a few hundred LMXBs exist in the Galactic disk, of which only 100 are persistent X-ray sources with erg s-1, where is the Eddington limit for a NS accretor.
In a LMXB system the secondary is a low mass star whose enevelope fills the Roche lobe. Mass transfer onto the NS or BH primary is driven by evolutionary expansion of the donor, magnetic stellar wind, or gravitational radiation. Based on the semi-empirical birth function of such systems, Iben et al. (1995b) estimated the Galactic disk LMXB birthrate to be yr-1.
Iben et al. (1995b) treat the modes of conservative mass transfer from a Roche-lobe–filling (optical) secondary onto the (degenerate) primary in the approximation that the energy from the accretor, intercepted by the donor, has no feedback on the mass-loss rate from the donor itself. This discussion applies both to the case of LMXBs resulting from the evolution of massive binaries with a large (in which the accretor is a NS or a BH, which results from an initial primary mass in the range ), and to the case of LMXBs resulting from accretion-induced collapse of (primary) O-Ne white dwarfs (which results from initial primary masses in the range ). Iben et al. (1995b) then argue that the predicted and the observed Galactic populations of LMXBs can be reconciled only if the assumptions of conservative mass transfer and of no-accretor/donor-feedback are relaxed. In fact, an irradiation-induced wind will develop from the donor that can remove from the system an order of magnitude more mass than it is actually tranferred to the accretor. Also, the induced stellar wind can be accreted by the NS, a bootstrapping situation can be established, in which accretion from an induced wind emitted by the optical component that does not fill the Roche lobe is sufficient for producing the radiation necessary to produce the induced wind itself (the feedback loop is stable). These arguments lead to an estimated duration of the X-ray bright stage of yr which in turn, being , leads to
in fair agreement with observations.
The interpretation of LMXBs spectra has progressed with increasing quality of available data, in terms of: optically thin thermal bremsstrahlung (TB), blackbody (BB) plus TB, BB plus an optically thick (but physically thin) accretion disk blackbody (DBB), and BB plus a form that could possibly represent a Comptonized spectrum (see Christian & Swank 1997 for references). The ambiguity in the spectral form of LMXBs is partly due to the relatively narrow detector spectral band (as compared to the respective emission spectrum). Following White et al. (1985), Christian & Swank (1997) have shown that a model of the form exp() [the so-called ”unsaturated Comptonization” (USC) model 999In accretion onto a NS or a BH the simple BB accretion disk model is not correct and it must be modified to account for the effects of electron scattering, which make energy losses by Comptonization of cool photons on hot electrons dominate the spectral formation (Sunyaev & Titarchuk 1980; see also White et al. 1988). Starting from thermal bremsstrahlung, with a Gaunt factor in the region of interest, White et al. (1985) write, in more generality, which approximates the unsaturated Comptonized spectrum of cool photons upscattered on hot electrons (see also Treves et al. 1988).] is a good approximation to the 0.5 - 20.0 keV Einstein/SSS+MPC spectra of Galactic-disk LMXBs. The USC model gives the best fits to the data, and although its results may not be directly interpretable in terms of a physical description of the sources, 101010E.g., the USC model can approximate TB if [the Gaunt factor for energy spectrum being in the 2-10 keV range], or BB+TB if ., it does offer a phenomenological description with which to compare them. Sources showing variations in intensity by a factor of 2 (”dippers”) or larger (”bursters”, some of which show periodic or aperiodic dips or eclipsing behavior – see Christian & Swank 1997 and references therein), can be fitted with the USC model both in their high (bright) states and in their low (faint) states, with the spectral parameters changing accordingly: higher luminosities tend to correspond to lower values of and viceversa (Christian & Swank 1997; the trend also applies to nonvariable sources). Qualitatively, this inverse correlation can be understood within the accretion model devised to explain the high X-ray luminosities of LMXBs: the increase in luminosity is driven by an increase of the mass accretion rate , which in turn means a piling up of material around the emission region (e.g., the magnetic polar cap of the NS) that leads to a higher Compton scattering optical depth, and hence to a lower value of 111111In the USC model the relation linking the spectral index to the scattering optical depth is (Sunyaev & Titarchuk 1980). Note that for sources having , i.e. sources that are almost optically thick, the unsaturated Comptonization approximation is not strictly valid, but the USC model still provides the best fit to the data (Christian & Swank 1997).. The overal spectral properties of LMXBs can be broadly divided into two classes based on whether the overall luminosity of the source is lower or larger than erg s-1 (White et al. 1988). In particular, the X-ray spectra of Galactic-disk LMXBs in the 0.5-20 keV band can be described by:
with , and both and in keV (see Christian & Swank 1997). [As the ratio of the total energy emitted in bursts to that emitted in persistent flux is , for our purposes here we assume that a given LMXB system can be uniquely described by eq.(9a) or eq.(9b).] The LMXB populations of globular clusters in the Galactic bulge and in M31 have similar characteristics to those in the Galactic disk (Callanan et al. 1995; Matsushita et al. 1994; Trinchieri et al. 1999). Thus, the spectral properties of LMXBs vary little (if at all) between the disk and the globular-cluster populations of our Galaxy, or among galaxies in general.
The mean LMXB spectrum is then obtained by integrating over the LMXB birthrate function:
Assuming that is independent of both and , the resulting average LMXB spectrum is the sum of the low- and high- contributions [eq.(9)], weighted by the relative frequencies. We can assume that the most critical parameter in determining whether is higher or lower than the ”threshold” value of erg s-1 is the initial semimajor axis . In the above model (sect. 2.1.1), tight (2 8) systems have erg s-1, while loose (8 100) systems have erg s-1. Thus, eq.(10) transforms into
where and denote the low- and high- representations of eq.(9).
2.2 Supernova remnants
It is usually assumed that all stars with mass between some lower threshold and will eventually explode as supernovae (e.g., Woosley & Weaver 1995). (The evolution of stars is less clear.) The lower mass for a progenitor of a SN II event (core collapse) is (if convective overshooting is not important; if it is, the lower limit could be as low as ). According to the standard model, SN Ia is a result of thermonuclear instability in a degenerate C-O white dwarf that ignites owing to thermal runaway when the mass reaches the Chandrasekhar limit, (the exact value depends on chemical composition), triggered by the accumulation of material from a companion star.
X-ray emission from SNRs occurs mostly during phase 1 (free expansion) and part of phase 2 (adiabatic) of the evolution of SNRs (e.g.: Woltjer 1972, Chevalier 1977), for a typical duration of yr. The spectrum can be generally described as thermal 121212The ionization equilibrium in the plasma is an additional variable. In detail, individual SNRs may exhibit non-thermal emission in addition (e.g. SN1006: Vink et al. 2000) to or instead of the thermal component (e.g. G266.2-1.2: Slane et al. 2001). Spatially resolved data show that SNR spectra are spatially complex (e.g., RCW 86: Borkowski et al. 2001b, Bocchino et al. 2000; for a review see Hwang 2001). with: , . The X-ray luminosities of young SNRs are typically (e.g.: Hamilton & Sarazin 1984, Charles & Seward 1995, Burrows et al. 2000, Borkowski et al. 2001a). Since the estimated Galactic SN birthrate is yr-1, the predicted number of X-ray bright SNRs (i.e., young remnants that are in the ejecta dominated phase, like Cas A or Tycho’s SNR) in the Galaxy, , is
in fair agreement with observations 131313A catalog, based on Chandra data and complete down to erg s-1, of 110 sources located in a large central region of the nearby face-on spiral M101 – a system that is considered to be in many ways similar to the Galaxy – contains 9 SNRs (Pence et al. 2001). The implied relative frequency of SNRs among the detected sources, 0.080, is in substantial agreement with the value, 0.074, deduced for our model.. [Later in their evolution SNRs cool and dim: during most of the second (adiabatic) phase, remnants are likely to have lower temperatures, keV; in the third (radiative) phase, remnants will cool rapidly to temperatures too low for X-ray emission.]
The resulting average SNR spectrum is then:
where and denote, respectively, the average spectra of the remnants of type Ia and type II supernovae (which in principle may differ from each other). The RHS of eq.(14) accounts for: (a) SNII explosions of (all) stars with (leading to a C-O white dwarf remnant), of (all) stars with (leading to a NS remnant), and of (all) stars with (leading to a BH remnant); and (b) SN Ia explosions from accreting white dwarfs in binary systems, with the white dwarfs resulting from the evolution of progenitor stars with 141414The lower mass limit is determined by the condition that a main-sequence star becomes a white dwarf within the lifetime of the SB (108 yr). Generally, evolution times are longer for lower masses (e.g., Maeder & Meynet 1989).. If the expanding SNRs have all similar spectra, irrespective of the type of the SN event and of mass, then
where is the thermal bremsstrahlung emissivity function.
2.3 O stars
It is well known that massive O and early-B stars are sources of X-ray emission (Rosner et al. 1985). If about of O stars are in binary systems (e.g., Garmany et al. 1980), then based on the birth rate of HMBXs (see section 2.1.1) we have yr-1. Since the main-sequence lifetime of a star (mass range appropriate for O stars) is yr (Chiosi & Maeder 1986; Maeder & Meynet 1989), the expected number of O stars is . (This may be an upper limit: catalogs of Galactic O stars contain 1000 objects, see Conti & Underhill 1988). If we assume an individual X-ray luminosity of erg s-1 (see Corcoran et al. 1994, Griffiths et al. 2000), the inferred total X-ray luminosity of the O-star population is erg s-1. The spectra of O stars have been successfully fitted with multi-temperature thermal models: e.g., simultaneous fits to the ASCA/SIS0 and ROSAT/PSPC spectra of Ori require (at least) three components with temperatures near 0.1, 0.3, and 0.6 keV, plus absorption by a circumstellar medium, presumably the stellar wind (see Corcoran et al. 1994).
The inferred X-ray faintness of O-stars (their totel luminosity would be matched, or even exceeded, by that of a single typical HMXB), leads to the realization that O stars may not contribute significantly to the X-ray emission of a (starbursting) stellar population 151515In M82, Chandra observations have revealed a number of bright OB associations, the brightest of which has an X-ray luminosity of : this large X-ray emission, however, presumably arises from a combination of diffuse plasma, unresolved HMXBs, and O stars (Griffiths et al. 2000). . Hence the contribution from O stars will not be considered further in this paper.
2.4 Compton scattering
As has already been mentioned, the high SN rate in a SBG is bound to yield high relativistic electron densities since SN shocks are known to be primary sites of cosmic ray acceleration. This means that we should expect the mean relativistic electron density in a SBG to be much higher than in the Galaxy. Moreover, the mean energy density of a SBG with a FIR luminosity of is ergs cm-3 (within 10 kpc radius), i.e. times more intense than the cosmic microwave background (CMB) radiation. Obviously, the more spatially concentrated the FIR emission, the higher is this energy density. Radiative losses dominate at electron energies above few hundred MeV (Rephaeli 1979), and Compton scattering of a photon by a 1 GeV electron boosts the energy of the photon to 10 keV. To fully account for a luminosity of erg s-1, the energy density in electrons has to be ergs cm-3, i.e. times higher than in the Galaxy. The latter value also corresponds (roughly) the SBG/Galaxy X-ray luminosity ratio. (Clearly, the required relativistic electron energy density is lower if only part of the total emission is due to Compton scattering, or if the FIR emission is centrally concentrated.)
A high density of electrons in SBGs would also yield an enhanced radio emission. Indeed, there exists a definite correlation between the radio () and FIR luminosities of spiral galaxies: in the FIR luminosity range relevant to SBGs, (Wunderlich & Klein 1988). There are several studies of SBGs as a class in the radio (e.g.: Garwood et al. 1987, Condon et al. 1990 and 1991, Wang & Helou 1992): of the nearby SBGs, M82 in particular has been studied in detail (e.g.: Kronberg et al. 1985, Klein et al. 1988) and is known to have an extended region of disk and halo emission.
If the same electron population produces both the radio and hard X-ray emission, then both spectra are power-laws with roughly the same index. The exact relations between the radio and Compton X-ray flux have been written down (Rephaeli 1979) and explored in detail in the context of SBGs by Goldshmidt & Rephaeli (1995); a power-law spectrum of the form
is expected, with (a photon) index which is roughly in the range . The coefficient can be expressed in terms the measured radio flux and mean value of the magnetic field in the emitting region.
2.5 Diffuse thermal plasma
The ISM and the galactic-halo gas are expected to be shock-heated by SN explosions to approximately galactic virial temperatures, keV. Thermal soft X-ray emission is then expected from the gas. Indeed, ASCA and BeppoSAX data have systematically and unambiguously revealed the presence of a 1 keV thermal component in the 0.5-10 keV spectra of SBGs (Ptak et al. 1997, Cappi et al. 1999, Okada et al. 1997, Della Ceca et al. 1999, Moran et al. 1999, Zezas et al. 1998). More specifically, for N253 Chandra data have shown that soft thermal X-rays come from the regions of interaction between the fast SB-driven wind and the denser ambient ISM, not from the wind fluid itself (Strickland et al. 2000). The spatial resolution attained with XMM has allowed separating the extended and point-like emission components in the disk and the nuclear region, showing an ever increasing spatial and spectral complexity of the unresolved (diffuse?) emission. Two thin plasma components (with and 0.4 keV) are required in the disk, and three (with 0.6, 0.9, and 6 keV) in the nucleus (Pietsch et al. 2001). These results are consistent with the results of Strickland & Stevens’s (2000) simulations of SB-driven galactic winds, where the soft X-rays come from the region of wind/ISM interaction, which is characterized by a multi-temperature, non-uniform plasma. Galactic winds are more efficient at carrying the SN-synthesized metals, rather than the unprocessed gas, out of the galaxy. Since SN Ia products have the largest ejection efficiency (more so than SN II products) and SN Ia produce a substantial fraction of Fe, -burning to Fe ratios are predicted to be higher for the ambient disk gas than for the wind-borne material (Recchi et al. 2001).
The 2 keV thermal emission from the galactic wind comes mostly from the central SB region itself (see Pietsch et al. 2001 for XMM data on N253). In Strickland & Stevens’s (2000) simulations the relatively small volume and the high gas density of the SB region explain why the hard X-ray luminosities are typically of the soft X-ray luminosity of the wind (see also Suchkov et al. 1994). Note that Chandra data have shown that in N253 the hard ( keV) flux is dominated by previously unresolved point-source emission (Strickland et al. 2000), while in M82 up to of the 2-10 keV flux is resolved into point sources (Griffiths et al. 2000).
An appropriate description of the X-ray emission from thermal plasma in SBGs is then:
where is the spectral emissivity function () and is a density dependent normalization factor.
2.6 Compact nucleus
Evidence for a link between intense star formation and nuclear activity has grown steadily in recent years (e.g., Della Ceca et al. 2001; see Veilleux 2000 for a recent review). The apparent correlation – deduced for nearby galaxies – between the mass of the (dormant) nuclear BH and the mass of the spheroid suggests a direct link between the formation of spheroids and the growth of central BHs. Since a SB is a natural consequence of the dissipative gaseous processes associated with spheroid formation, an early (high-) SB/AGN connection is implied by these results. The presence of circumnuclear SBs in many local AGN also suggests a local () SB/AGN connection. This is important since a large contribution from hidden AGN would change the star formation history of the universe as deduced from galaxy luminosity functions, as well as our views on the history of the cosmic chemical enrichment and of the importance of feedback processes in the early universe. Moreover, the contribution of heavily-obscured AGN to the IR and the X-ray background should also be be accounted for.
The fueling of AGN requires mass accretion at a rate
where is the mass-to-energy conversion efficiency. For low-luminosity AGN (LLAGN) (e.g., Seyfert galaxies), eq.(19) implies a modest accretion rate, , to power the activity level over timescales yr; a small fraction of the total gas content of typical host galaxy is then sufficient to fuel LLAGN. A broad range of mechanisms, including intrinsic processes (e.g., stellar collisions and winds, dynamical friction of giant molecular clouds against stars; nuclear bars or spirals produced by gravitational instabilities in the disk) and external processes (e.g., ”minor” galaxy interactions and mergers), may be at work in LLAGN. Observationally, the former seem to be favored over the latter: e.g., ejecta from a nuclear star cluster may be enough for Seyferts and other LLAGN to keep their nuclei active (e.g., Maeda et al. 2001).
For high-luminosity AGN (HLAGN), meeting the stringent requirement on implied by eq.(17) very likely requires external processes, such as major galaxy interactions or mergers, to be involved in triggering and sustaining the high activity level over yr. In fact, (a) substantial evidence exists that at least some HLAGN result from gas-rich mergers; (b) classical double (FR II) radio galaxies show tidal tails and other signs of interaction; (c) evidence for recent or ongoing galactic interactions is seen in several QSOs; (d) many radio galaxies and QSOs show the presence of abundant molecular gas (an essential ingredient of star formation), or the spectroscopic signature of recent star formation; (e) the FIR excess observed in several radio galaxies and QSOs is attributable to star formation. Ultra-luminous IR galaxies (ULIRGs) may represent the clearest observational link between galaxy mergers, SBs and powerful AGN: i) nearly all of them show strong signs of advanced tidal interactions; ii) all are very rich in molecular gas within the innermost kpc of the galaxy; iii) there is a varied level of activity in their nuclei, including strong emission lines, characteristic of starbursting stellar populations, and – in 30% of cases – broad or high-ionization emission lines that suggest the presence of a powerful AGN coexisting with the SB (e.g.: Franceschini et al. 2000, Keil et al. 2001). The fraction of AGN-dominated ULIRGs is significantly larger among objects with high IR luminosities and warm IR colors. The relative dominance of AGN or SBs in ULIRGs may depend on local and short-term conditions (e.g., compression of the circumnuclear ISM as a function of gas content and galaxy structure, local accretion rate onto the central BH), as well as the global state of the merger. Suggestions of the existence of a merger-induced sequence ”SBs cool ULIRGs warm ULIRGs QSOs” imply that SB ages should increase along the sequence. This prediction should be testable with detailed spectroscopic data.
The moderate luminosities of local SBGs indicate that if a nuclear source is present it is of the LLAGN type. ASCA measurements suggest that spiral galaxies often host nuclear LLAGN with erg s-1 (Ishisaki et al. 1996). ROSAT/HRI detections of short-time variability (Collura et al. 1994) support this view. In M82, ASCA hard X-ray data have shown a nuclear unresolved point structure with a long-term flux variability by a factor of , corresponding to a point source luminosity of erg s-1 (see Ptak & Griffiths 1999; RXTE data also suggest temporal variability in M82, see Rephaeli & Gruber 2001; Chandra/HRC observations have shown that the source lies 160 pc away from the dynamical center of M82, see Kaaret et al. 2001 and Matsumoto et al. 2001). Since the observed X-ray luminosity in M82 is a lower limit to its Eddington luminosity, the implied BH mass is 500 (Ptak & Griffiths 1999; see also Strickland et al. 2001 and Dahlem et al. 1995), unless the emission is beamed (King et al. 2001). (The lack of reported temporal variability in other spectral bands in M82 may be explained as due to the large absorption column, and the fairly complicated pattern of activity that would make it hard to detect the temporal signature of LLAGN at other wavelengths.) Comparison of X-ray and FIR properties permits to disentangle SB and LLAGN emissions within the sources (Levenson et al. 2001a,b).
Possible LLAGN contribution to the spectrum of SBGs can be represented as:
with a photon index . A more accurate representation would include: i) a reflection component, in the form of a hardening of the spectrum at 10 keV (i.e., the onset of a broad bump extending from 10 keV to 60100 keV, that arises from the downscattering of the energetic photons of the primary spectrum by the optically thick warm thermal matter of the accretion disk; cf. Lightman & White 1988, Magdziarz & Zdziarski 1994); and ii) a Comptonization effect in the form of a downward bending at 60300 keV, arising from the interaction of radiation with hot embedding ionized plasma (cf. Sunyaev & Titarchuk 1980). But, given the substantial uncertainty in assessing the significance of AGN-like emission in SBGs, we will not consider a nuclear contribution further in this paper.
3 The composite X-ray spectrum of a SBG
Having discussed the most relevant emission processes that occur in a SB 161616 GRBs (-ray bursts), short and intense bursts of 0.1-1 Mev photons (Piran 1999) followed by lower-frequency afterglows (van Paradijs et al. 2000), do not contribute to the mean SBG emission. Based on energy and variability arguments, GRBs have been related to the final stages of supermassive () stars, where non-spherical core collapse would produce beamed -ray emission (Mac Fadyen & Woosley 1999). In this case: i) for a standard IMF slope, candidate GRB progenitors are of SN progenitors; ii) beaming effects introduce an extra factor (with an opening angle , see Frail et al. 2001); iii) for a Galactic SN rate of yr-1, the predicted GRB rate is then yr-1. [A consequence of this: since there are galaxies of luminosity within the horizon, one expects to observe GRBs yr-1, in agreement with BATSE results (Paciesas et al. 1999).] As the X-ray phase of a GRB afterglow lasts yr, we expect GRB X-ray afterglows per galaxy. The contribution of GRBs to the SBG emission is then negligible. we now construct the synthetic (mean) X-ray spectrum of SBGs. Its shape is given by
In our framework the combined ”stellar” contribution [first RHS term of eq.(19)] is taken to have no degrees of freedom – the fractional number densities of the various classes of stellar sources are fixed by the synthetic stellar population model, and the respective observed spectra. The degrees of freedom in modelling the diffuse component are: (1) the gas/stars mass ratio (reflected in the parameter ); (2) the chemical abundance of the gas; and (3) the strength of the FIR radiation field (for a given energy distribution of the electrons, as deduced from the observed radio spectrum), reflected in the strength of the Compton emission.
In Fig.1 we show the resulting spectrum for the ”standard” set of model parameters (as specified in eqs.5, 9, 15, 16, 17).

4 Observed SBG spectra: M82 & N253
The power of X-ray spectral analysis as a diagnostic tool of SBGs is mainly expressed in the ability to identify the leading components by means of the presence of distinctive spectral features. In order to assess the relative contributions of the various processes identified in the previous section, we focus on the spectral insights that can be learned in the best studied nearby SBGs, M82 and N253. Before doing that, we should comment on some implications of the results obtained in sections 2 and 3.
At high energies ( keV) the dominant contributions are from bright LMXBs and – possibly – nonthermal emission. LMXBs constitute of the total population of bright (log) X-ray binaries and their population-averaged spectrum is fairly flat. Nonthermal emission results from either (a) Compton scattering of SN-accelerated relativistic electrons off the FIR and CMB fields, and/or (b) activity from a compact nuclear source. In M82, there is some evidence for the latter emission, as is possibly indicated by appreciable temporal variability seen in RXTE data (Rephaeli & Gruber 2001). This is in accord with earlier ASCA results, in which an unresolved point-like source – possibly an obscured low-luminosity AGN – was determined to dominate the 2-10 keV flux, and exhibited spectral variability on a characteristic 5 year period (Tsuru et al. 1997).
At intermediate energies () bright LMXBs are the stellar component that dominates the continuum (by virtue of their abundance, luminosity, and spectral hardness), with possibly appreciable contribution also from Compton scattering. HMXBs, though constituting only by number of the bright binary population, may contribute crucially to this spectral range: Their relatively hard spectrum shows a pronounced Fe-K emission between 6.4 and 6.7 keV, with keV (White et al. 1983). This feature has important implications on the chemical abundances as deduced from spectral analyses. In fact, recall that the ”hard” component required to fit the ASCA and BeppoSAX data has been interpreted either as thermal (6 keV), as power-law (), or as combination of both. In the first case, the measured implies a low chemical abundance ( 0.3 solar) in the hot gas, while if the thermal and nonthermal contributions are comparable, then the deduced chemical abundance could be roughly solar (Ptak et al. 1997, Cappi et al. 1999, Zezas et al. 1998, Della Ceca et al. 1999, Griffiths et al. 2000). Now, an abundance is probably uncomfortably low for a medium that has been stirred up and enriched by SN activity. In addition, the very presence of large amounts of 5 keV gas poses substantial energetics and hydrostatic equilibrium problems. 171717Very hot ( 5 keV) thermal emission may come from localized regions, such as the inner SB region, where the highest concentration of SN events occur. In fact, temperatures keV can be momentarily reached in the very short Phase I of the evolution of SNRs, lasting yr (e.g., Charles & Seward 1995; see Pietsch et al. 2001 for N253). If the ”hard” component were (mainly) due to the emission from X-ray binaries and possibly nonthermal Compton emission, the consequences would be that (i.e., emission from HMXBs will be overshadowed by other emission) and there would be no need for a high-, low- plasma.
At energies keV, the low temperature ( keV) diffuse plasma resulting from the interaction between the hot, low-density galactic winds and the cold, high-density ISM is an important component.
The contribution of young, ejecta-dominated SNRs to the continuum X-ray emission of a SBG is probably minor. Indeed, there seems to be little overlap between the X-ray source position in M82 (based on high-resolution Chandra measurements), and the positions of radio-detected young (i.e., brighter) SNRs (Griffiths et al. 2000). Thus, interpretation of X-ray data based on the assumption that the 2 keV emission comes mostly from SNRs (e.g., Pietsch et al. 2001) is doubtful. On the other hand, emission from older, cooler (1 keV) remnants might be hard to distinguish from the diffuse thermal emission, similarly characterized by 1 keV. Remarkably, SNRs might provide a significant contribution to the observed 6.7 keV Fe-K line (cf. Fig.1), further weakening the case for a thermal interpretation of the 2-10 keV ”hard” component. Some caution, however, is in order. It should be emphasized that the properties of SBG SNRs may differ from those of Galactic SNRs: owing to the variety of environment (e.g., the ISM is much denser in SBGs) the ejecta will generally experience diverse (and complex) evolution patterns, which will in turn lead to a broad range of emission properties 181818This topic is relevant for evolutionary models of the radio emission produced in compact SBs (Pérez-Olea & Colina 1995), as well as for studies of alternative physical mechanisms (i.e., mechanisms not requiring the presence of a supermassive-BH) that would allow an explanation of the observed properties of AGNs (Terlevich et al. 1992 and references therein). (e.g., Cid-Fernandes et al. 1996). Consequently, even among SBGs the properties of SNRs may have a large scatter. It has also been suggested that SNRs can contaminate the bright end of the X-ray–binary luminosity function, and hence the integrated spectra of the host galaxies (Wu et al. 2001).

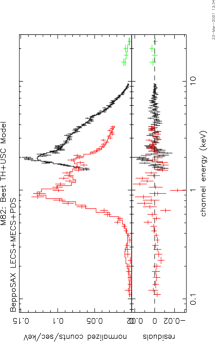

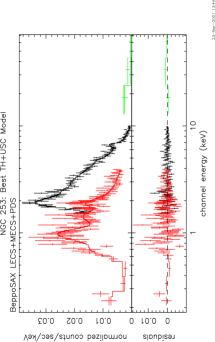
Based on the above summary of sources of X-ray emission in SBGs, we are led to the consideration of binary systems as the main contributors to the 2-10 keV emission of SBGs, with the possibility of appreciable contribution also from Compton scattering. To check this hypothesis, we have re-analyzed the 0.5-20 keV BeppoSAX LECS+MECS+PDS spectra of M82 and N253 (see Cappi et al. 1999). For M82, the best-fitting model ( with DOF=138) of Cappi et al. includes two thermal components, one with keV and the other (self-absorbed through cm-2) with keV, both chemically unevolved (). The model for N253 is similar ( for DOF=184): the two thermal components have keV and 5.75 keV, respectively (with the latter component self-absorbed through cm-2), and both chemically unevolved (). (See Cappi et al. 1999 for details on both models.) As a check of the hypothesis that in both galaxies the hard component is mainly due to massive-binary emission, we replaced the harder component in these models with an component (i.e., the USC profile used to describe the spectra of LMXBs, the more abundant population of X-ray binaries), plus a Gaussian to fit the Fe-K emission complex (as needed), and found the best-fit parameters with the soft thermal component kept frozen. The resulting parameters of the USC component are: and keV (self-absorption: cm-2) for M82; and and keV (self-absorption: cm-2), with the Fe-K emission feature centered at keV, and with keV for N253. (Note that the PDS data points have negligible effects on our results.) The resulting values of and are well within the ranges observed in LMXB spectra. For both M82 and N253, then, the thermal+USC fits are as satisfactory as the original double thermal models (see Figs.2,3). These results are robust. In fact, the best-fit thermal+USC models:
M82. Thermal component: keV (with ); USC component: and keV (self-absorption: cm-2); goodness of fit: (DOF=138);
N253. Thermal component: keV (with ); USC component: and keV (self-absorption: cm-2); Fe-K emission feature at fitted with a Gaussian): keV, keV; goodness of fit: (DOF=179).


Furthermore, fitting the 2-10 keV spectra of M82 and N253 with only the USC model gives good fits, with the values of the USC parameters remaining virtually unchanged (see Fig.4).
As previously mentioned, the stellar component of the X-ray continuum has no degrees of freedom once the stellar population model has been selected, and the relevant spectral properties have been observed. In our treatment, with the Iben et al (1995a,b) Galactic synthetic model and a bright-to-faint LMXB luminosity ratio of 10, the predicted total ”stellar” spectrum is fairly flat 191919Changing the bright-to-faint LMXB luminosity ratio does not significantly alter the results. Lowering the assumed bright-to-faint LMXB luminosity ratio and steepening (within observational errors) the mean HMXB causes only a slight steepening of the predicted ”stellar” spectrum. Thus, the flatness of the predicted ”stellar” spectrum is a relatively secure result in our treatment. in the 2-10 keV band (; see Fig.5), because in this region the spectrum is dominated by the flat-spectrum bright LMXBs and HMXBs, while the data require . Therefore, either (a) most of the massive X-ray binaries responsible for the hard component have a relatively steep spectrum, (and hence resemble faint Galactic LMXBs), or (b) there is also an appreciable contribution due to Compton scattering (with ), resulting in a suitably steep spectrum (see Fig.6). In the former case, if the spectral properties of X-ray binaries are the same in SBGs as in the Galaxy, the (fractional) population of low-luminosity LMXBs should be higher in SBGs than in the Galaxy in order to give a suitably steep integrated ”stellar” spectrum. Consequently in SBGs the form of the binary birthrate function should differ from the Galactic one given in eq.(2), (e.g.) by a factor with and , so as to imply a higher-than-Galactic fraction of low-luminosity LMXBs and hence a steeper composite spectrum () as required observationally.


Another possibility involves a more radical variation from our assumed theoretical scenario. In a SB the formation of low-mass stars could be suppressed if SN blast waves of more rapidly forming massive stars did disrupt the slowly forming less massive stars before these have completed or even have reached their Hayashi tracks. The ensuing stellar initial mass function (IMF) would be truncated so that only stars with mass above some low-mass cutoff will form. Indeed, evolutionary models of the SB in M82 suggest that the IMF is likely to be restricted to (Doane & Mathews 1993; Rieke et al. 1993) 202020Note that also the putative SB at the Galactic center is best modelled with a truncated IMF, with (Lipunov et al. 1996a).. In this case no LMXBs would form, and the binary population of the SB would only consist of HMXBs. The resulting 2-10 keV synthetic spectrum would then be dominated by HMXBs, and hence the USC fit would have [cf. eq.(5); see Fig.7]. Note that M82 does have (see Fig.4). As a matter of fact, even if the IMF did retain its universal properties of shape and mass domain so that the formation of low-mass stars were not inhibited, a galaxy undergoing one isolated SB episode would not experience a SB-driven increase of the population of LMXBs. In fact, the time required for the 1 optical companion in a LMXB system to evolve out of the main sequence and come into Roche-lobe contact (and hence start the X-ray bright phase) by far exceeds a typical SB lifetime. So, during one isolated SB episode there is time for only HMXBs to form: HMXBs would then be the only type of X-ray binaries contributing to the X-ray emission from an isolated SB. (Of course, the LMXBs associated with the background old stellar population of the galaxy would also contribute to the overall emission.) LMXBs could be important contributors to the X-ray emission of SBGs that have been undergoing recurrent bursts of star formation: such could be the case for, e.g., galaxies that are members of pairs with highly eccentric orbits, or galaxies that are found in crowded environments (e.g., compact groups: see Hickson et al. 1989): in both cases, tidal interactions would be recurrent – whether periodically or aperiodically. Therefore, determining the type of X-ray binaries whose emission dominates the 2-10 keV luminosity of a SBG would provide a clue to understanding the star formation history of that galaxy.


The arcsec angular resolution of current X-ray telescopes (e.g., Chandra) enables observational tests to discriminate between LMXBs and HMXBs as the main (stellar) contributors to the 2-10 keV emission in SBGs. For example, LMXBs contain low-mass stars and hence they should be partially associated with the bulge, while HMXBs (which contain, of course, more massive stars), should not (e.g., Pence et al. 2001): therefore LMXBs and HMXBs are expected to have different spatial distributions within a galaxy. Also, since a significant fraction of star formation occurs in clusters (e.g. M82: see O’Connell et al. 1995 in the optical, and Griffiths et al. 2000 in X-rays), and stellar-cluster ages can be inferred from optical data coupled with evolutionary models of HII clouds embedding a cluster (e.g., García-Vargas et al. 1995a, 1995b), constraints can be put on the masses of the X-ray–emitting stars. Finally, as the spectral profile of the point sources is an efficient diagnostics of the nature of the accreting objects (Ostriker 1977; White & Marshall 1984), source-by-source measurements of the X-ray spectral hardness could give us important clues for the identifications of such point-like sources 212121The need for individual spectral identifications arises from the following argument. In the 2-10 keV band, HMXBs have a power-law spectrum with photon index [see eq.(5)]. In the same band, luminous (1037 erg s-1) LMXBs have a harder () spectrum, while less luminous (1037 erg s-1) LMXBs have a softer () spectrum [see eqs.(9a), (9b)]: the resulting population-averaged spectrum [see eq.(11)] can be fitted by a power law of photon index 1.1 (see Fig.8). Therefore, the effective spectral indexes of the integrated LMXB and HMXB spectra are very similar, and compatible with each other. So, from their integrated spectra the two populations of HMXBs and LMXBs can hardly be distinguished from each other: hence the need for individual spectral measurements of the point-like sources. .


For M82 and N253 the USC fluxes, and erg cm-2 s-1, respectively (see Fig.4) – and corresponding luminosities and erg s-1 – imply populations of and luminous ( erg s-1) X-ray binaries (if the hard components are totally produced by X-ray binaries). This means that these local SBGs host a factor times more high-luminosity X-ray binaries than the Galaxy: assuming a universal stellar IMF, a similar proportion holds between the respective star formation rates (a compatible result is based on radio SN rates, see Bartel et al. 1987). This estimate is compatible with the hypothesis of an X-ray-binary–related origin of the hard component of SBG spectra.


5 Conclusion
Using an equilibrium stellar-population synthesis model that follows the evolution of massive binary stars taking into account the different modes of mass transfer (Iben et al. 1995a,b), birthrates have been deduced for massive binaries, in which mass is accreted from a primary star onto a degenerate companion, for a range of primary masses. This, together with estimates of the duration of the X-ray bright phase, has led to realistic estimates of the relative abundances of HMXBs and LMXBs. A similar approach has been used for SNRs, following SN explosions that have occurred in both single and binary stars. The lifespans assumed for the three types of source ( yr for HMXBs; yr for LMXBs; and yr for SNRs – see sections 2.1.1, 2.1.2, and 2.3) are safely shorter than a typical galactic SB lifetime ( yr): this suggests that the equilibrium assumption implicit in our calculation is valid 222222In our calculation we assume that, for each class of sources, systems have a spectrum with shape and strength (i.e., integrated X-ray luminosity) . This assumption is valid when the stellar population is in equilibrium, i.e. when the age of the SB is much longer than the characteristic lifespans of the systems.. For each source class, a systematic search of published spectra has shown that the average spectrum can be described as: (1) power law (with cutoff) for HMXBs, (2) unsaturated Comptonization model (with a correlation between shape and luminosity) for LMXBs, and (3) thermal plasma for SNRs.
¿From the spectral properties and relative abundances of the various classes of stellar sources, we have then computed the composite X-ray spectrum arising from a stellar population of Galactic composition. This ”stellar” contribution has no essential degrees of freedom: it is fixed by the synthetic model and the observed X-ray spectra of the contributing components.
The extended, non-stellar part of the emission has both thermal and non-thermal components. The former originates mostly from regions of interaction between the outgoing galactic wind powered by SN explosions and the ambient ISM. Non-thermal emission is due to Compton scattering of the SN-accelerated, radio-emitting relativistic electrons off the FIR and CMB radiation fields; the integrated spectrum is power-law, with index that should be comparable to that of the extended radio emission. The main quantities in the modelling of the diffuse emission are: (1) the gas/stars mass ratio, (2) the chemical abundance of the gas, and (3) the FIR radiation field (for a given electron energy spectrum, as deduced from the observed radio emission).
This systematic survey of sources of X-ray emission in a SBG reveals that – based on stellar evolution arguments – in the 2-10 keV energy range X-ray binaries (1) are the most prominent stellar component, and (2) have the the required spectral shape. Their population-averaged spectrum is effectively described by a cut-off power law (plus an additional Fe-K emission, from HMXBs), whose observed ranges of parameter values provide good fits to the BeppoSAX spectra of the most extensively observed nearby SBGs, M82 and N253. This agreement also suggests that the hard component observed in the 2-10 keV spectrum of SBGs may indeed result from the integrated emission of X-ray binaries with a mean spectrum similar to the one observed from Galactic HMXBs or lower-luminosity LMXBs; or that some level of steeper Compton emission combines with the predicted ”stellar” emission to give the observed hard component. In possible agreement with this suggestion is the conclusion, based on Chandra data, that in both N253 and M82 the 2-10 keV flux is dominated by (previously unresolved) point-source emission (Strickland et al. 2000, Griffiths et al. 2000). If our composite SBG spectrum, with its main components as identified in this paper, will be found successful also in fitting other SBG spectra (Persic et al., in preparation), then the central role played by X-ray binaries in SBGs will have been broadly demonstrated and ascertained.
In a broader perspective, our proposed template spectrum provides a physical fit that may prove especially useful for interpreting low spatial resolution data on normal and starbursting galaxies, either distant (e.g., from Chandra and XMM deep surveys) or nearby (e.g., from ASCA and BeppoSAX). Concerning the latter, the ambiguity noted so far in interpreting the available low-resolution spectra of SBGs – notably, on the nature of the hard component (e.g.: Ptak et al. 1997, Okada et al. 1997, Persic et al. 1998, Cappi et al. 1999, Della Ceca et al. 1999, Moran et al. 1999, Zezas et al. 1998; see also Weaver et al. 2000 and Dahlem et al. 2000) – may disappear when a more realistic model is used to interpret the emission. One further consequence of using this template spectrum is the general possibility, for the first time, of measuring the star formation rate in galaxies directly from X-ray spectra. In fact, provided that the stellar IMF as well as the formation mechanisms (and hence the X-ray spectral properties) of X-ray binaries and SN are universal, in matching the observed spectrum of a given galaxy with a spectral template the only basic degree of freedom left will be the amplitude (i.e., the flux and hence the luminosity, once the distance to the source is known) which is proportional to the galaxy’s star formation rate.
Acknowledgements. We thank Massimo Cappi, John Danziger, Duane Gruber, Una Hwang, Elena Pian, and Jean Swank for useful exchanges and help. Two independent anonymous referees made very good suggestions. MP gratefully acknowledges financial support from the Italian Ministero dell’Università e della Ricerca Scientifica e Tecnologica through grant No.9802192401-007, and acknowledges the hospitality of the Center for Astrophysics and Space Sciences of the University of California, San Diego, where part of this work was carried out.
References
Balzano, V.A. 1983, ApJ, 268, 602
Bartel, N., Ratner, M.I., Shapiro, I.I., Rogers, A.E.E., & Preston, R.A. 1987, ApJ, 323, 505
Bocchino, F., Vink, J., Favata, F., Maggio, A., & Sciortino, S. 2000, A&A, 360, 671
Boldt, E.A., Holt, S.S., Rothschild, R.E., & Serlemitsos, P.J. 1976, A&A, 50, 161
Bondi, H., & Hoyle, F. 1944, MNRAS, 104, 273
Borkowski, K.J., Lyerly, W.J., & Reynolds, S.P. 2001a, ApJ, 548, 820
Borkowski, K.J., Rho, J., Reynolds, S.P., & Dyer, K.K. 2001b, ApJ, 550, 334
Burrows, D.N., Michael, E., Hwang, U., McCray, R., Chevalier, R.A., Petre, R., Garmire, G.P., Holt, S.S., & Nousek, J.A. 2000, ApJ, 543, L149
Callanan, P.J., Penny, A.J., & Charles, P.A. 1995, MNRAS 273, 201
Cappi, M., Persic, M., Bassani, L., Franceschini, A., Hunt, L.K., Molendi, S., Palazzi, E., Palumbo, G.G.C., Rephaeli, Y., & Salucci, P. 1999, A&A, 350, 777
Cerviño, M., & Mas-Hesse, J.M. 1994, A&A, 284, 749
Charles, P.A., & Seward, F.D. 1995, in ”Exploring the X-ray Universe” (Cambridge University Press)
Chevalier, R.A. 1977, ARAA, 15, 175
Chiosi, C., & Maeder, A. 1986, ARAA, 24, 329
Christian, D.J., & Swank, J.H. 1997, ApJS, 109, 177
Cid-Fernandes, R., Plewa, T., R zyczka, M., Franco, J., Terlevich, R., Tenorio-Tagle, G., & W.Miller 1996, MNRAS, 283, 419
Collura, A., Reale, F., Schulman, E., & Bregman, J.N. 1994, ApJ, 420, L63
Condon, J.J., Helou, G., Sanders, D.B., & Soifer, B.T. 1990, ApJS, 73, 359
Condon, J.J., Huang, Z.-P., Yin, Q.F., & Thuan, T.X. 1991, ApJ, 378, 65
Conti, P.S., & Underhill, A.B. 1988, O-Type Stars and Wolf-Rayet Stars, NASA, SP-497
Corcoran, M.F., Waldron, W.L., MacFarlane, J.J., Chen, W., Pollock, A.M.T., Torii, K., Kitamoto, S., Miura, N., Egoshi, M., & Ohno, Y. 1994, ApJ, L95
Dahlem, M., Heckman, T.M., & Fabbiano, G. 1995, ApJ, 442, L49
Dahlem, M., Parmar, A., Oosterbroek, T., Orr, A., Weaver, K.A., & Heckman, T.M. 2000, ApJ, 538, 555
Dalton, W.W., & Sarazin, C.L. 1995a, ApJ, 440, 280
Dalton, W.W., & Sarazin, C.L. 1995b, ApJ, 448, 369
David, L.P., Jones, C., & Forman, W. 1992, ApJ, 388, 82
Della Ceca, R., Griffiths, R.E., Heckman, T.M., Lehnert, M.D., & Weaver, K.A. 1999, ApJ, 514, 772
Della Ceca, R., Pellegrini, S., Bassani, L., Beckmann, V., Cappi, M., Palumbo, G., Trinchieri, G., & Wolter, A. 2001, A&A, 375, 781
Dewey, R.J., & Cordes, J.M. 1987, ApJ, 321, 780
Doane, J.S., & Mathews, W.G. 1993, ApJ, 419, 573
Ebisawa, K., Day, C.S.R., Kallman, T.R., Nagase, F., Kotani, T., Kawashima, K., Kitamoto, S., & Woo, J.W. 1996, PASJ, 48, 425
Ebisawa, K., Ogawa, M., Aoki, T., Dotani, T., Takizawa, M., Tanaka, Y., & Yoshida, K. 1994, PASJ, 46, 375
Fabbiano, G. 1995, in ”X-Ray Binaries”, ed. W.H.G. Lewin, J. van Paradijs, & E.P.S. van den Heuvel (Cambridge University Press), 390
Frail, D.A., Kulkarni, S.R., Sari, R., Djorgovski, S.G., Bloom, J.S., Galama, T.J., Reichart, D.E., Berger, E., Harrison, F.A., Price, P.A., Yost, S.A., Diercks, A., Goodrich, R.W., & Chaffee, F. 2001, Nature, submitted (astro-ph/0102282)
Franceschini, A., Bassani, L., Cappi, M., Granato, G.L., Malaguti, G., Palazzi, E., & Persic, M. 2000, A&A, 353, 910
García-Vargas, M.L., Bressan, A., & Díaz, A.L. 1995a, A&AS, 112, 13
García-Vargas, M.L., Bressan, A., & Díaz, A.L. 1995b, A&AS, 112, 35
Garmany, C.D., Conti, P.S., & Massey, P. 1980, ApJ, 242, 1063
Garwood, R.W., Dickey, J.M., & Helou, G. 1987, ApJ, 322, 88
Goldshmidt, O., & Rephaeli, Y. 1995, ApJ, 444, 113
Griffiths, R.E., Ptak, A., Feigelson, E.D. Garmire, G., Townsley, L., Brandt, W.N., Sambruna, R., & Bregman, J.N. 2000, Science, 290, 1325
Hamilton, A.J.S., & Sarazin, C.L. 1984, ApJ, 284, 601
Hickson, P., Menon, T.K., Palumbo, G.G.C., & Persic, M. 1989, ApJ, 341, 679
Hwang, U. 2001, in ”Young Supernova Remnants”, eds. S.S. Holt & U. Hwang, AIP Conference Proceedings Vol. 565, 143
Iben, I., Jr., Tutukov, A.V., & Yungelson, L.R. 1995a, ApJS, 100, 217
Iben, I., Jr., Tutukov, A.V., & Yungelson, L.R. 1995b, ApJS, 100, 233
Ishisaki, Y., Makishima, K., Iyomoto, N., Hayashida, K., Inoue, H., Mitsuda, K., Tanaka, Y., Uno, S., Kohmura, Y., Mushotzky, R.F., Petre, R., Serlemitsos, P.J., & Terashima, Y. 1996, PASJ, 48, 237
Jørgensen, H., Lipunov, V.M., Panchenko, I.E., Postnov, K.A., & Prokhorov, M.E. 1997, ApJ, 486, 110
Kaaret, P., Prestwich, A.H., Zezas, A., Murray, S.S., Kim, D.-W., Kilgard, R.E., Schlegel, E.M., & Ward, M.J. 2001, MNRAS, 321, L29
Keil, R., Boller, Th., & Fujimoto, R. 2001, in ”New Century of X-Ray Astronomy”, eds. H. Kunieda & H. Inoue, ASP Conference Series, in press (astro-ph/0106195)
King, A.R., Davies, M.B., Ward, M.J., Fabbiano, G., & Elvis, M. 2001, ApJ, 552, L109
Klein, U., Wielebinski, R., & Morsi, H.W. 1988, A&A, 190, 41
Kouveliotou, C., van Paradijs, J., Fishman, G.J., Briggs, M.S., Kommers, J., Harmon, B.A., Meegan, C.A., & Lewin, W.H.G. 1996, Nature, 379, 799
Kronberg, P.P., Biermann, P.L., & Schwab, F.R. 1985, ApJ, 291, 693
Leitherer, C., & Heckman, T.M. 1995, ApJS, 96, 9
Levenson, N.A., Weaver, K.A., & Heckman, T.M. 2001a, ApJS, 133, 269
Levenson, N.A., Weaver, K.A., & Heckman, T.M. 2001b, ApJ, 550, 230
Lightman, A.P., & White, T.R. 1988, ApJ, 335, 57
Lipunov, V.M., Ozernoy, L.M., Popov, S.B., Postnov, K.A., & Prokhorov, M.E. 1996a, ApJ, 466, 234
Lipunov, V.M., Postnov, K.A., & Prokhorov, M.E. 1996b, A&A, 310, 489
Mac Fadyen, A.I., & Woosley, S.E. 1999, ApJ, 524, 262
Madau, P., Ferguson, H.C., Dickinson, M.E., Giavalisco, M., Steidel, C.C., & Fruchter, A. 1996, MNRAS, 283, 1388
Maeda, Y., Baganoff, F.K., Feigelson, E.D., Morris, M., Bautz, M.W., Brandt, W.N., Burrows, D.N., Doty, J.P., Garmire, G.P., Pravdo, S.H., Ricker, G.R., & Townsley, L.K. 2001, ApJ, in press (astro-ph/0102183)
Maeder, A., & Meynet, G. 1989, A&A, 210, 155
Magdziarz, P., & Zdziarski, A.A. 1995, MNRAS, 273, 837
Mas-Hesse, J.M., & Cerviño, M. 1999, in IAU Symp. 193 ”WR Phenomena in Massive Stars and Starburst Galaxies”, eds. K.A. Van der Hucht, G. Koenigsberger, & P.R.J. Eenens (San Francisco, CA: Astronomical Society of the Pacific), 550
Mas-Hesse, J.M., Cerviño, M., Rodríguez-Pascual, P.M., & Boller, Th. 1996, A&A, 309, 431
Mas-Hesse, J.M., & Kunth, D. 1991, A&AS, 88, 399
Matsumoto, H., Tsuru, T.G., Koyama, K., Awaki, H., Canizares, C.R., Kawai, N., Matsushita, S., & Kawabe, R. 2001, ApJ, 547, L25
Matsushita, K., Makishima, K., Awaki, H., Canizares, C.R., Fabian, A.C., Fukazawa, Y., Loewenstein, M., Matsumoto, H., Mihara, T., Mushotzky, R.F., Ohashi, T., Ricker, G.R., Serlemitsos, P.J., Tsuru, T., Tsusaka, Y., & Yamazaki, T. 1994, ApJ, 436, L41
Matsushita, K., Ohashi, T., & Makishima, K. 2000, PASJ, 52, 685
Meynet, G. 1995, A&A, 298, 767
Meurs, E.J., & van der Heuvel, E.P. 1989, A&A, 226, 88
Mihara, T., Makishima, K., Kamijo, S., Ohashi, T., Nagase, F., Tanaka, Y., & Koyama, K. 1991, ApJ, 379, L61
Moran, E.C., Lehnert, M.D., & Helfand, D.J. 1999, ApJ, 526, 649
Nagase, F., Zylstra, G., Sonobe, T., Kotani, T., Inoue, H., & Woo, J. 1994, ApJ, 436, L1
O’Connell, R.W., Gallagher, J.S. III, Hunter, D.A., & Colley, W.N. 1995, ApJ, 446, L1
Okada, K., Mitsuda, K., & Dotani, T. 1997, PASJ, 49, 653
Ostriker, J.E. 1977, Ann. N.Y. Ac. Sci., 302, 229
Paciesas, W.S., Meegan, C.A., Pendleton, G.N., Briggs, M.S., Kouveliotou, C., Koshut, T.M., Lestrade, J.P., McCollough, M.L., Brainerd, J.J., Hakkila, J., Henze, W., Preece, R.D., Connaughton, V., Kippen, R.M., Mallozzi, R.S., Fishman, G.J., Richardson, G.A., & Sahi, M. 1999, ApJS, 122, 465
Pence, W.D., Snowden, S.L., Mukai, K., & Kuntz, K.D. 2001, ApJ, 561, 189
Pérez-Olea, D.E., & Colina, L. 1995, MNRAS, 277, 857
Persic, M., Mariani, S., Cappi, Bassani, L., Danese, L., Dean, A.J., Di Cocco, D., Franceschini, A., Hunt, L.K., Matteucci, F., Palazzi, E., Palumbo, G.G.C., Rephaeli, Y., Salucci, P., & Spizzichino, A. 1998, A&A, 339, L33
Pietsch, W., Roberts, T.P., Sako, M., Freyberg, M.J., Read, A.M., Borozdin, K.N., Branduardi-Raymont, G., Cappi, M., Ehle, M., Ferrando, P., Kahn, S.M., Ponman, T.J., Ptak, A., Shirey, R.E., & Ward, M. 2001, A&A, 365, L174
Piran, T. 1999, Phys Rep, 314, 575
Pols, O.R., Cot , J., Waters, L.B.F.M., & Heise, J. 1991, A&A, 241, 119
Pols, O.R., & Marinus, M. 1994, A&A, 288, 475
Pravdo, S.H., Becker, R.H., Boldt, E.A., Holt, S.S., Serlemitsos, P.J., & Swank, J.H. 1977, ApJ, 215, L61
Ptak, A., Serlemitsos, P.J., Yaqoob, T., Mushotzky, R., & Tsuru, T. 1997, AJ, 113, 1286
Ptak, A., & Griffiths, R. 1999, ApJ, 517, L85
Recchi, S., Matteucci, F., & D’Ercole, A. 2001, MNRAS, 322, 800
Rephaeli, Y. 1979, ApJ, 227, 364
Rephaeli, Y., & Gruber, D. 2001, submitted to AA
Rephaeli, Y., Gruber, D., Persic, M., & MacDonald, D., 1991, ApJ, 380, L59
Rephaeli, Y., Gruber, D., & Persic, M., 1995, AA, 300, 91
Rieke, G.H., Loken, K., Rieke, M.J., & Tamblyn, P. 1993, ApJ, 412, 99
Roberts, T.R., & Warwick, R.S. 2000, MNRAS, 315, 98
Rosner, R., Golub, L., & Vaiana, G.S. 1985, ARA&A, 23, 413
Sako, M., Liedahl, D.A., Kahn, S.M., & Paerels, F. 1999, ApJ, 525, 921
Sari, R., Piran, T., & Narayan, R. 1998, ApJL, 497, L17
Schaerer, D., & Vacca, W.D. 1998, ApJ, 497, 618
Schmitt, H.R., Kinney, A.L., Calzetti, D., & Storchi Bergmann, T. 1997, AJ, 114, 592
Searle, L., Sargent, W.L.W., & Bagnuolo, W.G. 1973, ApJ, 179, 427
Soifer, B.T., Sanders, D.B., Neugebauer, G., Danielson, G.E., Lonsdale, C.J., Madore, B.F., & Persson, S.E. 1986, ApJ, 303, L41
Slane, P., Hughes, J.P., Edgar, R.J., Plucinsky, P.P., Miyata, E., Tsunemi, H., & Aschenbach, B. 2001, ApJ, 548, 814
Strickland, D.K., Colbert, E.J.M., Heckman, T.M., Weaver, K.A., Dahlem, M., & Stevens, I.R. 2001, ApJ, 560, 707
Strickland, D.K., Heckman, T.M., Weaver, K.A., & Dahlem, M. 2000, AJ, 120, 2965
Strickland, D.K., & Stevens, I.R. 2000, MNRAS, 314, 511
Suchkov, A.A., Balsara, D.S., Heckman, T.M., & Leitherner, C. 1994, ApJ, 430, 511
Sunyaev, R.A., & Titarchuk, L.G. 1980, A&A, 86, 121
Tanaka, Y., & Lewin, W.H.G. 1995, in ”X-Ray Binaries”, ed. W.H.G. Lewin, J. van Paradijs, & E.P.J. van den Heuvel (Cambridge: Cambridge University Press), 126
Terlevich, R., Tenorio-Tagle, G., Franco, J., & Melnick, J. 1992, MNRAS, 255, 713
Thompson, R.I., Weymann, R.J., & Storrie-Lombardi, L.J. 2001, ApJ, 546, 694
Treves, A., Belloni, T., Chiappetti, L., Maraschi, L., Stella, L., Tanzi, E.G., & van der Klis, M. 1988, ApJ, 325, 119
Trinchieri, G., Israel, G.L., Chiappetti, L., Belloni, T., Stella, L., Primini, F., Fabbiano, G., & Pietsch, W. 1999, A&A, 348, 43
Tsuru, T., Awaki, H., Koyama, K., & Ptak, A. 1997, PASJ, 49, 619
Tutukov, A.V., Yungelson, L.R., & Iben, I. 1992, ApJ, 386, 197
Van Bever, J., Belkus, H., Vanbeveren, D., & Van Rosenbergen, W. 1999, New Astronomy, 4, 173
Van Bever, J., & Vanbeveren, D. 1998, A&A, 334, 21
Van Bever, J., & Vanbeveren, D. 2000, A&A, 358, 462
Vanbeveren, D., Van Bever, J., & De Donder, E. 1997, A&A, 317, 487
Vanbeveren, D., De Donder, E., Van Bever, J., & Van Rensbergen, W., & De Loore, C. 1998, New Astronomy, 3, 443
van Paradijs, J. 1998, in ”The Many Faces of Neutron Stars”, ed. R.Buccheri et al. (Kluwer Academic Publishers), 279
van Paradijs, J., Kouveliotou, C., & Wijers, R.A.M.J. 2000, ARAA, 38, 379
Veilleux, S. 2000, in ”Starbursts – Near and Far”, ed. Tacconi, L., & Lutz, D. (Springer), in press (astro-ph/0012121)
Vink, J., Kaastra, J.S., Bleeker, J.A.M., Preite-Martinez, A. 2000, A&A, 354, 931
Wang, Z., & Helou, G. 1992, ApJ, 398, L33
Waters, L.B., & van Kerkwijk, M.H. 1989, ApJ, 223, 196
Weaver, K.A., Heckman, T., & Dahlem, M. 2000, ApJ, 534, 684
Weedman, D.W., Feldman, F.R., Balzano, V.A., Ramsey, L.W., Sramek, R.A., & Wuu, C.-C. 1981, ApJ, 248, 105
White, N.E., & Marshall, F.E. 1984, ApJ, 281, 354
White, N.E., Nagase, F., & Parmar, A.N. 1995, in ”X-Ray Binaries”, ed. W.H.G. Lewin, J. van Paradijs, & E.P.S. van den Heuvel (Cambridge University Press), 1
White, N.E., Peacock, A., & Taylor, B.G. 1985, ApJ, 296, 475
White, N.E., Stella, L., & Parmar, A.N. 1988, ApJ, 324, 363
White, N.E., Swank, J.H., & Holt, S.S. 1983, ApJ, 270, 711
White, N.E., & van Paradijs, J. 1996, ApJ, 473, L25
Wilson, C.K., & Rothschild, R. 1983, ApJ, 274, 717
Woltjer, L. 1972, ARAA, 10, 129
Woosley, S.E., & Weaver, T.A. 1995, ApJS, 101, 181
Wu, K. 2001, PASA, in press (astro-ph/0103157)
Wu, K., Tennant, A., Swartz, D., & Ghosh, K. 2001, ApJ, submitted
Wunderlich, E., & Klein, U. 1988, A&A, 206, 47
Zezas, A.L., Georgantopoulos, I., & Ward, M.J. 1998, MNRAS, 301, 915