The Density and Location of the X-ray Absorbing Gas in NGC 3516
Abstract
A new Chandra observation and archival observations by ASCA are used to investigate spectral variations in the Seyfert 1 galaxy NGC 3516 over a period of 7 years. A large change in flux (factor at 1 keV) is observed between an ASCA observation in 1994 and the Chandra observation in 2000, with the source close to the all-time maximum and minimum X-ray flux states, respectively. We find the variations in the observed flux and spectra at these epochs to be consistent with a constant column density of line-of-sight material reacting to changes in the ionizing continuum. The data from the two epochs are consistent with a simple decrease (by a factor 8–10) in the luminosity of a constant 0.5–50 keV slope source and a line-of-sight absorber with an equivalent hydrogen column density of 1021.9 . Intermediate luminosities, sampled during other ASCA observations, are all fitted by the same model with a very small change in spectral index (well below ). In addition, analysis of the long (360 ks) ASCA observation in 1998 shows clear “color” variations that are entirely consistent with this model and are interpreted as due to changes in the opacity of the absorbing gas. The data allow us to put a conservative upper limit of 60 ks on the recombination time which translates to a lower limit of about on the density of the recombining gas and an upper limit of about cm on its distance from the central source. These are the best limits obtained so far on the density and location of the X-ray absorbing gas in a type-1 Active Galactic Nucleus (AGN). They indicate that the absorbing gas is different, in terms of its density and location, from the ionized gas commonly observed in type-II AGN. The Chandra ACIS/LETGS data also reveals a strong (EW=290 eV), unresolved 6.4 keV iron line, a strong O vii 0.561 keV line and a marginally detected N vi 0.419 keV line. The former is interpreted as originating in a large column of gas of lower state of ionization seen in “reflection”, and is consistent with the spectrum at high energies at all epochs. The two others emission lines are probably emitted by the gas also responsible for the line-of-sight absorption.
The Astrophysical Journal, ???:???–???, astro-ph/0112027
1 Introduction
Most low-luminosity Active Galactic Nuclei (AGN) contain significant amounts of circumnuclear gas which modifies the intrinsic X-ray spectrum by introducing strong absorption features, around 1 keV. This gas, which has been named “Warm Absorber” or the “highly ionized gas” (hereafter HIG), must be photoionized and of moderately low temperature (K), as deduced from many detailed studies. Works by Reynolds, (1997), George et al. (1998, hereafter G98) and others show it to be present in some 50–70% of all low luminosity type-I AGN (i.e. broad emission line Seyferts). HIG systems appear to be less common in higher luminosity type-I objects but the statistics are less secure (George et al. 2000). Previous attempts to analyze the gas properties focused on the absorbing columns and the level of ionization. The last property is well described by the X-ray (0.1–10 keV) ionization parameter, (Netzer 1996) which is the ratio of the 0.1–10 keV photon density to the gas density. G98 showed that while objects containing X-ray absorbing systems vary a lot in the column density of ionized gas, there is a surprising uniformity in with most objects clustering around =0.1.
As yet, there is no real indication of the location of X-ray absorbers. Plausible arguments have been made both for kpc scale and for much smaller distances (e.g. Krolik & Kriss 1995, 2001; Netzer 2001 and references therein). Because of that, there is also no information about the mass of the emitting material and its kinetic energy. The best constraints can be obtained by high resolution X-ray spectroscopy yet, the fundamental issues are not resolved in the handful of available sources (e.g. NGC 5548, see Kaastra et al. 2000; NGC 3783, see Kaspi et al. 2001; MCG-6-30-15, see Branduardi et al. 2000 and Lee et al. 2001) despite of the wealth of emission and absorption lines discovered by the new Chandra and XMM-Newton observations.
The target of our study, NGC 3516 (z=0.009) is at a distance of 35.7 Mpc where km s-1 Mpc-1 (Ferruit et al. 1998). This is a moderate luminosity (L erg s-1 during 1994–1998) type-I AGN with typical X-ray properties and a small column ( ) of Galactic absorption. The ASCA based studies of Kriss et al. (1996b), Reynolds (1997) and G98 indicated the HIG has a large absorbing column ( ) and average ionization parameter. Detailed observations with RXTE reveal large variability on long ( days) and short (days) time-scales (Edelson et al. 1999, Markowitz and Edelson 2001). Nandra et al. (1999) reported the presence of a relativistically broadened, variable, Fe 6.4 keV line. A recent paper by Guainazzi et al. (2001), based on BeppoSAX observations, attributed the X-ray variations during 1996–1997 to large columns of cold material moving in and out of the line of sight.
NGC 3516 has been extensively observed in most other wavelength bands. Most relevant to our study are the UV observations (Walters et al. 1990; Kriss et al. 1996a, and references therein; Crenshaw et al. 1999; Huchings et al. 2001) showing strong, multi-component absorption lines superimposed on the broad emission lines like C iv and N v . The absorption lines are highly variable on months to years time scales and suggest gas outflow from the nucleus at a large range of velocities, 0–1300 . Walters et al. (1990), Kriss et al. (1996a) and Mathur, Wilkes and Aldcroft (1997) discussed various aspects of this UV-X-ray relationship.
This paper reports on new, Cycle 1 Chandra observations of NGC 3516. The source happened to be close to its all-time X-ray minimum and hence the signal-to-noise (S/N) is not adequate for a detailed study of emission and absorption lines. However, the very low luminosity provided a unique opportunity to study the time-dependent properties of the absorbing gas and to obtain the first firm limits on its density and location. The new observations are described in §2, the physical model and the time-dependent properties are presented and discussed in §3 and a general discussion is given in §4.
2 Observations and reduction
Chandra observed NGC 3516 on 2000 October 6 for 47 ks with the Low Energy Transmission Grating Spectrometer (LETGS) in the optical path. The “S-array” of the Advanced CCD Imaging Spectrometer (ACIS) was used as the focal-plane detector. A sub-array read-out was employed with a 1.1 sec frame time. Standard (CIAO v2.1) pipeline spectral extraction was performed on the data using the corresponding calibration files (CALDB v2.6). The data were screened for known bad pixels and columns and “bad grade” events were discarded. The screening resulted in a net exposure of 44 ks. In order to corroborate our results from the LETGS -orders, and to improve our signal-to-noise ratio at energies below 1 keV, we have also extracted and analyzed the zeroth-order spectrum. The total number of counts is 6800 for the zeroth-order and 8300 for the combined orders. Background is negligible for the grating spectrum and was not subtracted to avoid corrupting the low S/N low-energy spectrum. Background has been subtracted from the zeroth-order spectrum.
Pile-up of the zeroth-order spectrum, at low energies, may become important, despite the extremely low flux level of the source at the time of observations. Timing analysis, based on a 500 s binning of the zeroth-order data, shows a constant count-rate of 0.16 counts per 1.1 sec frame throughout the 47 ks observation . Thus uncertainties due to pileup are well below the other observational uncertainties. To further test the flux calibration accuracy, we have made a very detailed comparison of the zeroth-order spectrum and the heavily binned 1st-order spectrum. The two are shown in Fig. 1. The comparison shows a good agreement and complete consistency within the observational uncertainties except for a small discrepancy over the 1–2 keV range. This discrepancy has already been noted by others (e.g. Turner et al. 2001) and, despite considerable improvement in instrument calibration, is most probably the result of residual calibration problems with the 1st-order data.
3 The central continuum and the absorbing gas
NGC 3516 has been observed in several optical and IR wavebands (Pogge 1989; Miyaji et al. 1992; Ferruit, Wilson and Mulchaey 1998 and references therein). The central region show extended NLR emission, on a arcsec scale, with clear spiral-arms type structure. X-ray imaging by ROSAT-HRI has been reported in Morse et al. (1995) showing a marginally significant extended emission in the same general direction as the optical line emission. Our zeroth-order Chandra observations clearly show signs of extended nuclear emission. This is beyond the scope of the present paper, which focuses on the new spectroscopic results, and is addressed in a separate publication (George et al. 2002).
3.1 Spectral analysis of the 1994 and 2000 observations
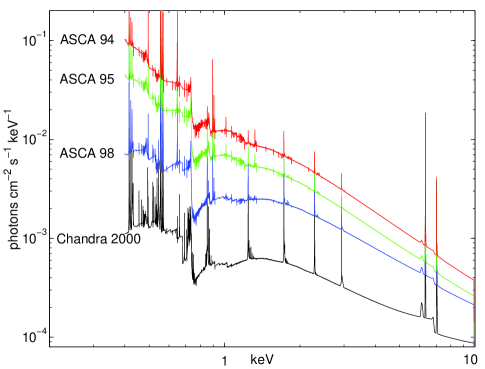
Inspection of the new flux-calibrated data (Fig. 2) shows an unusual X-ray spectrum, with extremely hard continuum for a type-I source and a highly curved low energy spectrum. There are strong and broad absorption features at 0.6–0.9 keV, two strong unresolved emission lines (O vii 0.561 keV and Fe 6.4 keV) and a weak, noisy emission feature at 0.419 keV identified as N vi 0.419 keV. There is also a hint of a weak emission line near 905 eV that could be due to Ne ix. While the latter raises the interesting possibility of a highly-ionized component, the S/N of this feature is so poor that we neglect it in our analysis. Table 1 gives a summary of the more important results of the new observations with their 1 error bars.
![[Uncaptioned image]](/html/astro-ph/0112027/assets/x1.png)
A comparison of the zeroth-order (red points) and the 1st-order spectra of NGC 3516. The combined orders data were binned to a constant resolution. The difference between instruments over the 1–2 keV range is likely due to the known LETGS calibration problem. The insert shows the 0.45–0.6 keV range with the large EW O vii line at 561 eV.
| Table 1: New Chandra results | |
|---|---|
| Flux(2–10 keV) | 1.35 ergs//sec |
| Flux(0.5–10 keV) | ergs//sec |
| EW(O vii 0.561 keV) | eV |
| EW(Fe 6.4 keV) | eV |
| FE(continuum at 6.4 keV) | photon//sec/keV |
| Flux(2–10 keV, 1994) | 7.35 ergs//sec |
![[Uncaptioned image]](/html/astro-ph/0112027/assets/x2.png)
ACIS/LETGS spectrum and model fit. The two first-order spectra are combined to an even resolution of and the model is rebinned to a similar resolution. The reflection component, with the assumed normalization of 32% of the total continuum flux at 6.4 keV, is shown in blue. The deviation between model and data over the 1–2 keV range is attributed to the known LETGS calibration problem (see Fig. 1).
A comparison of the new observations with the 1994-April ASCA spectrum suggests a flux drop by a factor 6.4 at 5 keV and a factor at 0.7 keV. Thus the spectrum has become harder than almost any other known type-I AGN spectra. These changes suggest either extremely large intrinsic slope variations or a large wavelength dependent change in the opacity of the line-of-sight gas. As shown below, the first of these possibilities seems to be inconsistent with the available observations. The following is a detailed discussion of the second possibility based on detailed modeling of the central continuum and the absorbing gas.
We have performed detailed photoionization calculations in an attempt to explain the spectra of NGC 3516 at all epochs. Our model calculations use ION2001, the 2001 version of the photoionization code ION (Netzer 1996; Kaspi et al. 2001 and references therein). The code includes a self-consistent treatment of the ionization and thermal structure of a steady-state ionized gas exposed to an external radiation source. Atomic data include the most recent cross sections for the more abundant elements and all of their strong lines. They also include new f-values for a large number of iron L-shell lines (see Kaspi et al. 2001), newly calculated 1s-2p transitions (Behar and Netzer 2002) and dozens of M-shell iron transitions (Behar, Sako & Kahn 2001). These models are more sophisticated than any other photoionization models applied to this source because of the large number of lines, the inclusion of both emission and absorption features and the accuracy of the atomic data.
Throughout this work we used models of constant density () line-of-sight clouds that are specified by the continuum spectral energy distribution (SED), the equivalent hydgrogen column density of the gas () and the “oxygen ionization parameter” (, defined over the 0.538–10 keV range, see Netzer 2001). As explained below, fitting of the 4–8 keV continuum of all X-ray observations (an energy range which is not affected by absorption) requires two somewhat different SEDs with photon indices of and . The assumed SEDs are specified by broken power-laws between the energies of 0.01, 0.1, 0.5 and 50 eV. In both cases (0.01–0.1 keV)=2. For the SED case, we have (0.1-0.5 keV)=3.3 and for the SED, we need (0.1-0.5 keV)=3.0. The poor S/N below 0.5 keV does not allow clear determination of slope (or SED shape) at those energies and the spectral indices over those ranges represent, for example, the smooth exponential distribution of an EUV source. For clarity and references to other commonly used definitions of the ionization parameter we note that for the case, ::=178:13.1:1 and for the SED, ::=240:15.4:1, where is defined over the 0.1–10 keV range and over the hydrogen Lyman continuum.
The overall normalizations of the above SEDs are based on two observed points, at 1470Å (Kraemer et al., 2002) taken on 2000 October 1, and near 7 keV (our own observations) taken 5 days later. We assume that this UV-X-ray flux ratio has not changed throughout the 7-year period and defer the more detailed discussion to Kraemer et al. (2002). In the X-ray band, the model results are not very sensitive to this constant-SED assumption since the ionization of the X-ray absorbing gas is insensitive to the UV radiation. While the chosen 7 keV point is not affected by absorption, this is not the case for the 1470Å point which is affected by reddening. This issue has been discussed by Kriss et al. (1996a) in their analysis of the 1995 observations of the source. Our adopted value corresponds to E mag., and is somewhat larger than the value adopted by Kriss et al.. It is based on the unusually curved optical-UV continuum of NGC 3516 as observed by HST in 1998 (see Edelson et al. 2000) and may, in fact, represent a lower limit to the line-of-sight reddening. A more detailed discussion of the SED and the issue of reddening is deferred to a future publication (Kraemer et al. 2002).
The following analysis is based on fitting the ASCA and Chandra spectra using standard minimization. Throughout this part we adopt the acceptability criteria suggested by G98 i.e. a model is considered to be an adequate description of the data if P(. We note that two of the model parameters, the covering fraction of the emitting gas and the FWHM of the absorption lines, cannot be constrained by the data yet they can affect the calculated . After testing several cases, we have fixed those to be a covering fraction of 0.4 and pure thermal velocity for the lines. The determination of these parameters must await better S/N observations.
We started by re-analyzing the data obtained during the brightest flux state, that obtained from the ASCA observations in 1994. There is a small flux change during the observations and our analysis refers only to the first 45 ks representing the highest flux. The fit result is very similar to the one obtained by G98 (model B(I) table 5 in their paper). It requires a single full line-of-sight covering HIG cloud with a column density of , =10-2.1 and the SED. We assumed a neutral galactic column of 3 (see G98) and constant gas density of . As argued below, this is consistent with our lower limit estimate of the HIG density. None of the following conclusions depends much on the precise value of . Tests show that the uncertainty on the 0.5–50 keV spectral index is well below 0.2.
The initial fit of the Chandra observations was based on the assumption of no change in SED and a large luminosity drop of the source as inferred from the hard X-ray observations. The basic premise is that all spectral variations are due entirely to flux variations that take place on a time scale much shorter than the seven year period between observations. The fit obtained in this way compares poorly with the observations due to a large excess of flux around 5–7 keV not represented in the model. This can be explained by the fact that we also observed a strong, unresolved ( km/sec) Fe 6.4 keV line with EW eV. This line intensity is clearly too strong to be emitted by the absorbing gas at its 2000 level of ionization and must therefore represent emission from another, unrelated component. The most likely explanation is that the line is due to emission by low ionization gas (i.e. much less ionized than the HIG), such as the one commonly observed by “reflection” in type-II (narrow emission lines) AGN. The typical Fe 6.4 keV EW in type-II sources is about 1 keV. The theoretical value (Matt, Brandt & Fabian 1996; Netzer, Turner & George 1998) is also keV and depends on the gas composition, the continuum slope and the viewing angle of the reflector. For the chosen SED, we expect an EW of 700–1000 eV relative to a pure scattering continuum assuming solar metalicity and intermediate Compton depth reflector. Given the observed Fe 6.4 keV line in NGC 3516, we suggest that its origin is the low ionization reflecting gas and the observed-vs-predicted EW suggests that reflection from this component contributed between 30 and 50 percent to the continuum at 6.4 keV during the Chandra observations. Thus, the factor 5 decrease in the continuum flux observed at 6.4 keV implies a decrease in the true luminosity of the central source by a factor 8 to 10 (if 30% or 50% of the observed continuum is due to reflection, respectively).
To further test the idea of a low ionization component to the Fe 6.4 keV line, we calculated the emission and reflection spectrum of gas with a large column density ( ) and =. Since the location of this component is probably several light-years from the center, and the variability time scale of the central source is several weeks or less, we had to make an additional assumption about the time-averaged flux level of NGC 3516. The present model assumes this to be similar to the high 1994 flux level. Given this level, the luminosity of the reflection component requires a covering fraction of ; a reasonable fraction given the likely geometry. The emission and scattering from this gas must be included when fitting the spectrum at all other epochs. In particular, its contribution is predicted to be non-negligible even at maximum luminosity. We have therefore included it in our final model of the 1994 spectrum and, while the overall fit results are unchanged in terms of SED and column density, we note that between 6 and 10 percent of the flux at around 6.4 keV is due to this component. The fit results are given in Table 2.
| Table 2: fit parameters | ||||
|---|---|---|---|---|
| Observation | d.o.f. | (0.5–50 keV) | ||
| ASCA 94 (high) | 1.07 | 432 | -2.1 | 1.9 |
| ASCA 95 (high) | 1.06 | 429 | -2.3 | 1.9 |
| ASCA 98 (high state) | 0.96 | 373 | -2.5 | 1.7 |
| ASCA 98 (low state) | 0.68 | 373 | -2.6 | 1.7 |
| Chandra 0th order | 0.91 | 263 | -3.2 | 1.7 |
| Chandra ACIS/LETGS | 0.48 | 1932 | -3.2 | 1.7 |
Given this additional reflection component, with scattered continuum and unresolved Fe 6.4 keV line, we have attempted another spectral fitting of the Chandra observations with the above SED. The fit is statistically acceptable (see Table 2) suggesting that the reflection component is, indeed, very important for explaining the spectrum at low flux levels. For reasons related to the 1998 ASCA observations (see below) we have also attempted a fit with the SED. This continuum is also consistent with the 2000 Chandra observations. Fig. 2 shows the SED model on top of the new observations. Inspection of the diagram, and standard statistical analysis (Table 2) clearly demonstrate the applicability of this approach (note however the discrepancy over the 1–2 keV range are due to the known LETGS calibration feature). In particular, we conclude that the very large flux drop, by a factor of below 1 keV between 1994 and 2000, is entirely consistent with the constant SED continuum and the dramatic increase in the absorption opacity due to the decreasing level of ionization.
The noticeable flux variations correspond, according to the model, to a very large change in fractional ionization of the gas. While the strongest absorption features in 1994 are due to Ovii and Oviii, most of the opacity in the 0.6–0.9 keV energy range, in 2000, is due to Ov, Ovi and Ovii. According to the model, the continuum role-over below 0.6 keV is mostly due to elements, in particular carbon and helium. In addition, the model successfully predicts the observed N vi 0.419 keV and O vii 0.561 keV emission line intensities, given the observational uncertainties and assuming the above mentioned covering fraction by HIG clouds with properties similar to those of the line-of-sight material. This by itself is not a conclusive evidence for the absorber’s properties since the low ionization reflecting component contribution to the O vii 0.561 keV line can approach the observed line intensity given the uncertain level of ionization of the reflecting gas.
3.2 Spectral analysis of the 1995 and 1998 observations
The seven-year history of ASCA, BeppoSAX and Chandra observations of NGC 3516 provide a unique opportunity to test the suggestion that all observed spectral variations are caused by a single variable, the unattenuated X-ray flux. To this end, we have collected most of the previous ASCA observations of the galaxy and fitted, each one, in the same way as described for the 2000 data. The only data set not to be analyzed is from December 1999. These data suffer from severe calibration problems at low energies where accurate spectra are required to test our model.
The results of fitting the ASCA data are as follows:
- The 1995 data set:
-
The mean 0.7–10 keV 1995 luminosity is about a factor 1.5 lower than the 1994 luminosity and the analysis refers to the first, higher flux part of the observations to avoid the continuum variations. We have kept the (0.5–50 keV) SED and scaled by this factor to obtain a satisfactory fit (Table 2) to the data. Thus the observed 1995 spectrum is entirely consistent with our previous assumption.
- The 1998 data set:
-
NGC 3516 was monitored continuously for about 360 ks during 1998 (see Nandra et al. 1999 for details of this campaign). The average 6.4 keV continuum flux was about 2.5 higher than the Chandra 2000 flux, suggesting an intrinsic hard X-ray continuum some 3–4 times more luminous than the 2000 continuum. The observations show a large (50%) peak-to-peak variations on a time scale of several hours.
Our attempt to fit the mean 1998 spectrum with the SED and the same obscuring column, yielded unsatisfactory results. We found that, depending on reflector luminosity, the keV slope is flatter than in 1994 and 1995, with . The result is unchanged when splitting the data into high and low states. We conclude that the source has undergone a real change in slope but by no more than , between 1995 and 1998 (we re-emphasize that the 1994 0.5–10 keV continuum is significantly steeper than ). However, assuming the SED and normalizing by the continuum flux ratio at 6.4 keV between 1998 and 2000, we can obtain satisfactory fits to the high and low 1998 spectra.
The small change of slope at high energies in 1998 is the main motivation for considering two, slightly different SEDs for fitting the 2000 observations. The quality of the Chandra spectra is not good enough to distinguish between the two since both give satisfactory fit to the observations. However, we should note that the success of both models depend crucially on the assumed 0.1–0.5 luminosity since the (observationally unknown) flux in this band determines the opacity through the ionization of the elements. The assumed 0.1–0.5 keV slope for both SEDs is a direct result of those constraints and the need to adequately fit the data above 0.5 keV.
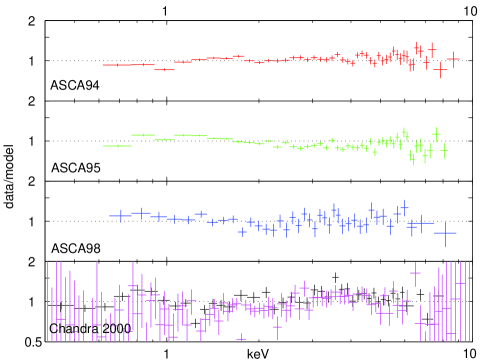
To summarize, our model fittings suggest (0.5–50 keV)=1.9 in 1994 and 1995 becoming flatter, by in 1998. The 2000 observations are consistent with either one of those SEDs. Fig. 3 shows our best models and data-to-model ratios for all data sets (1994, mean-1995, low-1998 and 2000). Table 2 gives the fit parameters and the calculated , all in agreement with our acceptability criteria.
3.3 Color Analysis of the 1998 Data
Given the satisfactory spectral fits, we can now look for the shortest variability time corresponding to a detectable change in the gas level of ionization. The 1998 data set is most suitable for this since the high energy continuum varied substantially during the observations. Unfortunately, it is difficult to obtain meaningful constraints on the time scales involved using complete spectral fitting since it requires integrating over at least 20-30 ks; a period which is long considering the observed variations in 1998. Therefore we adopted the following approach: we have fitted the spectra at two epochs representing local minima and maxima separated by 60 ks (see details below) and we have also used a complementary method based on broad-band photometry. The broad-bands approach follows closely the “color analysis” method discussed in Netzer, Turner & George (1994) and shown to be useful for analyzing absorbed X-ray spectra. The method allows the analysis of much shorter data trains with much improved S/N and considerably better time resolution. We chose two bands, XM1 which gives the integrated flux over the 0.7–1.2 keV range and XM3 that covers the 4–10 keV range. The fluxes in these band were measured for the entire 1998 data set in bins corresponding to one orbit ( sec on target integration) and the “color” (or “softness ratio”) XM1/XM3 was calculated for each of those . The results are presented as a function of time, in Fig. 4.
Inspection of Fig. 4 demonstrates the close agreement of the XM1 and XM3 flux variations. Cross correlation analysis shows the two bands to be highly correlated, with no measurable time lag, confirming the earlier result of Edelson et al. (2000). This tight correlation must be due to intrinsic continuum flux variations. The noticeable changes in color, over time scales of a few orbits, are also very clear. We suggest that they are caused by real changes in the absorber’s opacity because of the following reasons: First, we have verified, by detailed spectral fitting, that the change of hard continuum spectral index between minimum and maximum flux levels during 1998 is less than . This corresponds to a too small change (factor of less than 1.1) to be responsible to the observed variations in XM1/XM3 (factor about 1.3). Second, our model calculations (see Fig. 4) are entirely consistent with the variability amplitude of XM1/XM3 confirming that the changing opacity is the main driver for the observed changes. Cross correlation analysis suggests a short delay between the XM3 and the XM1/XM3 light curves but this is not statistically significant.
We conclude that a significant change in level of ionization has occurred on a time scale of a few orbits. A conservative upper limit for the time of significant XM1/XM3 change is 60 ks, which is roughly the time between the flux level near t=240 ks and the minimum near t=300 ks. Direct spectral fittings of these two epochs, assuming variations in direct proportion to the observed flux changes, are entirely consistent with this idea (see Table 2). They produce acceptable fits and confirm that pure continuum slope variations cannot explain the observed effect (note again the limitation of spectral fitting that requires integration over many orbits to achieve adequate S/N). In particular, the calculations show that the dominant stage of ionization is Ovii, with fractional ionization of about 0.8, and most of the low energy opacity variations are due to the increasing opacity of Ovi following the continuum flux variations.
The determination of , the time associated with the increase in the Ovi abundance until it becomes a significant opacity source (i.e. to exceed a fractional ionization of 0.1), requires full time-dependent solution of the ionization and recombination equations. In particular the commonly used 1/e time scale, referred to as “recombination time”, is not necessarily a good measure under such conditions. However, recombination onto Ovi provides a good estimate for , given known ionization equilibrium solution and the fractionl ionization of Ovi and Ovii. Using these fractions, the known recombination rates at K (the temperature obtained from the model) and neglecting di-electronic and three-body recombination that are not important at these densities and temperatures, we find
| (1) |
where is the electron temperature in units of 105 K. This gives a lower limit of about for the recombining gas density. Combined with the known X-ray luminosity during the 1998 observations, we derive an upper limit on the distance of the absorbing gas of about cm. Given the range in density and location, and noting the conservative limits on both, the preferred geometry of the absorbing material is that of a thin shell with
4 Discussion
4.1 Alternative models
While the agreement between the 7 years of observations and the model presented here is satisfactory, we have nevertheless considered various alternative explanations.
First, we considered the possibility that all observed changes are due entirely to variations in continuum slope. Spectral fits show that this requires a slope of in 2000 and the same as derived for the 1994 observations (i.e. no change in opacity between the two epochs). This scenario corresponds to a case where the absorbing gas is of very low density, such that its level of ionization reflects the average luminosity of the source (which is similar to the 1994 luminosity given the required ). The major problem is that, at this ionization parameter, the emission lines produced by such gas are much stronger and more highly ionized compared with the lines observed by Chandra. Such lines would easily be detected by the ACIS/LETGS observations.
A second possibility is that the absorbing gas is indeed responding to the incident flux yet there are also large slope variations associated with the large changes in luminosity. Slope variations are claimed to take part in many AGN (Markowitz and Edelson 2001 and references therein) and are well known in galactic X-ray sources. It is therefore important to consider their effect on the 1994–2000 spectra of NGC 3516.
As illustrated by the detailed analysis of the 1998 and 2000 spectra, and as confirmed by various other tests, we found it practically impossible to identify a consistent model with large spectral index variations that fits the new observations. The main reason is the observational constraints on the hard X-ray flux. Since the hard X-ray continuum is directly observed, we can easily calculate the change in associated with any assumed change in . Since the SED and the level of ionization of the gas, during 1994, are known, we can easily calculate the effect such changes will have on the line-of-sight gas opacity. As explained, our model assumed no (or very small) change in slope and hence its predictions represent the smallest possible changes in level of ionization. Thus, the assumption of additional continuum flattening is translated to a larger change in and hence larger opacity at times of lower luminosity. The computations show that such an effect is so large that it will produce a low luminosity spectrum which is inconsistent with the Chandra observations. In fact, as demonstrated earlier, the largest change of 0.5–50 keV spectral index that is consistent with the single absorber model is about .
Another consistency check on the model is the comparison between UV and X-ray observations. NGC 3516 was observed by HST, HUT, and FUSE on numerous occasions,
![[Uncaptioned image]](/html/astro-ph/0112027/assets/x5.png)
Binned (two-orbits) XM1 and XM3 fluxes, and XM1/XM3, as functions of time for the 1998 ASCA observations. A smooth model was fitted to the XM3 observations (solid line) and the model predictions are shown on the XM1/XM3 diagram.
some of these simultaneous with ASCA and Chandra observations. While a detailed discussion of the UV-X-ray relationship is deferred to a later paper, we note that the overall ranges in UV and hard X-ray luminosities is very similar indicating small variations in the SED.
Finally, combined luminosity, SED and column density variations may also be considered. The number of free parameters in such models is so large that additional constraints, from a large number of emission and absorption lines, are required to assess their reality.
Several other papers discussed the X-ray spectrum of NGC 3516 and suggested alternative explanations for its spectral variations. Kriss et al. (1996b) suggested a range of ionization parameters and column densities. Kolman et al. (1993) suggest a connection with the BLR and Mathur et al. (1997) discuss the UV-X-ray absorption connection. A recent BeppoSAX-based study, reported in Guainazzi et al. (2001), discusses two epochs during 1996–1997, separated by 7 months and showing large spectral variations similar to the ones discussed here. The authors adopted a completely different approach by considering both warm and cold absorbers with different column densities. Their interpretation of the two different spectra is very different from ours involving non-equilibrium situations, similar to the model proposed by Nicastro et al. (1999), and large changes of spectral index. Their favorable model includes cold absorbing clouds of large columns ( ) moving in and out of the line of sight. According to the model, the observed variations are due to the onset of substantial cold absorption during times in which the properties of the primary continuum do not change.
There are observational limitations and theoretical problems in the Guainazzi et al. (2001) interpretation. The use of absorption edges instead of a self consistent photoionization model, and the assumption of a large change of slope, prevented them from testing the simpler idea that the apparent changes in spectral index are due to changes in the level of ionization of the absorber. Visual inspection of their data (Fig. 1 there) suggests, infact, that the two BeppoSAX observations can be fitted into the same sequence of ionization vs. luminosity presented in Fig. 3.
4.2 Ultraviolet emission and absorption lines
The model proposed here has important observational consequences to the UV properties of the source at minimum light. Given the model assumptions we find large column densities of Ovi, Nv and Civ and hence strong emission and absorption lines produced by these species during the Chandra observations. The exact values depend on the assumed (unobserved) SED and will be discussed, together with new HST/STIS data, in a future publication.
Mathur et al. (1997) discussed possible relationships between X-ray and UV absorbers in NGC 3516. Their general picture is similar in some ways to the global properties of the source discussed here, but the actual values they have derived for the absorbing column and the ionization parameter are quite different from ours. Much of the difference is likely due to the limited resolution of the ROSAT-PSPC 1992 data they used for their analysis. They have noticed a large change of slope in earlier observations of the source but did not interpret it as due to the change in opacity.
An interesting aspect of the Mathur et al. study is the suggested link between the EUV and X-ray properties of the absorber. In particular, they studied the possibility of an outflowing absorbing gas that produce both UV and X-ray absorption and made a clear prediction of the “disappearance” of such gas, over a period of years, due to the constant increase in its level of ionization. Our Chandra observations are in clear contradiction to this prediction suggesting that the increased opacity in 2000 may be from the same gas responsible for the strong absorption a decade earlier.
4.3 The location, density and mass of the HIG
Our results produce the best limits obtained so far on the density and location of the HIG in type-I AGN since they are based on the internal consistency of several observations fitted with a very simple model over a very large energy range. The only important variable of the model is the ionization parameter which is normalized by the observed high energy continuum flux in 1994. As argued above, small intrinsic spectral index variations are probably seen but their effect is far smaller than the change due to absorber’s opacity. Our observations and model fittings show the absorber to lie well inside the central 1pc and perhaps much closer in, at the BLR location or perhaps even closer.
There were several previous attempts to deduce the HIG location in AGN. Guainazzi et al. (1996) used a long-look ASCA observation of NGC 4051 to claim a significant change in the Ovii edge, over a time scale of seconds during which there was no change in the Oviii edge strength. However, they did not show a realistic model to explain this change. Guainazzi et al. (1998) and Uttley et al. (1999) observed NGC 4051 in a very low state that allowed them to place a lower limit on the distance of the cold reflector. Komossa & Meerschweinchen (2000) investigated HIG systems in four radio-loud quasars and NLS1s, using ROSAT data, and suggested edge variations. While the claimed variability is probably real, the ROSAT-PSPC resolution does not allow accurate modeling of the absorption features. Moreover, so far there is no positive detection of HIG with “typical” AGN absorption features in any NLS1. Reynolds and Fabian (1995) and Otani et al. (1996) made detailed studies of the absorption features in MCG-6-30-15 and claimed an Oviii edge change on a time scale of sec. They also claimed that the Ovii edge was observed but did not change during the same time which caused them to propose that this feature is due to gas much further away from the central continuum. While the observed variations and the associated time scales are possible, the interpretation is highly questionable in view of the new Chandra and XMM-Newton observations of this source (Branduardi et al. 2000; Lee et al. 2001). In particular, it is not at all clear whether the observed 0.7–0.9 keV absorption-like features are due to the Oviii and Ovii edges suggested by Otani et al.. Infact, they may be related to a complex of broad emission lines and much narrower and weaker absorption lines (Branduardi et al. 2000). A more consistent physical model is certainly needed to understand this source.
Our new findings are of great importance for AGN study since they are the first to show clear and direct changes of the absorber properties in response to changes in source luminosity. The time span is very long (7 years) and the variability amplitude very large (a factor of ). The lack of clear distance indicators made it impossible, until now, to distinguish between HIG systems observed in absorption in type-I sources and the ones observed in emission in type-II sources. Given the deduced location in NGC 3516, and a plausible geometry of the obscuring medium (torus?) in type-II sources, it is evident that the system we have observed is very different, in location and other properties, from the extended X-ray emission line gas in type-II AGN. Unfortunately, there is no precise mass estimate for this gas. The combined density and location we derived give an upper limit to the mass of about 80 (which is orders of magnitudes larger than the mass of the ionized gas in the BLR) but much smaller values are entirely consistent with this estimate.
4.4 Neutral reflectors and relativistic Fe 6.4 keV lines
Important ingredients in our model are the line and continuum contributions from the low ionization reflector. As explained, this component is necessary to explain the observed Fe 6.4 keV at minimum flux and is consistent with the idea of a large column-density torus like the ones suggested for type-II sources. Interestingly, this component contributes a significant amount to the observed flux even at maximum (1994 level) luminosity: about 10% of the 6.4 keV flux and EW(narrow Fe 6.4 keV) eV under the assumption of 50% contribution at 6.4 keV during the Chandra observations. This has important consequences to the intensity and profile of the so-called “relativistic” Fe 6.4 keV line in NGC 3516 and other AGN. In particular, the claimed Fe K line in this source (e.g. Nandra et al. 1999) has a typical broad red shoulder and a sharp blue side. The cold gas contribution, if similar to that found here, peaks at 5–7 keV and will have a significant effect on the relativistic line intensity. The detailed analysis of this idea is beyond the scope of the present work.
References
- (1) Behar, E., & Netzer, H., 2002 (submitted to Ap. J.)
- (2) Branduardi-Raymont, G., Sako, M., Kahn, S.M., Brinkman, A.C., Kaastra, J.S., & Page, M.J., 2001, A&A, 365, 162
- (3) Edelson, R., & Nandra, K. 1999, Ap. J., 514,682
- (4) Edelson, R., Koratkar, A., Nandra, K., Goad, M., Peterson, B.M. , Collier, S., Krolik, J., Malkan, M., Maoz, D., O’Brien, P., Shull, J.M., Vaughan, S., Warwick, R., Ap. J., 534, 180
- (5) Ferruit, P., Wilson, A.S., & Mulchaey, J.S., 1998, Ap. J., 506, 646
- (6) George, I.M. Turner, T.J., Netzer, H., Nandra, K., Mushotzky, R.F., & Yaqoob, T. 1998, ApJ Supp., 114, 73 (G98)
- (7) George, I.M., Turner, T.J., Netzer, H., Kraemer, S.B., Ruiz, J., Chelouche, D., Crenshaw, D.M., Yaqoob, T., Nandra, K., & Mushotzky, R.F., 2002 (submitted to Ap. J.)
- (8) Guainazzi, M., Mihara, T., Otani, C., Matsuoka, M. 1996, PASJ, 781
- (9) Guainazzi, M., et al., 1998, MNRAS,301,L1
- (10) Guainazzi, N., Marshall, W., & Parmer, A.N. 2001, M. N. R. A. S., 323, 75
- (11) Kaastra, J.S., Mewe, R., Liedahl, D.A., Komossa, S., & Brinkman, A.C. 2000, A&A354, 83
- (12) Kaspi S., Brandt, W.N., Netzer, H., Sambruna, R., Chartas G., Garmire, G.P., & Nousek, J. 2000 Ap. J., 535, 14
- (13) Kaspi S., Brandt, W.N., Netzer, H., George, I.M., Chartas G., Behar, E., Sambruna, R., Garmire, G.P., & Nousek, J. 2000 Ap. J., 535, 14
- (14) Kolman, M, et al., 1993, Ap. J., 403, 592
- (15) Komossa, S, Meerschweinchen, J., 2000 A&A, 354, 411
- (16) Kraemer, S.B. et al., 2002 (in preparation)
- (17) Kriss, G., Espey, B.R., rolik, J.H., Tsvetanov, Z, Zheng, W., & Davidsen, A.F., 1996a, ApJ, 467, 622
- (18) Kriss, G, et al. 1996b, ApJ, 467, 629
- (19) Kriss, G, et al., 2001, (Proceedings of the Catholic University meeting on Mass Outflow, Crenshaw, Kraemer & George eds., in press)
- (20) Krolik, J., & Kriss, G, 1995, Ap. J., 447, 512
- (21) Krolik, J., & Kriss, G, 2001 (astro-ph 0107356)
- (22) Lee, J.L., Ogle, P.M, Canizares, C.R., Marshall, H.L., Schulz, N.S., Morales, R., Fabian, A.C., & Iwasawa, K., 2001, Ap. J., 554, L13
- (23) Markowitz A., Edelson, R., 2001, Ap. J., 547, 684
- (24) Mathur, S., Wilkes, B., & Aldcroft, T. 1997, Ap. J., 478, 18
- (25) Miyaji, T., Wilson, A.S., & Perez-Fourno, I., 1992, Ap. J., 385, 137
- (26) Morse, J.A., Wilson, A.S., Elvis, M., & Weaver, K.A., 1995, Ap. J., 439, 121
- (27) Nandra, K., George, I.M., Mushotzky, R.F., Turner, T.J., & Yaqoob, T. 1999,Ap. J., 523, 17
- (28) Netzer, H., 1996, ApJ, 473, 781
- (29) Netzer, H., 2001, in “The Starburst-AGN Connection” Aretxaga, Kunth & Mujica eds.), World Scientific, p117
- (30) Netzer, H, Turner, T.J., & George, I.M., 1994, Ap. J., 435, 106
- (31) Nicastro, F., Fiore, F., & Matt, G, 1999, Ap. J., 517, 108
- (32) Otani, C., Kii, T., Reynolds, C.S., Fabian, A.C., Iwasawa, K., Hayashida, K., Inoue, H., Kunieda, H., Makino, F., Matsuoka, M & Tanaka, Y., 1996 PASJ, 48, 211
- (33) Pogge, R., 1989, Aj, 98, 124
- (34) Reynolds, C.S,. 1997, MNRAS, 286, 513
- (35) Reynolds, C.S,. & Fabian, A., 1995, MNRAS,273, 1167
- (36) Uttley, P.; McHardy, I. M.; Papadakis, I. E.; Guainazzi, M.; Fruscione, A. 1999, M. N. R. A. S., L6
- (37) Walters, R, Ulrich, M-H, Courvoisier, T.J., & Buson, L.M., 1990., A& A, 233, 53