The Multiple Stellar Populations in Centauri
Abstract
In this contribution I am going to present some preliminary results of a high-resolution spectroscopic campaign focussed on the most metal rich red giant stars in Cen. This study is part of a long term project we started a few years ago, which is aimed at studying the properties of the different stellar populations in Cen. The final goal of the whole project is the global understanding of both the star formation and the chemical evolution history of this complex stellar system.
Dipartimento di Astronomia, Università di Bologna, Via Ranzani 1, I-40127 Bologna, Italy
European Southern Observatory, K. Schwarzschildstr. 2, D-85748 Garching bei München, Germany
1. The Discovery of the RGB-a
The first surprising result that we got in the study of Cen came from the wide field photometry that we performed in 1999 at the 2.2 m ESO-MPI telescope (La Silla, Chile), equipped with the WFI (Wide Field Imager) mosaic camera.
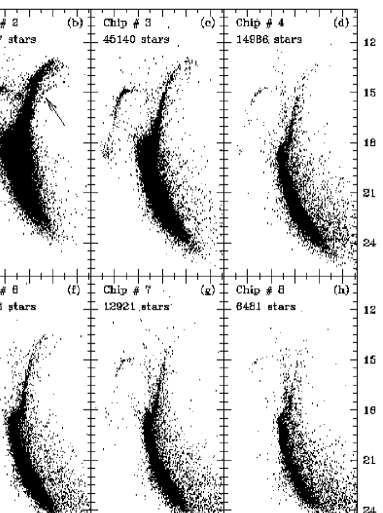
Figure 1 shows the CMDs for each of the 8 WFI chips separately. The cluster is roughly centered on chip #2. More than 230,000 stars have been plotted: to our knowledge, this is the largest stellar sample ever observed in Cen. The most striking feature of this CMD is the existence of a complex structure in the brighter part of the Red Giant Branch (RGB): at least two main components are visible. Particularly notable is the presence of a narrow sequence (see also Lee et al. 1999), significantly redder and more bent than the bulk of the “main” RGB stars, which we call the anomalous RGB (hereafter RGB-a). Note that the RGB-a is visible only in the CMD from chip #2 (where the cluster center is located) and to a much lesser extent in the nearby chip #1 and possibly chip #3.
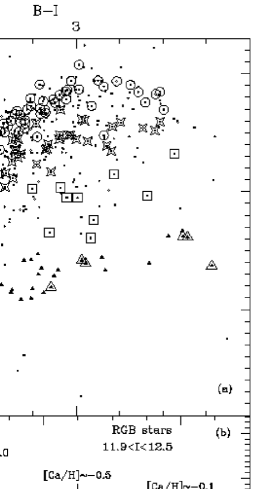
The morphology of the RGB-a and its position in the CMD strongly suggest that it is populated by stars much more metal rich than the Cen bulk population. In order to get a first indication about the metal content of the RGB-a stars, we have combined our catalog with the extensive low resolution spectroscopic survey carried on by Norris et al. (1996), based on the infrared calcium triplet indicator: Figure 2 shows the metallicity distribution of the red giants in Cen, obtained by using the distance of each star from the mean ridge line of the dominant, metal poor population as a sort of metallicity indicator (Figure 2, Panel (b)). We can thus identify three different RGB components, or sub-populations:
-
•
RGB-MP: the dominant, metal poor population, with [Ca/H], which drives the average metallicity of the whole cluster.
-
•
RGB-MInt: the intermediate metallicity population, with [Ca/H] and a long extended tail reaching up to [Ca/H].
-
•
RGB-a: the anomalous, newly discovered population, with [Ca/H], which represents the extreme metallicity end of the cluster distribution, and comprises of the whole RGB population.
Thus, we have photometrically isolated a distinct sub-population, the RGB-a, whose sharp and clear-cut shape in our CMD allows us to select a representative sample of stars for high-resolution spectroscopic follow up, in order to obtain their detailed abundance pattern.
2. The UVES Spectroscopic Campaign
The discovery of the RGB-a poses a number of questions that need to be answered, in the light of what we already know about the chemical and dynamical properties of the RGB stars in Cen, to put this new stellar population in the context of the star formation and/or merging history of the whole cluster.
In order to completely characterize the chemical properties of the RGB-a stars, we need to obtain high resolution, high signal-to-noise spectra for a sufficient number of stars. The ideal tool is UVES (UV-Visual Echelle Spectrograph) mounted on the VLT (Very Large Telescope) at Paranal, in Chile. With this instrument we can obtain a resolution of 45000, comparable to the latest studies (like Smith et al. 2000), and we can easily and fastly achieve S/N100–150.
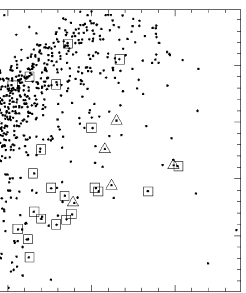
Our observing programme was split in two different observing runs: a pilot study on six RGB stars, that was carried out in june 2000 (Run A) and a more extensive survey of 23 additional stars, that was successfully carried out in april–may 2001 (Run B). The main goals of this project are the following: (a) to sample adequately the whole extension of the RGB-a and (b) to observe a few RGB-MP and RGB-MInt stars in common with previous high resolution studies, both to have a feeling for the soundness of our results and, lately, to merge all the existing databases in a homogeneous way. Figure 4 shows the position of the programme stars along the RGB.
In the following sections I will briefly describe the method used and report on some preliminary results for the six stars of the pilot survey, while the complete analysis of the whole sample (29 stars in total) is still under way.
3. Observational Material
We selected our programme stars for Run A among the metal-richest stars in Cen (see Table 1). Three of them, stars ROA 300, WFI 222068 and WFI 222679, belong to the anomalous RGB-a, while the other three belong to the intermediate metallicity population, the RGB-MInt.
None of the six stars has been observed before with high-resolution spectroscopy (), except for the RGB-MInt star ROA 371 (see Table 2), that has been studied by Paltoglou & Norris (1989), Brown et al. (1991), Vanture et al. (1994) and Norris & Da Costa (1995), and for this reason is the ideal comparison object. ROA 371 has always been considered to be a peculiar star, showing strong BaII and SrII lines (Dickens & Bell 1976), and a mild variability (Cannon & Stobie 1973).
| Star | – | [Fe/H] | Pop | |||||
|---|---|---|---|---|---|---|---|---|
| ROA 300 | 12.71 | 1.55 | 3900 | 3900 | 0.9 | 1.3 | -0.78 | RGB-a |
| WFI 222068 | 12.95 | 1.49 | 3950 | 4000 | 1.1 | 1.3 | -0.49 | RGB-a |
| WFI 222679 | 13.26 | 1.33 | 4150 | 4100 | 1.2 | 1.4 | -0.54 | RGB-a |
| ROA 211 | 12.43 | 1.44 | 4000 | 4000 | 0.8 | 1.9 | -1.02 | RGB-MInt |
| ROA 371 | 12.71 | 1.41 | 4050 | 4000 | 0.7 | 1.5 | -0.95 | RGB-MInt |
| WFI 618854 | 13.26 | 1.06 | 4500 | 4600 | 1.2 | 1.5 | -1.20 | RGB-MInt |
4. Abundance Analysis
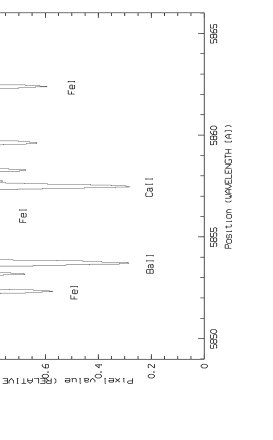
Run A was successfully completed in june 2000, by obtaining high-resolution () echelle spectra with S/N ranging from to (an example of the quality of these spectra is displayed in Figure 3). The monodimensional spectra were extracted using the UVES ESO pipeline, then continuum normalized and corrected for telluric absorption with IRAF111IRAF is distributed by the National Optical Astonomy Observatories, which is operated by the association of Universities for Research in Astronomy, Inc., under contract with the National Science Foundation.. All of the six stars turned out to be members of Cen on the basis of the radial velocity derived from our spectra.
A first estimate of the and has been derived from absolute magnitudes and dereddened colors of our programme stars (see Table 1), obtained from Pancino et al. (2000), by assuming and , according to Harris (1996) and by using the temperature scale calibration and bolometric corrections from Alonso et al. (1999).
The abundance analysis was done on a set of reliable and unblended spectral absorpion lines that span a range in strength, excitation potential and wavelength. The results presented here are based on 94 FeI lines, 10 FeII lines, 17 CaI lines and 10 SiI lines in the wavelength range Å. The atomic data and are taken from the available literature among the most recent laboratory measures: we used mainly the NIST222NIST (National Institute of Standards and Technology) Atomic Spectra Database, Version 2.0 (March 22, 1999), http://physics.nist.gov/cgi-bin/AtData/main_asd. database and Nave et al. (1994) for iron. Equivalent widths were measured with IRAF, by gaussian fitting of the line profile on the local continuum. The gaussian profile is a good approximation for these low-gravity, cool stars, if one avoids strong lines. For the coolest stars we chose not to measure any atomic line inside the prominent TiO bands.
The abundance calculations were made using an extension of the OSMARCS grid of flux-constant, plane parallel, LTE model atmospheres for M giants and supergiants calculated by Plez (1992), in the [Fe/H] to range (Plez 1995, private communication). First estimates of the microturbulent velocity (and of [Fe/H]) were derived from curves of growth for FeI and FeII.
We then refined our parameters set by enforcing simultaneously the following conditions: (a) was determined by imposing that strong and weak FeI lines give the same abundance; (b) the temperature was constrained by imposing excitation equilibrium for FeI; (c) the surface gravity was determined by imposing ionization equilibrium between FeI and FeII. The resulting best parameters for the six programme stars are shown in Table 1: temperatures and gravities resulting from our analysis are close to the photometric values, and we will adopt them for the rest of our treatment.
| PN89 | B91 | V94 | ND95 | Here | |
| 70–150 | 140 | ||||
| 4000 | 4000 | 4000 | 4000 | 4000 | |
| 0.9 | 0.9 | 0.9 | 0.9 | 0.7 | |
| 2.5 | 1.5 | 2.2 | 1.6 | 1.5 | |
| [Fe/H] | -1.37 | -0.9 | -1.00 | -0.79 | -0.95 |
The results we obtained can be directly compared with previous studies, since star ROA 371 has been observed before by four different groups, with the results reported in Table 2. The stellar parameters of the different studies are in good agreement with each other, and the [Fe/H] abundance determinations are consistent within the uncertainties.
Moreover, we observed star ROA 300 with low and intermediate resolution spectroscopy in the infrared wavelength range with SOFI (see the contribution by Ferraro, Pancino & Bellazzini, this volume) and we obtained a preliminary abundance of [Fe/H]-0.9, again in good agreement, within the uncertainties, with the value obtained from the UVES spectra.
5. Preliminary Results

The values listed in Table 1 are the first direct estimate of the chemical abundance for stars belonging to the RGB-a population ever obtained using high-resolution spectroscopy. By taking a straight average for the three RGB-a stars we find: [Fe/H]= and [Ca/H]=. This result confirms the conclusion by Pancino et al. (2000) that the RGB-a is the extreme metal rich component of the Cen stellar mix. It is interesting to note that the abundances obtained here are lower than previous estimates based on calcium triplet measures (see above). However, it should be noted that calcium triplet calibrations are usually quite uncertain at the high metallicity end: Norris et al. (1996) explicitly warned the reader on the fact that their metal-rich stars results are based on an extrapolation of their calibration and should thus be treated with caution.
However, the most interesting result that we got from the analysis of the six spectra presented here is the different -enhancement measured for the two sub-populations. We found [Ca/Fe]= and [Si/Fe]= for the three RGB-MInt stars, in perfect agreement with the expected -enhancement for globular cluster stars, and only [Ca/Fe]= and [Si/Fe]= for the three RGB-a stars in our sample. This is the first evidence that stars with significant low enhancement do exist in Cen. Note that both Norris et al. (1996) and Smith et al. (2000), who analyzed red giants in Cen with metallicities up to [Fe/H] and [Fe/H] respectively, found no evidence of decreasing Calcium (or any other -element) enhancement with increasing metallicity.
The effect is also illustrated in Figure 5, where their studies (empty symbols) are compared with our results (filled symbols). Figure 5 clearly shows the tendency of decreasing [Ca/Fe] and [Si/Fe] with increasing metallicity for the 6 stars presented here. The solid line marks the Galactic [/Fe] relation as can be desumed from Edvardsson et al. (1993) and Gratton (1999).
If the result shown in Figure 5 is confirmed by larger samples of metal rich stars, we have found the first indication that the medium from which the RGB-a stars have formed has been previously enriched by type Ia Supernovae ejecta.
6. Implications for the formation scenarios in Cen
A detailed discussion of the chemical evolution of Cen is beyond the purpose of this contribution, however some obvious implications of the results presented above deserve a short comment. How do the new results presented here on the RGB-a population compare with the most widely accepted scenarios for the formation of Cen?
There are two main scenarios that have been proposed to explain the variety of stellar populations observed in Cen, both based upon non-negligible observational evidences: Case a) the most popular scenario proposes that Cen is a complex stellar system (possibly a dwarf galaxy, or the remnant of a formerly larger galaxy; see Freeman 1993) that was able to self-enrich during its star formation history; Case b) it has also been suggested (Icke & Alcaino 1988; Norris et al. 1997; Pancino et al. 2000) that some of the present stellar components of the cluster may have formerly belonged to an external, smaller stellar system that merged with the main body of Cen. Let’s discuss the two separately.
Case a) Previous abundance studies on the RGB-MP and RGB-MInt stars in Cen, like the ones by Norris et al (1995) and Smith et al. (2000), show that: (i) the enhancement is constant ([/Fe]+0.3) with metallicity, implying that part of the SNe II ejecta have been retained by the cluster; (ii) there is no evidence for a contribution from SNe Ia for any of the stars studied so far ([Fe/H]-0.8) and (iii) the overabundance of -process elements is increasing with metallicity, probably because the rich (and presumably younger stars) have been enriched by the slow winds of AGB intermediate mass stars.
While the [/Fe] overabundance indicates that a major interstellar medium enrichment by type II supernovae took place over a relative short timescale ( 1 Gyr), the -process element overabundance indicates that the enrichment by AGB stars took place over timescales ranging from a few hundred million and a few billion years, depending on their actual progenitor mass.
Moreover, the metal poor and intermediate populations show no sign of enrichment by type Ia supernovae ejecta. This could be explained both with a star formation process short enough to end before the onset of type Ia supernovae, or, in case of longer star formation timescales, by assuming that type Ia supernovae winds efficiently removed most of their own products (Smith et al. 2000).
Hence, if we assume that indeed the detailed chemical composition of all of the giants in Cen can be explained by pure self-enrichment, then the evidence we presented above tells us that the most metal rich (and thus somewhat younger) population of Cen has been enriched by supernovae type Ia ejecta. In this scenario we have detected the “knee” of the [/Fe] relation, a very valuable constraint to the chemical evolution of the whole stellar system (McWilliam 1997). The canonical interpretation of this feature in the [/Fe] relation is that all the stars poorer than the knee should have formed in a relatively short timescale of the order of 1 Gyr. However, these timescales are still uncertain, see for example Matteucci & Recchi (2001) for a review of the sensitivity of the SNIa enrichement timescale on initial mass function and star formation rate.
Thus, within the framework of pure self-enrichment chemical evolution, our finding would also imply some age spread (few Gyr) between the RGB-a population and the previous, more metal poor ones. An age spread of seems infact needed to explain the morphology of the SGB-TO region of recent Strömgren photometries like the ones by Hughes & Wallerstein (2000) or Hilker & Richtler (2000). However, a clear answer to the relative ages problem can only come from high-resolution spectroscopic studies of stars in the SGB-TO of Cen, that can break the age-metallicity degeneracy.
Case b) The merging hypothesis for the formation of Cen was put forward by Icke & Alcaino (1988), to explain both the ellipticity and the metallicity spread observed. Admittely, the collected observational evidence make the merger of two ordinary globular cluster in the potential well of the Milky Way unlikely. For istance, accordingly with Smith et al. (2000) the merging of two or more single metallicity clusters scenario cannot account for the broad distribution of the RGB. However, evidence of correlation between the metallicity and the dynamical properties (Norris et al. 1997) or the spatial distribution (Pancino et al. 2000) are still difficult to explain in the pure self-enrichment scenario.
Thus, the possibility still exists that at least the RGB-a stellar population was originally a satellite system of Cen. Within this framework the most promising scenarios seems to be the so-called merger within a fragment (Norris et al. 1997), in which the RGB-a stellar population was originally a satellite gas cloud in the potential well of the larger Cen galaxy. The results presented here add the evidence that this cloud was also previously enriched by the ejecta of type Ia supernovae.
7. Conclusions and Future Prospects
The results presented here represent a first step towards the understanding of the star formation history of Cen. A comprehensive scenario of course requires a much more extensive sample of stars, together with accurate measures of the relative ages and detailed abundance patterns of stars near the Turn-off and Sub Giant Branch regions of the CMD. We are already planning to extend our study in this direction within the framework of the global project presented by Ferraro, Pancino & Bellazzini, in this volume.
References
Alonso, A., Arribas, S., Martínez-Roger, C. 1999, A&A, 140, 261
Brown, J.A., Wallerstein, G., Cunha, K., Smith, V.V., 1991 A&A, 249, L13
Cannon, R.D., Stobie, R.S. 1973, MNRAS, 162, 207
Dickens, R.J., Bell, R.A. 1976, ApJ, 207, 506
Edvardsson, B., Andersen, J., Gustafsson, B., Lambert, D.L. Nissen, P.E. & Tomkin, J. 1993, A&A, 275, 101
Freeman, K.C. 1993, in ASP Conf. Ser. 48, The Globular Cluster–Galaxy Connection, ed. J.H. Smith & J.P. Brodie (San Francisco:ASP), 608
Gratton, R.G. 1999, Ap&SS, 265, 157
Harris, W.E. 1996, AJ, 112, 1487
Hilker, M. & Richtler, T. 2000, A&A, 362, 895
Hughes, J. & Wallerstein, G. 2000, AJ, 119, 1225
Icke, V. & Alcaino, G. 1988, A&A, 104, 115
Lee, Y-W., Joo, J-M., Sohn, Y-J., Rey, S-C., Lee, H-c., & Walker, A.R., 1999, Nature, 402, 55
Matteucci, F. & Recchi, S. 2001, ApJ, 558, 351
McWilliam, A. 1997, ARA&A, 35, 503
Nave, G., Johansson, S., Learner, R.C.M., Thorne, A.P., Brault, J.W. 1994 ApJS, 94, 221
Norris, J.E., Da Costa, G.S. 1995, ApJ, 447, 680
Norris, J.E., Freeman, K.C. & Mighell, K.L., 1996, ApJ, 462, 241
Norris, J.E., Freeman, K.C., Mayor, M. & Seitzer, P. 1997, ApJL, 487, L187
Paltoglou, G., Norris, J.E. 1989, ApJ, 336, 185
Pancino, E., Ferraro, F.R., Bellazzini, M., Piotto, G. & Zoccali M. 2000, ApJ, 534, L83
Plez, B. 1992, A&AS, 94, 527
Smith, V.V., Suntzeff, N.B., Cunha, K., Gallino, R., Busso, M., Lambert, D.L., Straniero, O. 2000, AJ, 119, 1239
Vanture, D.V., Wallerstein, G., Brown, J.A. 1994, PASP, 106, 835
Woolley, R., 1966, Royal Obs. Ann. London, No 2