The Chandra Deep Field North Survey. IX. Extended X-ray Sources11affiliation: Based on observations obtained with the Hobby-Eberly Telescope, which is a joint project of the University of Texas at Austin, the Pennsylvania State University, Stanford University, Ludwig-Maximillians-Universit t M nchen, and Georg-August-Universit t G ttingen.
Abstract
The 1 Ms Chandra Deep Field North observation is used to study the extended X-ray sources in the region surrounding the Hubble Deep Field North (HDF-N), yielding the most sensitive probe of extended X-ray emission at cosmological distances to date. A total of six such sources are detected, the majority of which align with small numbers of optically bright galaxies. Their angular sizes, band ratios, and X-ray luminosities — assuming they lie at the same distances as the galaxies coincident with the X-ray emission — are generally consistent with the properties found for nearby groups of galaxies. One source is notably different and is likely to be a poor-to-moderate X-ray cluster at high redshift (i.e., ). This source has a large angular extent, a double-peaked X-ray morphology, and an overdensity of unusual objects [Very Red Objects, optically faint () radio and X-ray sources]. Another of the six is coincident with several galaxies located within the HDF-N itself, including the FR I radio galaxy VLA J123644.3+621133, and is likely to be a group or poor cluster of galaxies at that redshift. We are also able to place strong constraints on the optically detected cluster of galaxies ClG 12366215 at and the wide-angle-tail radio galaxy VLA J123725.7621128 at –2; both sources are expected to have considerable associated diffuse X-ray emission, and yet they have rest-frame 0.5–2.0 keV X-ray luminosities of erg s-1and – erg s-1, respectively. The environments of both sources are either likely to have a significant deficit of hot intra-cluster gas compared to local clusters of galaxies, or they are X-ray groups. We find the surface density of extended X-ray sources in this observation to be 167 deg-2 at a limiting soft-band flux of erg cm-2 s-1. No evolution in the X-ray luminosity function of clusters is needed to explain this value.
The Astronomical Journal, 2002 March, astro-ph/0112002
1 INTRODUCTION
The Hubble Deep Field North (HDF-N; Williams et al., 1996; Ferguson, Dickinson, & Williams, 2000) was chosen as the location of a deep Hubble Space Telescope survey because it contained no known bright sources at radio, infrared, optical, or X-ray wavelengths and no known nearby () clusters of galaxies. This effort was conceived to advance the study of galaxy evolution to high redshifts, but it has since initiated one of the most intensive, multi-wavelength investigations on the sky, influencing a wide range of astronomical topics (e.g., Ferguson et al. 2000 and references therein) and yielding one of the most comprehensive data sets publicly available (e.g., deep imaging at nearly all astronomically accessible wavelengths and more than 700 spectroscopic redshifts within a radius of the HDF-N).111See the Hubble Deep Field Clearinghouse; http://www.stsci.edu/ftp/science/hdf/clearinghouse/clearinghouse.html. Recently, the Chandra X-ray Observatory (hereafter Chandra; Weisskopf et al., 2000) completed an 1 Ms survey of the HDF-N and its environs, providing an extremely sensitive view of the X-ray Universe.
The Chandra Deep Field North Survey (CDF-N; Brandt et al., 2001b, hereafter Paper V) covers an area approximately in size and reaches 0.5–2.0 keV (soft) and 2.0–8.0 keV (hard) flux limits of erg cm-2 s-1 and erg cm-2 s-1 (5.5) near the aimpoint for point sources. In addition to resolving most of the X-ray background into individual point sources (e.g., Paper V, Cowie et al., 2002), the observation allows the detection of even relatively poor clusters and groups of galaxies to significant redshifts (). The detection of extended X-ray emission from hot gas provides compelling evidence that apparent optical clusters or groups are truly gravitationally bound. Since the properties of clusters and groups are intimately dependent upon cosmological parameters and the history of structure formation, X-ray emission offers a useful probe of hierarchical structure.
There is already substantial observational evidence that sources in the vicinity of the HDF-N tend to cluster at certain redshifts in “walls” or “filaments,” and that a few of these redshift peaks can be broken up spatially into apparent groups of galaxies (e.g., Cohen et al., 2000; Dawson et al., 2001). The CDF-N has the potential to determine whether the gravitational potential wells of these apparent groups are deep enough to harbor large amounts of hot gas and dark matter. Additionally, deep radio imaging of this region has revealed two highly extended radio sources (Richards et al., 1998; Muxlow et al., 1999; Snellen & Best, 2001); one is the Fanaroff-Riley I (FR I; Fanaroff & Riley, 1974) radio galaxy VLA J123644.3+621133 located within the HDF-N itself, and the other is the wide-angle-tail (WAT) source VLA J123725.7621128. These two radio Adaptively smoothed “true color” X-ray image with red, green, and blue representing 0.5–2.0 keV, 2.0–4.0 keV, and 4.0–8.0 keV emission, respectively. Prior to combination, each color image was smoothed to 2.5 with an adaptive kernel algorithm (Ebeling, White, & Rangarajan, 2001) to enhance diffuse features. The white boxes denote the six extended X-ray sources detected (see 4), while the two dashed circles indicate cluster candidates found at other wavelengths that show no significant extended X-ray emission (see 4.2). In order to show clearly the extended sources, it was necessary to saturate bright X-ray point sources. This tends to make all of the brighter point sources appear yellow in the image, regardless of whether their spectral shapes are particularly hard or soft. {multicols}2
sources are notable because FR Is, and in particular WATs, are known to reside predominantly in or near rich clusters of galaxies; extended X-ray emission associated with these particular radio sources has yet to be detected. Arguably the most definitive evidence for clustering near the HDF-N, however, comes from Dawson et al. (2001) who recently reported the discovery of the cluster of galaxies ClG 12366215 slightly north of the HDF-N. Dawson et al. predict this cluster should have a bolometric X-ray luminosity in excess of erg s-1, which, for an extended object of radius 30 at a redshift of , should be nearly a factor of 15 above the detection threshold of the CDF-N. Although a 21 ks ROSAT High Resolution Imager (HRI) observation of this region detected no extended X-ray objects, the resulting soft-band flux threshold of 2 erg cm-2 s-1 is not particularly constraining; for instance, the HRI observation would have missed a typical erg s-1 X-ray cluster at or even a typical erg s-1 X-ray cluster at . The 1 Ms Chandra observation allows us to push these constraints much lower.
The deepest soft-band X-ray observations prior to Chandra were those of the ROSAT Ultra Deep Survey toward the Lockman Hole (hereafter UDS; e.g., Lehmann et al., 2001), which detected ten extended objects over a field of view. A few of these sources are classified as clusters (including the double-peaked lensing cluster RX J1053435735; Hasinger et al., 1998), but the majority appear to be groups; all are thought to lie at redshifts of –1.0. Results from other deep surveys with ROSAT (e.g., McHardy et al., 1998; Zamorani et al., 1999) were comparable. While the CDF-N covers only the area of the UDS, it probes the X-ray sky a factor of times deeper for extended objects in the soft band, making the discovery of fainter and more distant objects possible.
Here we describe the nature of the extended X-ray sources detected within the extremely deep CDF-N observation. In 2 and 3, we briefly outline our reduction and detection techniques for the X-ray and optical observations, respectively. Descriptions of individual sources are presented in 4. Finally our findings are discussed and summarized in 5. Throughout this paper, we adopt km s-1 Mpc-1, , and . The Galactic column density toward the CDF-N is cm-2 (Stark et al., 1992). Coordinates are for the J2000 epoch.
2 Chandra Observations and Reduction Techniques
A full description of the CDF-N observations, data reduction methods, and catalog of detected sources is provided elsewhere (Paper V). Here we outline only the methods relevant to detect extended X-ray sources in the CDF-N and measure their characteristics. The reduction and analysis detailed below were carried out using the Chandra Interactive Analysis of Observations (ciao) Version 2.1 tools whenever possible,222See http://asc.harvard.edu/ciao/. although custom software was sometimes also required.
2.1 Source Detection
Extended source searching was performed over the entire ACIS-I field using the Voronoi Tessellation and Percolation algorithm (VTP; Ebeling & Wiedenmann, 1993; Dobrzycki et al., 1999). Specifically, we created soft (0.5–2.0 keV), hard (2.0–8.0 keV) and full (0.5–8.0 keV) band images using the standard ASCA grade set333Identical analysis was carried out on event lists and images made using the restricted ACIS grade set, since this grade set has been shown to reduce the particle background by up to (Brandt et al., 2001a, see Table 1 of [hereafter Paper IV). The results were quantitatively similar to those found with the ASCA grade set and did not greatly enhance the signal-to-noise of any source. defined in Table 2 of Paper V. These images were then searched for extended sources using the ciao tool vtpdetect adopting a false-positive probability threshold of and a “coarse” parameter of 100. We required that vtpdetect-detected extended sources satisfy each of the following criteria: (1) average vtpdetect radii444Defined as the average of the major and minor axes reported by vtpdetect. greater than three times the 95% encircled-energy radius of the point spread function (PSF) at a given off-axis angle, (2) visible extended X-ray emission in exposure-corrected, adaptively smoothed images (made with the ciao tool csmooth; see Ebeling, White, & Rangarajan, 2001), and (3) a signal-to-noise of 3 above the local background derived via aperture photometry (see 2.2). While we appreciate that the criteria is less stringent than the false-positive probability threshold of vtpdetect, it allowed us to remove manually point sources that might have subtly affected the vtpdetect search algorithm and gives us a secondary significance estimator. In total, six extended X-ray sources were considered to be legitimate. Two of these are solid detections while the other four all lie close to the limit. None of these lies directly on ACIS-I chip gaps or edges, and the exposure maps are relatively smooth near all of the detected sources (with variations of 20% at most). This suggests that the data are less sensitive to extended emission on chip gaps or edges. Note that all of the sources lie within the “high exposure area” where the median effective exposure time is 800 ks (see Figure 7 of Paper V).
Figure 1 shows a “true color” image of the CDF-N, with the colors red, green, and blue representing the 0.5–2.0 keV, 2.0–4.0 keV, and 4.0–8.0 keV energy bands, respectively. Each X-ray image was smoothed with csmooth prior to combination to permit the simultaneous viewing of compact and extended sources. The smoothed images each have a signal-to-noise ratio of 2.5 per smoothing beam. The six extended X-ray sources are labeled and enclosed within boxes corresponding to the size of the optical cut-out images described in 3. Also shown are two cluster candidates not detected in this observation (see 4.2 for details).
The CDF-N observations spanned approximately 16 months and were taken at a variety of roll angles (see Table 1 of Paper V), so the summed diffuse particle background is both temporally and spatially variable.555For a detailed characterization of Chandra’s background, see http://asc.harvard.edu/cal/Links/Acis/acis/. This non-uniformity hinders an accurate measure of the local X-ray background and makes determination of sample completeness difficult. Furthermore, it is possible that the backgrounds from individual observations could combine together in such a manner that local background enhancements by a factor of a few are common. If such enhancements exist in the CDF-N, they could in turn lead to spurious detections. We can check for such problems since instrumental background features are likely to occur at the same position on the CCD regardless of aim point or roll angle while cosmic sources will not. We therefore split the 1 Ms observation into two adaptively smoothed soft-band images of 432 ks and 543 ks, made using only data with roll angles of 364–445 and 1343–1438, respectively (see Table 1 of Paper V). The six extended sources mentioned above were the only regions of diffuse emission visible in both images, arguing against an instrumental origin.
Finally, because of the nature of the CDF-N observations noted above, we caution that any extended X-ray sources that happen either to intersect one of the CCD chip gaps or fall along the edges of observations could potentially have irregular morphologies. This could in turn lead to an inaccurate assessment of their physical nature. The fact that none of the CDF-N extended sources detected in our analysis lies on CCD chip gaps or edges is therefore extremely important, as it implies that the peculiar morphological features seen in the brightest two extended X-ray sources in Figure 1 are likely to be real.
2.2 Source Properties
The basic properties of the six extended CDF-N sources are given in Table 1. Since sources were best detected in the soft band, the poorly defined source positions were estimated by eye from the adaptively smoothed soft-band image. The counts for these sources were determined via manual aperture photometry. The sizes and shapes of the apertures were chosen to encompass the apparent X-ray emission associated with the sources as determined from the adaptively smoothed images; column 3 of Table 1 lists these regions. Background counts were extracted from annular regions immediately outside the source extraction regions. Point sources and regions of strongly varying background were excluded. The vignetting correction applied to the flux calculation below was determined by extracting average exposure times in the exposure map from source and background regions identical to those used to extract the counts. The count rates associated with these extended sources are typically only a fraction of the area-corrected, point-source excluded, average X-ray background rate. The uncertainties in the measured source counts are therefore large and increase with the extraction region size. Source-to-background (S-to-B) ratios for each source are listed in column 6.
For all but two sources (1 and 4), the numbers of counts in the diffuse emission are comparable to or larger than those from nearby point sources. We would not expect this many counts from the extended wings of the PSF of an isolated bright point source alone, and therefore the counts must be produced by these extended sources. In the cases of sources 1 and 4, even though the counts from the background-subtracted diffuse emission are a factor of 10–20 less than the total point-source counts, the centroids of the diffuse emission are distinctly offset from bright point sources by 15. Such asymmetric offsets are unlikely to be due to the PSF wings of bright embedded point sources.
All of the extended sources in Figure 1 appear to be dominated by soft (red) X-ray emission, a trend which is also apparent in the count-rate statistics. For instance, all six are formally detected in the soft band and four in the full band, but only one source is detected in the hard band (source 2 in Table 1 has hard-band counts). Three effects mitigate against detections in the hard band: (1) the higher background rate in this band, (2) the smaller effective area in the hard-band, and (3) the intrinsically soft nature expected for the majority of extended X-ray sources. The band ratios (BRs) of the sources, defined as the ratio of hard-band to soft-band count rates, are listed in column 7 of Table 1 and are upper limits in all but one case. The small BRs for the two brightest sources are consistent with the low X-ray temperatures found for nearby X-ray groups and poor X-ray clusters (e.g., Xue & Wu, 2000). The BRs for the other four sources provide little constraint on potential spectral models.
The two brightest X-ray sources have enough counts to provide more detailed spectral constraints. X-ray spectra were extracted for each source using the regions described in Table 1. We used only events taken at C for this spectral analysis since 75% of the 1 Ms survey was performed at this temperature, and the particle background was 20% higher at the time when C data were collected.666See http://asc.harvard.edu/cal/Links/Acis/acis/Cal_prods/bkgrnd/. As described in Paper V, the CDF-N data have been corrected for radiation damage using the procedure of Townsley et al. (2000). To complement the corrected data, we also used the modified response matrix files (RMFs) and quantum efficiency uniformity files (QEUs) supplied with the corrector. Since the physical positions of each extended X-ray source on the ACIS-I CCDs varied among the 12 CDF-N observations, we extracted individual RMFs and QEUs for each observation and averaged them together weighting by the number of counts in each observation. The spectrum of each source was binned such that each spectral bin contained at least 30 counts, and spectral fitting was performed using xspec (Arnaud, 1996). We only included energies where the data are not dominated by the background, corresponding to 0.5–3.5 keV for source 2 and 0.5–5.0 keV for source 6. We fitted the spectra with absorbed Mewe-Kaastra-Liedahl thermal plasma models (i.e., the xspec mekal model; Mewe, Gronenschild, & van den Oord, 1985; Kaastra, 1992; Liedahl, Osterheld, & Goldstein, 1995) and obtained acceptable fits. Note that Raymond-Smith thermal plasma models (Raymond & Smith, 1977) were equally acceptable. For both sources, the reduced values were reasonable ( for source 2 and 1.04 for source 6), and no obvious systematic residuals were present. In the fits, the plasma temperature was left as a free parameter, the absorption column density was fixed at the Galactic value, and the redshift was fixed to that given in Table 1. No constraints could be placed on the abundance values, so they were set to 0.3 times solar, a value typical of nearby groups (e.g., Mulchaey, 2000). Since both of these sources have low source-to-background ratios, we extracted several different background regions of varying sizes and shapes to determine what effect the background had on our spectral fits. Depending on the local background region used, we found that the best-fit temperatures of the sources varied by at most 20%, well within the quoted errors. The results of the spectral fits are listed in Table 1.
Soft-band X-ray fluxes were determined using the best-fit model from xspec, or, in the case of the four faint sources, a keV thermal plasma model with an abundance of 0.3 times solar. The fluxes, both for detections and upper limit estimates, were corrected for vignetting and for the areas masked out to eliminate contaminating point sources. The apparent angular sizes of all the objects lie within the range 45–90 (i.e., 100–600 kpc over the expected redshift range), and only one has an extent . Strictly speaking, the quoted extents of these extended X-ray sources should be regarded as lower limits, since a non-negligible fraction of their flux could lie in the outer isophotes just below our detection threshold. This effect is most noticeable in groups of galaxies, where the surface brightness profile is shallower than that of clusters. For instance, isophotal measurements of X-ray detected groups have been found to underestimate the true X-ray luminosities of their hot gas by factors of up to 2–3 in some extreme cases (e.g., Helsdon & Ponman, 2000). Given the irregular morphologies of the brighter sources and the limited statistics of the fainter sources, we have not attempted to model their surface brightness profiles nor have we performed any related luminosity corrections (e.g., to the virial radius). X-ray luminosities were calculated assuming the most likely redshifts of potential optical group or cluster members (see 3) and were corrected for Galactic absorption.
Based on the average properties of nearby clusters and groups of galaxies (e.g., Ponman et al., 1996; Mohr & Evrard, 1997; Vikhlinin et al., 1998), five of the six extended CDF-N X-ray sources have apparent physical extents (assuming the redshifts indicated in 4.1) similar to those of X-ray groups (100–300 kpc). The properties of source 2, however, appear to be more extreme; with an X-ray temperature of at least 2 keV and a physical extent of 600 kpc, its X-ray properties are more consistent with those of a moderately X-ray luminous cluster. Note that deviations from the assumed redshifts above will not change the physical size by more than a factor of two at most. Sources 2 and 6, the two brightest sources, are both elongated and clumpy, suggesting either point-source contamination or that they are unrelaxed systems perhaps undergoing mergers.
We have thus far only entertained the possibility that these extended X-ray sources are extragalactic, but could any of these sources be Galactic in nature? Given that the angular sizes (45–90) and, when measurable, temperatures (2–4 keV) of the sources discussed here are quite different from those of typical interstellar medium clouds (i.e., 1 scales and 0.25 keV temperatures; Snowden et al., 1998; Kuntz, 2000), and furthermore that the CDF-N is at high Galactic latitude (), this possibility seems unlikely. Any other form of diffuse Galactic X-ray emission (e.g., a supernova remnant) should have obvious extended optical or radio counterparts.
3 Optical Constraints
3.1 Optical Images and Photometry
To assess the optical nature of these six sources, we inspected all of the publicly available images covering the CDF-N region. These include the , , , and -band images of Barger et al. (1999)777These images are available at http://www.ifa.hawaii.edu/cowie/hdflank/hdflank.html. and the , , and -band images of Steidel & Hamilton (1993), all of which cover an region surrounding the HDF-N, as well as the -band image of Liu et al. (1999) which extends over the entire CDF-N region. The , , , , , , , and -band images have 2 detection limits of 21.2, 25.5, 25.6, 23.0, 26.5, 26.4, 26.3, and 25.0, respectively. Figure 1 shows contours of the adaptively smoothed soft-band X-ray image for each of the six X-ray sources overlaid on either the Barger et al. -band image or, when no -band coverage was available, the wide-field Liu et al. -band image. The X-ray and optical astrometric reference frames have both been tied to the FK5 radio coordinate grid using several dozen bright, point-like radio sources; the typical resulting X-ray/optical offsets are for all point sources with off-axis angles less than 5, and for sources 5–10 off-axis.
Magnitudes for sources were determined using the SExtractor photometry package (Bertin & Arnouts, 1996) with the “Best” magnitude criteria, a detection threshold, and a 25-pixel Gaussian wavelet. As a consistency check for the SExtractor photometry, we matched our sources to sources in the catalog of Barger et al. (1999); we found good agreement, with typical 1 magnitude deviations of . As expected, the largest deviations were always near the detection threshold of the images.
3.2 Tests of Clustering
In general, there appear to be several bright optical galaxies located within the X-ray contours of each source, suggesting a moderate level of clustering. Only source 2 fails to follow this trend. One of the most effective tests for clustering is the “red sequence” method of Gladders & Yee (2000), which relies on the assumption that all significant real clusters have a red sequence of early-type galaxies and that this sequence clearly stands out among the field galaxy population at brighter magnitudes (e.g., –23) in colors. The best constraints using this method, however, rely on precision photometry and morphological classifications, neither of which are feasible with our current optical data. Nevertheless, we used the -band and -band images which cover to generate versus color-magnitude diagrams identical to those presented in Gladders & Yee (2000). We found no indication of a red sequence in any of the four extended CDF-N sources that lie within these images, nor for ClG 12366215, an optically-selected cluster. Our results suggest that either better photometry and morphological classifications are required or that the universality of the red sequence in clusters does not necessarily extend down to the level of groups or poor clusters.
While less efficient, another method to test for optical overdensities near the extended X-ray sources is Monte Carlo simulations on the -band and -band images. In these simulations an aperture was positioned at random on the image and the number of galaxies above a given magnitude within it was tallied. For each of the extended X-ray sources, we adopted a circular aperture equal to twice the size of the major axis listed in column 3 of Table 1; since the detectable X-ray emission from groups of galaxies often only extends out to a fraction of the virial radius, many potential optical group members may lie outside of the region traced by the X-ray emission (Mulchaey, 2000). For the -band image, the magnitude limit was set to . For the -band image, the magnitude limit was set slightly above the detection threshold to . Unfortunately, the combination of the large apertures used and the relatively small angular sizes of the -band and -band images ( and , respectively) severely limit the number of statistically independent cells we were able to use for Monte Carlo simulations; for the -band and -band images we used 80 and 900 trials per CDF-N extended source, respectively.
Column 11 of Table 1 gives the results of the Monte Carlo simulations, listed as the fraction of trials containing fewer galaxies than found in an aperture at the position of the X-ray source (). Simulations using the -band image yielded significant ( 90% confidence level) overdensities for sources 3, 4, and 5, although the small number of independent cells restricts the precision of these simulations. For comparison, we also ran simulations on a region near the HDF-N known to have a large overdensity of sources, the optical cluster of galaxies ClG 12366215 (see 1 and 4.2). We found that the number of sources in ClG 12366215 within a 30 radius aperture, when compared to the 80 Monte Carlo simulation trials, was overdense at the 100% confidence level. Since the -band simulations do not cover the regions around sources 1 and 6, simulations using the -band image were performed instead. The -band simulations yielded strong results for both sources and confirmed our -band results. We note that decreasing the aperture radius used in the simulations to that of the X-ray extraction major axis yielded similar results, while varying the magnitude criterion by one magnitude brighter or fainter yielded mixed results. A more detailed study of the surface density of optical sources both as a function of magnitude and radius may improve the statistics but is beyond the scope of this work. These simulation results imply possible optical clustering for five of the six sources. Since distant groups are generally difficult to distinguish from background sources based on statistical deviations alone, our null results for source 2 may not necessarily be inconsistent with its identifications as a potential cluster.
3.3 Redshift Information
Clusters and groups of galaxies are usually identified through the redshifts of their optical members. We estimated the redshifts of the extended X-ray sources using the photometric redshift catalog of Fernández-Soto, Lanzetta, & Yahil (1999) and the spectroscopic redshift catalogs of Cohen et al. (2000), Dawson et al. (2001), and A. E. Hornschemeier et al., in preparation. Sources 3 and 6 have clear redshift identifications (see 4.1). Unfortunately, all of the extended X-ray sources apart from source 3 lie outside the well-studied region of Cohen et al. (i.e., 700 redshifts within a radius region centered on the HDF-N), so spectroscopic coverage was often limited to only a few sources in each field. To augment these published redshifts, we estimated photometric redshifts for all optical sources that have extensive multi-band optical coverage using the optical images noted in 3.1. Specifically, we found that our photometric redshift estimates were most reliable for sources with detections in the -band (i.e., ) and in at least four of the other six optical bands (the wide-field -band image was not included since it provided no new information). There were 858 sources which satisfied this constraint. Our requirement of a source detection in the -band, rather than some other band, was based on the fact that a detection provided much stronger redshift constraints from the spectral template fitting procedure compared to any of the other bands and resulted in a lower percentage of catastrophic failures (see below). By necessity, all 858 of these sources lie in the area centered on the HDF-N.
To measure photometric redshifts we used the publicly available photometric redshift code hyperz Version 1.1 (Bolzonella, Miralles, & Pelló, 2000).888See http://webast.ast.obs-mip.fr/hyperz/. In performing the photometric redshift fitting, we used both the Coleman, Wu, & Weedman (1980) and Bruzual & Charlot (1993) spectral templates provided with hyperz and allowed up to 1 mag of visual extinction. Of the 858 source redshifts estimated with hyperz, 455 have published spectroscopic redshifts. Considering that the ensemble of images were obtained with different telescopes, instruments and observing conditions, and, furthermore, that the optical bands were not optimized for estimating photometric redshifts, we find notably good agreement between the photometric and spectroscopic measures. Only about 5% of the sources fail catastrophically (i.e., ); the majority of these sources are photometrically estimated to lie at high redshifts (), but are in fact nearby () galaxies with and are usually classified by Cohen et al. (2000) as composite spectral types with both emission and absorption features typical of dwarf starburst galaxies. These sources appeared to fail because hyperz did not have a suitable spectral template to use in the model fitting. If we exclude sources with and (59 in all, 28 with spectroscopic redshifts), we find a 1 deviation between the spectroscopic and our photometric redshifts of .999A catalog of these 799 sources is provided at http://www.astro.psu.edu/users/niel/hdf/hdf-chandra.html. Figure 3.3 shows a comparison of the photometric and spectroscopic redshifts, both as a scatter plot of individual sources and as a histogram of the difference between the two measures binned in 0.1 redshift deviation intervals. Only sources with photometric or spectroscopic redshifts below 1.5 are plotted in since the spectral constraints imposed by the detection limits of the images and the requirement for a -band detection naturally exclude most high-redshift sources.
The photometric redshift estimates described above have allowed us to enhance the redshift coverage in half of the CDF-N source fields (2, 4, and 5) and have led to an improved distance constraint for source 2 (see 4.1). Even with these additional redshift estimates, we are only confident in the redshift determinations for sources 3 and 6. To give the reader a feeling for how we made our redshift estimates, we show in Figure 2 optical images for the two likely high redshift sources (2 and 3) with spectroscopic and photometric (ours and Fernández-Soto et al., 1999) redshifts overlaid. For source 2, which could lie at one of several possible redshifts, we plot spectroscopic and photometric redshifts of individual galaxies when they are consistent to within their measurement error with three possible redshifts of the X-ray source at , 0.80, and 1.35 (note that 14 out of a total 36 redshifts have been plotted). For source 3, we have only plotted redshifts of individual galaxies when they are consistent to within their measurement error with the likely redshift of the X-ray source at (note that 32 out of a total 77 redshifts have been plotted). For this, we assumed that the spectroscopic redshifts have errors of , that the photometric redshifts of Fernández-Soto et al. (1999) have errors of , and that the photometric redshifts determined here have errors of . These images are described in more detail in 4.1.
![[Uncaptioned image]](/html/astro-ph/0112002/assets/x1.png)
A comparison of our photometric redshift estimation () for 427 sources in the HDF-N and environs which also have spectroscopic () redshifts of Cohen et al. (2000), Dawson et al. (2001), and A. E. Hornschemeier et al., in preparation. The upper panel shows a comparison of individual sources, and the lower panel shows a histogram of the difference between the two redshift measures binned in 0.1 intervals. Not plotted are the 28 (out of 59 total) catastrophic failures defined as sources with and , which presumably fail due to the limited number of spectral templates used (see 3.3). The 1 deviation of the photometric redshift from the spectroscopic redshift is .
4 Individual Source Notes
This section is devoted to descriptions of the multi-wavelength properties of each source. We first discuss the two clear detections, sources 2 and 6, and then the other four detected sources for which less diagnostic information is available. Lastly, we provide constraints on two undetected sources for which X-ray emission was expected based on observations at other wavelengths.
4.1 Detected X-ray Sources
Source 2 — CXOHDFN J123620.0621554: This source has a double-peaked X-ray morphology suggestive of an ongoing merger and a best-fit plasma temperature of keV. Unlike the other extended X-ray sources in the CDF-N, source 2 has no obvious optical counterparts in the -band image, suggesting a fairly high redshift. There are a number of nearby sources with spectroscopic or photometric redshifts consistent with or 0.80. At such redshifts, this object would have unabsorbed soft-band luminosities of erg s-1 or erg s-1, respectively, and it would likely be an underluminous X-ray cluster or a moderately luminous group of galaxies. Very few of the sources with redshifts, however, lie within the innermost X-ray contours (see Figure 2). Focusing only on the optical sources that do lie close to the center of the brighter X-ray peak, we find that 123620.1621555, an source at , lies from the X-ray peak. This source has a narrow [O II] 3727 emission line and Mg II absorption features (Dawson et al., 2001); its broad-band colors and absolute magnitude suggest that it may be atypically bright, possibly due to AGN activity. We also identify 123620.1621555, an galaxy, to be coincident with the X-ray peak. Either source could plausibly be a candidate “Brightest Cluster Galaxy” (BCG) within the cluster. BCGs are thought to be excellent distance indicators (e.g., Postman & Lauer, 1995); assuming 123620.1621555 is a typical BCG with between and based on the compilation of Hoessel & Schneider (1985), and using the E1 galaxy -correction model and colors of Poggianti (1997), we find that this source should lie at a redshift of –1.5.101010Note that because of the strong -correction for elliptical galaxies at these high redshifts, a BCG may not in fact be the galaxy with the brightest apparent magnitude in the cluster. The proximity of these two sources to the X-ray peak favors a high redshift for the X-ray source.
Another notable characteristic of this extended X-ray source is the high density of unusual objects found clustered within a radius of its brightest X-ray peak (see Figure 2). Specifically, there are two Very Red Objects (VROs) defined as (Alexander et al., 2002) and four optically faint radio and/or X-ray sources with (Richards et al., 1999; Alexander et al., 2001). From the combined source densities of VROs, optically faint radio sources, and optically faint X-ray sources, we would expect only 0.8 such sources. Interestingly, four of these six unusual objects lie within a radius of the X-ray peak, suggesting an association. Furthermore, one of the optically faint radio sources has a submillimeter detection and a millimetric redshift of (Barger, Cowie, & Richards, 2000). This redshift is consistent with those of the two optical galaxies near the X-ray peak. The rest of the objects are expected to lie at redshifts of –3.
Overdensities of this kind have been noted for several other high-redshift clusters (e.g., Chapman, McCarthy, & Persson, 2000; Smith et al., 2001); two plausible scenarios can explain such an overdensity. The first is that source 2 is physically associated with the VROs and optically faint radio and X-ray sources, and that they all lie at a redshift of –3. At such redshifts, the rest-frame unabsorbed soft-band luminosity of this source would be – erg s-1. An alternative scenario is that the X-ray source lies at an intermediate redshift, as suggested by the spectroscopic and photometric redshifts of nearby sources, and the overdensity of unusual objects is a manifestation of gravitational lensing. We note that a similar extended X-ray source was found by Hasinger et al. (1998) within the Lockman Hole: the double-peaked X-ray source, RX J1053435735, thought to lie at . RX J1053435735 has both an overdensity of very red ( = 5.5–5.7) objects nearby and exhibits evidence for gravitational lensing in the form of a bright arc near the center of the X-ray peak (Lehmann et al., 2000, 2001). The only differences between RX J1053435735 and source 2 are that the former has clear optical counterparts at – (nearly 3–4 magnitudes brighter than found for source 2) and the latter exhibits no obvious signs of lensing. Further observations of this object with Chandra and HST should help to reveal its nature. At the aforementioned redshifts, the physical size of source 2 would be 600 kpc.
Source 6 — CXOHDFN J123756.0621506: Like source 2, this source is also clearly elongated and has two distinct peaks of emission, suggesting a possible merger. The brighter of the two X-ray peaks coincides with three optically bright, nearly overlapping galaxies in the -band image of Liu et al. (1999). The optical magnitudes of these galaxies imply that the extended X-ray source is likely to be a typical X-ray emitting group at moderate redshift. One interesting aspect of source 6 is that the second X-ray peak shown in Figure 1 lacks a bright optical counterpart down to the -band limit. Such a morphology has few analogs among nearby X-ray groups (e.g., Mulchaey et al. 1996; J. Mulchaey 2001, private communication) and suggests that there may be contamination from one or more faint X-ray point sources. From inspection of the unsmoothed X-ray image, there appear to be no obvious point sources. However, given that source 6 lies at an off-axis angle of 8, X-ray photons from any faint point sources would be distributed over a diameter of 10 (i.e., the 1.5 keV 50% encircled energy radius) and would not necessarily be detectable by eye. Therefore, to search for possible contamination from faint X-ray point sources, we adaptively smoothed the raw X-ray images, but restricted the smoothing algorithm to smooth only on scales smaller than the Chandra PSF (i.e., 5). A comparison of this minimally smoothed X-ray image and the -band image confirms that the second X-ray peak lies in between two 22–23 magnitude galaxies (123756.5621456 and 123758.8621458), both with hints of X-ray emission. Thus this second peak is likely to be an artifact of the adaptive smoothing algorithm. Moreover, these galaxies are likely to be related to the X-ray group, since the probability that two unrelated 22–23 magnitude X-ray sources (with estimated fluxes of 1 erg cm-2 s-1) would be found within a 15 radius of this X-ray group is less than 1%.
Since source 6 lies from the center of the HDF-N, there are no published spectroscopic redshifts for any of the galaxies in this field. Therefore, to determine its distance, moderate resolution long-slit spectroscopic observations were made with the Hobby-Eberly Telescope (HET) Marcario Low Resolution Spectrograph (LRS; Hill et al., 1998; Hill, 2000) for two of the three optical galaxies which are most likely to be associated with the X-ray source (see Figure 1). The results of these observations are presented in Appendix A and show that both galaxies lie at . Thus the extended emission from this source has a physical size of 150 kpc and a rest-frame unabsorbed soft-band luminosity of erg s-1, properties consistent with poor groups of galaxies studied locally (e.g., Mulchaey et al., 1996; Ponman et al., 1996; Helsdon & Ponman, 2000). At this redshift, it is one of the more distant X-ray groups known. From our spectral analysis in 2.2, source 6 has a derived a rest-frame plasma temperature of keV. This is much higher than expected for a group of this size and luminosity and suggests the possibility of either point-source contamination, shock-heating from infalling gas, or non-gravitational heating. Considering the detection of two faint galaxies near the second X-ray peak, point source contamination appears to be the most likely explanation.
Other Sources: Sources 1, 3, 4, and 5 have less well defined X-ray properties. All appear to have roughly spherical X-ray morphologies, although spatial irregularities cannot be ruled out given their low source-to-background ratios. Moreover, only weak constraints can be placed on their X-ray spectral nature. Source 3 is particularly notable because it lies within the HDF-N itself near the FR I radio galaxy VLA J123644.3621133 and several other objects (Richards et al., 1998; Fernández-Soto et al., 1999; Cohen et al., 2000). In Paper IV, the FR I itself was detected (as CXOHDFN J123644.3621132), and at the time no nearby extended X-ray emission was found, despite the fact that FR I radio sources are often associated with clusters of galaxies. Now with the entire 1 Ms dataset, it appears that such emission was present just below the prior detection threshold. The FR I lies within the extent of the extended emission but appears somewhat offset from its poorly defined center. Cohen et al. (2000) found 23 objects clustered around in a radius, implying a possible “filament” structure. In Figure 2, we show 32 galaxies with spectroscopic and photometric redshifts within the vicinity of source 3. At , the extended source has an unabsorbed soft-band luminosity of erg s-1 and an apparent physical size of about 200 kpc (see Figure 1). Thus it is likely to be a moderately luminous X-ray group or possibly a poor X-ray cluster.
Less is known about the other three sources, and none has a clear redshift. Based on the limited spectroscopic and photometric redshift information available and the magnitudes of the bright sources coincident with the X-ray emission, sources 1 and 4 may lie at and , respectively, while source 5 is thought to lie at –0.7. At such distances, these sources would have unabsorbed soft-band luminosities of (2–9) erg s-1 and apparent physical sizes of 200–300 kpc. As more X-ray and optical data become available, the nature of these sources should be revealed.
4.2 Cluster Candidates not Detected in the X-ray Band
ClG 12366215: This optical cluster was originally noted by Barger et al. (1999) as an overdensity of red objects, but it recently has been verified as a cluster by Dawson et al. (2001) based on spectroscopic follow-up of several bright sources within of , . The cluster lies at a redshift of . Based on the line-of-sight velocity dispersion calculated by Dawson et al. (2001) and the X-ray luminosity-velocity dispersion relation of Xue & Wu (2000), Dawson et al. calculate that the bolometric X-ray luminosity of ClG 12366215 should be erg s-1, or erg s-1 in the 0.5–2.0 keV band assuming a 6 keV thermal plasma model (e.g., Xue & Wu, 2000). Unfortunately, this cluster lies quite close to a CCD chip gap, so depending upon its exact shape and extent, portions of it may only be exposed for about half of the total exposure time. While vtpdetect did not formally detect the cluster, there are hints of diffuse X-ray emission in the adaptively smoothed soft-band image. Figure 4.2 shows the -band image of ClG 12366215 with the X-ray contours overlaid. Based on its X-ray appearance, we extracted counts for this putative source using a circular aperture with a radius, taking care to exclude the point source CXOHDFN J123642+621546 detected in Paper V. No significant detection was found, resulting in the 3 upper limits listed in Table 2. At a redshift of , the limiting soft-band and full-band luminosities are erg s-1 and erg s-1, respectively. The soft-band X-ray luminosity limit is at least a factor of 15 less than predicted by Dawson et al. and, if this source does have X-ray emission, it would have to be a very poor X-ray emitting cluster of galaxies (e.g., compare with the sample of Burns et al., 1996).
VLA J123725.7621128: This is one of only two VLA-detected sources in the vicinity of the HDF-N which shows extended radio emission on extragalactic scales (Richards et al., 1998); the other is VLA J123644.3621133 associated with source 3 described in 4.1. With a 1.4 GHz flux density of 6 mJy, this object is one of the brightest radio sources in the field and is classified morphologically as a WAT source. It is optically identified with an elliptical galaxy and is estimated by Hornschemeier et al. (2001) and Snellen & Best (2001) to lie at a redshift of –2 based on the the - relation. WAT sources are often associated with central dominant ellipticals in rich clusters of galaxies (e.g., Rudnick & Owen, 1976; Burns et al., 1994; Gomez et al., 1997), so it is surprising there are no hints of extended X-ray emission within its vicinity. Table 2 lists the 3 upper limit derived using a radius aperture centered on the radio source. At –2, the limiting soft-band and full-band luminosities are – erg s-1 and – erg s-1, favoring comparisons with X-ray weak clusters or typical X-ray groups.
Chandra ACIS-I adaptively smoothed soft-band contours of the undetected cluster of galaxies ClG 12366215 overlaid on a color image (the images of Barger et al 1999 represent blue, green and red, respectively). The properties of the image (e.g., contours and bar) are identical to those described in Figure 1. There is apparent X-ray emission but no formal detection (see 4.2). Abcissa denotes Right Ascension, ordinate denotes Declination.
5 Discussion and Conclusions
5.1 Basic Nature of the Extended X-ray Sources
The general X-ray and optical characteristics of the extended sources in the CDF-N (i.e., their soft X-ray luminosities, apparent X-ray sizes, and weak optical clustering) are most comparable to those of nearby groups of galaxies (e.g., Mulchaey et al., 1996; Ponman et al., 1996; Helsdon & Ponman, 2000). The only exception appears to be source 2, which has a larger angular size and contains an overdensity of unusual objects; it is likely to be a poor-to-moderate X-ray cluster at high redshift (i.e., ). This CDF-N observation has also allowed us to place strong constraints on two potential extended X-ray emitting systems, ClG 12366215 and VLA J123725.7621128. Both systems lie at high redshift and, from their undetected status, may still be in the early stages of dynamical evolution, having not yet formed a central concentration of hot gas and dark matter massive enough to produce detectable X-ray emission (e.g., Blanton et al., 2001; Donahue et al., 2001).
For the two sources with enough counts to perform detailed spectral analysis (sources 2 and 6), we have modeled their X-ray spectra and estimated thermal plasma temperatures. Comparing the most likely rest-frame X-ray luminosities and temperatures of these two sources with the well-established relation for clusters and groups (e.g., Allen & Fabian, 1998; Xue & Wu, 2000), we find that the X-ray temperature of source 2 is consistent with its bolometric luminosity if the X-ray source lies at high redshift (i.e., ), while the X-ray temperature of source 6 is clearly too high to be consistent with its bolometric X-ray luminosity (compare to Figure 1 of Xue & Wu, 2000). Whether the high temperature of source 6 is due point-source contamination or non-gravitational heating mechanisms such as star formation from individual group members or shock heating of the infalling gas (e.g., Metzler & Evrard, 1994; Ponman et al., 1996; Cavaliere, Menci, & Tozzi, 1997) cannot be resolved with our current X-ray data.
Some additional knowledge about the state of the X-ray emitting gas in source 2 can be gained from its observed X-ray morphology. The source appears to be irregular and double-peaked, suggesting a young merger. Unlike source 6, this double-peaked source appears to retain its extended, bimodal structure even in the minimally smoothed X-ray images (e.g., similar to the images made for source 6 in 4.1) and is likely to be real.111111Although we cannot conclusively exclude that possibility of some faint, point-source contamination. Recent simulations of offset merging clusters (Ricker & Sarazin, 2001) suggest that during the evolution of merging clusters, there is a short-lived phase of increased luminosity and temperature. Furthermore, for large impact parameters, the morphological structure of the merger remnant becomes bimodal. While this phase is likely to last at most only a few Gyrs, the strong enhancement in luminosity may help to offset their low observational occurrence. Perhaps the bimodal structure we see in this source 2, as well as in that of the Lockman Hole source RX J1053435735, are a natural consequence of this presumably common, albeit short-lived, stage in the formation of clusters and groups.
5.2 Number Density of Extended X-ray Sources
The six detected sources are all found in the “high-exposure” area
( 130 arcmin2; see 2) with exposure times
above 800 ks, implying an extended-source surface density of
167 deg-2 (1) at a limiting soft-band flux
of erg cm-2 s-1.
![[Uncaptioned image]](/html/astro-ph/0112002/assets/x2.png) Cumulative number counts as a function of
soft-band X-ray flux. Plotted are the extended sources from this
sample as well as those of McHardy et al. (1998), Vikhlinin et al. (1998),
Zamorani et al. (1999), and Lehmann et al. (2001). The solid and dashed
lines show two models of the number counts derived from integrating
the XLF of Ebeling et al. (1997) above erg s-1 and erg s-1,
respectively (see 5.2 for
details).
Cumulative number counts as a function of
soft-band X-ray flux. Plotted are the extended sources from this
sample as well as those of McHardy et al. (1998), Vikhlinin et al. (1998),
Zamorani et al. (1999), and Lehmann et al. (2001). The solid and dashed
lines show two models of the number counts derived from integrating
the XLF of Ebeling et al. (1997) above erg s-1 and erg s-1,
respectively (see 5.2 for
details).
Figure 5.2 shows the cumulative soft-band number counts for CDF-N extended sources (open circles). Also shown are the number counts from the ROSAT extended-source samples of McHardy et al. (1998), Vikhlinin et al. (1998), Zamorani et al. (1999), and Lehmann et al. (2001).
For comparison, we calculated the expected number density of X-ray clusters using the Schechter expression from the bolometric parameterization of the local cluster X-ray luminosity function (XLF) by Ebeling et al. (1997, see their Table 1). Two calculations were made. In both cases, we assumed no evolution in the , cosmology, and the integration was made over the range –1.2. We assigned a plasma temperature to each cluster assuming its bolometric luminosity follows the relations of Xue & Wu (2000). The solid line in Figure 5.2 denotes the expected number counts for sources with erg s-1 (bolometric, or equivalently erg s-1 in the 0.5–2.0 keV band for keV). Above this luminosity, the Ebeling et al. XLF is supported by observational data (see also Rosati et al., 1998). Only two of the six CDF-N extended sources (or 55 sources deg-2) are likely to lie above this luminosity limit; this number density is consistent with the predicted model. The dashed line in Figure 5.2 shows an extrapolation of the Ebeling et al. XLF to include objects with erg s-1 (bolometric, or erg s-1 in the 0.5–2.0 keV band for keV). Note that systematic studies of extended X-ray sources with erg s-1 have been hindered by their faint X-ray fluxes even locally, so this XLF extrapolation, while plausible, is somewhat uncertain. Even so, these faint sources appear to be consistent with the predicted model. Thus the CDF-N sources appear to be consistent to within error with no evolution in the XLF. We caution, however, that our results may be affected by “cosmic variance” due to the small field of view of this observation. Observations of larger-area fields with Chandra and XMM-Newton are needed to confirm this result.
Most of the extended sources in the CDF-N are likely to be groups, and, as such, are thought to be affected more by energy and momentum feedback from the stellar winds and supernovae following star formation than by cosmological parameters (e.g., Cavaliere, Giacconi, & Menci, 2000). In fact, such pre-heating phase is currently the best method for reconciling the different relations of groups and clusters. The lack of evolution in the extended source number counts suggests that this pre-heating phase may occur at redshifts higher than we tentatively observe here.
These findings also show that extended sources with fluxes erg cm-2 s-1 are not likely to contribute significantly to the 0.5-2.0 keV cosmic X-ray background (% using the results of Cowie et al., 2002). By comparison, extended sources with fluxes erg cm-2 s-1 are thought to contribute 10% to the cosmic X-ray background (e.g., Oukbir, Bartlett, & Blanchard, 1997; Rosati et al., 1998). The fact that we do not detect extremely luminous sources is understandable given their low surface density and that the HDF-N was chosen to avoid such objects.
5.3 Coincidence of X-ray Emission with Other Clustering Indicators
X-ray emission is thought to be an efficient method for tracing intermediate-density structure within the “cosmic web” of large-scale structure (e.g., Tully, 1987; Bond, Kofman, & Pogosyan, 1996; Pildis, Evrard, & Bregman, 1996; Cen & Ostriker, 1999; Pierre, Bryan, & Gastaud, 2000). The extensive multi-wavelength observations within the HDF-N and surrounding regions afford us an opportunity to compare the clustering seen at X-ray wavelengths with that seen using optical-to-near-IR and radio methods. We find significant overdensities of optical galaxies around most of the CDF-N extended X-ray sources from Monte Carlo simulations, but see little evidence for any strong red sequence of early type galaxies and, perhaps surprisingly, a stark contrast between the X-ray and optical appearances of detected clusters in Figure 1. Unlike most local clusters or groups, very few of the extended X-ray sources appear to be associated with obvious optical clusters or groups. This outcome is quite understandable, given the dramatic increase in the field galaxy number density at these magnitudes, but highlights a potential deficiency in relying on optical methods alone.
Considering the two sources with secure redshifts, source 3 falls on one of the redshift peaks noted by Cohen et al. (2000) and Dawson et al. (2001), and source 6 does not. This suggests that at least some low-level clustering occurs within these observed “filaments” of galaxies. The redshifts of the four other extended X-ray sources are still unknown and may possibly coincide with known overdensities. If the coincidence of X-ray groups and clusters with known “filaments” in the CDF-N region is anything like that in the ROSAT North Ecliptic Pole Survey, we should expect at least 25% (or 2) of the extended X-ray sources to lie within such large-scale structures (e.g., Burg et al., 1992; Brinkmann et al., 1999; Mullis et al., 2001). Alternatively, we find no evidence for X-ray emission associated with the optically detected cluster ClG 12366215.
At radio wavelengths, two FR I radio sources are known within the CDF-N region. These sources are predominantly thought to reside in or near rich clusters of galaxies. We find that one of these is radio objects is coincident with an extended X-ray source near the threshold of our current Chandra observation, while the other remains undetected (although X-ray and optical constraints cannot rule out a cluster).
Clearly the spatial coverage of the CDF-N is too small to permit firm conclusions about selection biases between these different cluster indicators. However, the analysis presented here does suggest that relying on any single technique may fail to detect some (and possibly many) potential clusters and groups.
5.4 Future Work
We have provided here an extremely deep view of the faint extended X-ray source population in the CDF-N. Several details about these objects are revealed, particularly for the brightest two sources, one of which appears to be bimodal and is perhaps undergoing a merger. While the six CDF-N objects generally confirm our understanding of less distant clusters and groups, they also provide a look into the past, when such objects were just beginning to form. Tighter constraints on these sources, both in terms of accurate distance determinations and deeper optical imaging, should improve our understanding of the filamentary structures in the vicinity of the HDF-N and (perhaps) cosmological models. Secure optical counterparts for many of the CDF-N extended sources are clearly the most important piece of information currently missing from our picture of these distant systems. Obtaining further constraints on the X-ray properties of these sources (e.g., temperatures, abundances, surface density profiles) will be difficult, given the large amount of observing time needed simply to detect them. As observations of the CDF-N continue with both Chandra and XMM-Newton, it may be possible to search for temperature variations between the two peaks in the tentative high redshift system. This would be a valuable diagnostic for evaluating the nature of this extended X-ray source (e.g., is the variation consistent with a merger shocks or cold cluster cores moving through low density, shock-heated intra-cluster gas).
References
- Alexander et al. (2001) Alexander, D. M., Brandt, W. N., Hornschemeier, A. E., Garmire, G. P., Schneider, D. P., Bauer, F. E., & Griffiths, R. E. 2001, AJ, 122, 2156
- Alexander et al. (2002) Alexander, D. M., Vignali, C., Bauer, F. E., Brandt, W. N., Hornschemeier, A. E., Garmire, G. P., & Schneider, D. P. 2002, AJ, in press (astro-ph/0111397)
- Allen & Fabian (1998) Allen, S. W. & Fabian, A. C. 1998, MNRAS, 297, L57
- Arnaud (1996) Arnaud, K. A. 1996, in ASP Conf. Ser. 101, Astronomical Data Analysis Software and Systems V, ed. G. Jacoby, & J. Barnes (San Francisco: ASP), 17
- Barger, Cowie, & Richards (2000) Barger, A. J., Cowie, L. L., & Richards, E. A. 2000, AJ, 119, 2092
- Barger et al. (1999) Barger, A. J., Cowie, L. L., Trentham, N., Fulton, E., Hu, E. M., Songaila, A., & Hall, D. 1999, AJ, 117, 102
- Bertin & Arnouts (1996) Bertin, E. & Arnouts, S. 1996, A&AS, 117, 393
- Blanton et al. (2001) Blanton, E. L., Gregg, M. D., Helfand, D. J., Becker, R. H., & Leighly, K. M. 2001, AJ, 121, 2915
- Bolzonella, Miralles, & Pelló (2000) Bolzonella, M., Miralles, J., & Pelló, R. 2000, A&A, 363, 476
- Bond, Kofman, & Pogosyan (1996) Bond, J. R., Kofman, L., & Pogosyan, D. 1996, Nature, 380, 603
- Brandt et al. (2001a) Brandt, W. N. et al. 2001a, AJ, 122, 1 (Paper IV)
- Brandt et al. (2001b) Brandt, W. N., et al. 2001b, AJ, in press (astro-ph/0108404; Paper V)
- Brinkmann et al. (1999) Brinkmann, W., Chester, M., Kollgaard, R., Feigelson, E., Voges, W., & Hertz, P. 1999, A&AS, 134, 221
- Bruzual & Charlot (1993) Bruzual A., G. & Charlot, S. 1993, ApJ, 405, 538
- Burg et al. (1992) Burg, R. et al. 1992, A&A, 259, L9
- Burns et al. (1994) Burns, J. O., Rhee, G., Owen, F. N., & Pinkney, J. 1994, ApJ, 423, 94
- Burns et al. (1996) Burns, J. O., Ledlow, M. J., Loken, C., Klypin, A., Voges, W., Bryan, G. L., Norman, M. L., & White, R. A. 1996, ApJ, 467, L49
- Cavaliere, Giacconi, & Menci (2000) Cavaliere, A., Giacconi, R., & Menci, N. 2000, ApJ, 528, L77
- Cavaliere, Menci, & Tozzi (1997) Cavaliere, A., Menci, N., & Tozzi, P. 1997, ApJ, 484, L21
- Cen & Ostriker (1999) Cen, R. & Ostriker, J. P. 1999, ApJ, 514, 1
- Chapman, McCarthy, & Persson (2000) Chapman, S. C., McCarthy, P. J., & Persson, S. E. 2000, AJ, 120, 1612
- Cohen et al. (2000) Cohen, J. G., Hogg, D. W., Blandford, R., Cowie, L. L., Hu, E., Songaila, A., Shopbell, P., & Richberg, K. 2000, ApJ, 538, 29
- Coleman, Wu, & Weedman (1980) Coleman, G. D., Wu, C.-C., & Weedman, D. W. 1980, ApJS, 43, 393
- Cowie et al. (2002) Cowie L. L., Garmire G. P., Bautz M. W., Barger A. J., Brandt W. N., & Hornschemeier A. E. 2002, ApJ, submitted
- Dawson et al. (2001) Dawson, S., Stern, D., Bunker, A. J., Spinrad, H., & Dey, A. 2001, AJ, 122, 598
- Donahue et al. (2001) Donahue, M. et al. 2001, ApJ, 552, L93
- Dobrzycki et al. (1999) Dobrzycki, A., Ebeling, H., Glotfelty, K., Freeman, P., Damiani, F., Elvis, M., & Calderwood, T. 1999, Chandra Detect 1.0 User Guide. Chandra X-ray Center, Cambridge
- Ebeling et al. (1997) Ebeling, H., Edge, A. C., Fabian, A. C., Allen, S. W., Crawford, C. S., & Boehringer, H. 1997, ApJ, 479, L101
- Ebeling, White, & Rangarajan (2001) Ebeling, H., White, D. A., & Rangarajan, F. V. N. 2001, MNRAS, submitted
- Ebeling & Wiedenmann (1993) Ebeling, H. & Wiedenmann, G. 1993, Phys. Rev. E, 47, 704
- Fanaroff & Riley (1974) Fanaroff, B. L. & Riley, J. M. 1974, MNRAS, 167, 31P
- Ferguson, Dickinson, & Williams (2000) Ferguson, H. C., Dickinson, M., & Williams, R. 2000, ARA&A, 38, 667
- Fernández-Soto et al. (1999) Fernández-Soto, A., Lanzetta, K. M., & Yahil, A. 1999, ApJ, 513, 34
- Fioc & Rocca-Volmerange (1997) Fioc, M. & Rocca-Volmerange, B. 1997, A&A, 326, 950
- Gehrels (1986) Gehrels, N. 1986, ApJ, 303, 336
- Gladders & Yee (2000) Gladders, M. D. & Yee, H. K. C. 2000, AJ, 120, 2148
- Gomez et al. (1997) Gomez, P. L., Pinkney, J., Burns, J. O., Wang, Q., Owen, F. N., & Voges, W. 1997, ApJ, 474, 580
- Hasinger et al. (1998) Hasinger, G. et al. 1998, A&A, 340, L27
- Helsdon & Ponman (2000) Helsdon, S. F. & Ponman, T. J. 2000, MNRAS, 319, 933
- Hill (2000) Hill, G. J. 2000, Proc. SPIE, 4008, 50
- Hill et al. (1998) Hill, G. J., Nicklas, H. E., MacQueen, P. J., Tejada, C., Cobos Duenas, F. J., & Mitsch, W. 1998, Proc. SPIE, 3355, 375
- Hoessel & Schneider (1985) Hoessel, J. G. & Schneider, D. P. 1985, AJ, 90, 1648
- Hornschemeier et al. (2001) Hornschemeier, A. E. et al. 2001, ApJ, 554, 742
- Kaastra (1992) Kaastra, J.S. 1992, An X-Ray Spectral Code for Optically Thin Plasmas (Internal SRON-Leiden Report, updated version 2.0)
- Kuntz (2000) Kuntz, K. D. 2000, Ph.D. Thesis, University of Maryland, 147
- Lehmann et al. (2000) Lehmann, I. et al. 2000, From Extrasolar Planets to Cosmology: The VLT Opening Symposium, Proceedings of the ESO Symposium held at Antofagasta, Chile, 1-4 March 1999. Edited by Jacqueline Bergeron and Alvio Renzini. Berlin: Springer-Verlag, 2000. p. 121.
- Lehmann et al. (2001) Lehmann, I. et al. 2001, A&A, 371, 833
- Liedahl, Osterheld, & Goldstein (1995) Liedahl, D. A., Osterheld, A. L., & Goldstein, W. H. 1995, ApJ, 438, L115
- Liu et al. (1999) Liu, C. T., Petry, C. E., Impey, C. D., & Foltz, C. B. 1999, AJ, 118, 1912
- Lyons (1991) Lyons, L. 1991, Data Analysis for Physical Science Students. (Cambridge: Cambridge University Press)
- Massey et al. (1988) Massey, P., Strobel, K., Barnes, J. V., &, Anderson, E. 1988, ApJ, 328, 315
- McHardy et al. (1998) McHardy, I. M. et al. 1998, MNRAS, 295, 641
- Mewe, Gronenschild, & van den Oord (1985) Mewe, R., Gronenschild, E. H. B. M., & van den Oord, G. H. J. 1985, A&AS, 62, 197
- Metzler & Evrard (1994) Metzler, C. A. & Evrard, A. E. 1994, ApJ, 437, 564
- Mohr & Evrard (1997) Mohr, J. J. & Evrard, A. E. 1997, ApJ, 491, 38
- Mukai (2000) Mukai, K. 2000, pimms Version 3.0 Users’ Guide. NASA/GSFC, Greenbelt
- Mulchaey (2000) Mulchaey, J. S. 2000, ARA&A, 38, 289
- Mulchaey et al. (1996) Mulchaey, J. S., Davis, D. S., Mushotzky, R. F., & Burstein, D. 1996, ApJ, 456, 80
- Mullis et al. (2001) Mullis, C. R., Henry, J. P., Gioia, I. M., Böhringer, H., Briel, U. G., Voges, W., & Huchra, J. P. 2001, ApJ, 553, L115
- Muxlow et al. (1999) Muxlow, T. W. B., Wilkinson, P. N., Richards, A. M. S., Kellermann, K. I., Richards, E. A., & Garrett, M. A. 1999, New Astronomy Review, 43, 623
- Oke & Gunn (1983) Oke, J. B. & Gunn, J. E. 1983, ApJ, 266, 713
- Oukbir, Bartlett, & Blanchard (1997) Oukbir, J., Bartlett, J. G., & Blanchard, A. 1997, A&A, 320, 365
- Pierre, Bryan, & Gastaud (2000) Pierre, M., Bryan, G., & Gastaud, R. 2000, A&A, 356, 403
- Pildis, Evrard, & Bregman (1996) Pildis, R. A., Evrard, A. E., & Bregman, J. N. 1996, AJ, 112, 378
- Poggianti (1997) Poggianti, B. M. 1997, A&AS, 122, 399
- Ponman et al. (1996) Ponman, T. J., Bourner, P. D. J., Ebeling, H., & Bohringer, H. 1996, MNRAS, 283, 690
- Postman & Lauer (1995) Postman, M. & Lauer, T. R. 1995, ApJ, 440, 28
- Raymond & Smith (1977) Raymond, J. C., & Smith, B. W. 1977, ApJS, 35, 419
- Richards (1999) Richards, E. A. 1999, Ph.D. Thesis, University of Virginia, 171 (see also PASP 112, 1001)
- Richards et al. (1999) Richards, E. A., Fomalont, E. B., Kellermann, K. I., Windhorst, R. A., Partridge, R. B., Cowie, L. L., & Barger, A. J. 1999, ApJ, 526, L73
- Richards et al. (1998) Richards, E. A., Kellermann, K. I., Fomalont, E. B., Windhorst, R. A., & Partridge, R. B. 1998, AJ, 116, 1039
- Ricker & Sarazin (2001) Ricker, P. M. & Sarazin, C. L. 2001, ApJ, 561, 621
- Rosati et al. (1998) Rosati, P., della Ceca, R., Norman, C., & Giacconi, R. 1998, ApJ, 492, L21
- Rudnick & Owen (1976) Rudnick, L. & Owen, F. N. 1976, ApJ, 203, L107
- Smith et al. (2001) Smith, G. P. et al. 2001, MNRAS, in press (astro-ph/0109465)
- Snellen & Best (2001) Snellen, I. A. G. & Best, P. N. 2001, MNRAS, 328, 897
- Snowden et al. (1998) Snowden, S. L., Egger, R., Finkbeiner, D. P., Freyberg, M. J., & Plucinsky, P. P. 1998, ApJ, 493, 715
- Stark et al. (1992) Stark, A. A., Gammie, C. F., Wilson, R. W., Bally, J., Linke, R. A., Heiles, C., & Hurwitz, M. 1992, ApJS, 79, 77
- Steidel & Hamilton (1993) Steidel, C. C. & Hamilton, D. 1993, AJ, 105, 2017
- Townsley et al. (2000) Townsley, L. K., Broos, P. S., Garmire, G. P., & Nousek, J. A. 2000, ApJ, 534, L139
- Tully (1987) Tully, R. B. 1987, ApJ, 323, 1
- Vikhlinin et al. (1998) Vikhlinin, A., McNamara, B. R., Forman, W., Jones, C., Quintana, H., & Hornstrup, A. 1998, ApJ, 502, 558
- Weisskopf et al. (2000) Weisskopf, M. C., Tananbaum, H. D., Van Speybroeck, L. P., & O’Dell, S. L. 2000, Proc. SPIE, 4012, 2
- Williams et al. (1996) Williams, R. E. et al. 1996, AJ, 112, 1335
- Xue & Wu (2000) Xue, Y. & Wu, X. 2000, ApJ, 538, 65
- Zamorani et al. (1999) Zamorani, G. et al. 1999, A&A, 346, 731
| (1) | (2) | (3) | (4) | (5) | (6) | (7) | (8) | (9) | (10) | (11) | (12) | (13) |
|---|---|---|---|---|---|---|---|---|---|---|---|---|
| ID | CXOHDFN Source | Region | Soft Counts | Full Counts | S-to-B Ratio | BR | Comments | |||||
| 1 | J123557.8621540 | 76.3 24.1 | 121.5 | 0.18 | 1.25 | 5.7 | 4.9? | 1.00††footnotemark: | 0.44? | |||
| 2 | J123620.0621554 | , | 273.8 37.2 | 430.7 63.6 | 0.32 | 13.5 | 32.3? | 0.68 | 0.68? | No bright optical counterparts | ||
| 3 | J123645.0621142 | 100.1 31.1 | 165.0 | 0.16 | 2.19 | 3.1 | 20.0 | 1.00 | 1.01 | Assoc. w. VLA J123644.3621133 (FR I) | ||
| 4 | J123704.6621652 | 121.3 31.8 | 203.6 56.2 | 0.17 | 1.25 | 6.0 | 3.7? | 0.98 | 0.38? | |||
| 5 | J123721.2621526 | 80.3 22.1 | 108.2 35.9 | 0.24 | 1.36 | 3.6 | 2.5–9.4? | 1.00 | 0.4–0.7? | |||
| 6 | J123756.0621506 | , | 303.4 26.3 | 368.5 38.8 | 0.99 | 0.28 | 17.1 | 2.1 | 1.00††footnotemark: | 0.19 |
Note. — Column 1: Source number. Column 2: Source name given as CXOHDFN JHHMMSS.SDDMMSS. Column 3: Source extraction region given as major axis and minor axis in arcseconds, and, if the region is not circular, the position angle in degrees. Columns 4 and 5: Background-subtracted 0.5–2.0 keV and 0.5–8.0 keV counts were found with aperture photometry, using the regions defined in column 3 and individual background annuli as noted in 2.2. The standard deviations for the source and background counts have been computed following the method of Gehrels (1986) and combined following the “numerical method” described in 1.7.3 of Lyons (1991). Column 6: The ratio of the total number of 0.5–2.0 keV source counts to the total number of 0.5–2.0 keV background counts expected within the region defined in column 2. Column 7: Band ratio (BR), calculated as the ratio of 2.0–8.0 keV count rate (or 3 upper limit) to 0.5–2.0 keV count rate. Errors have been combined following the “numerical method” described in 1.7.3 of Lyons (1991). Column 8: Rest-frame thermal plasma temperature as determined from the best-fit models to the ACIS-I spectra. Also listed are the 90% confidence errors calculated for one parameter of interest (). Column 9: Observed 0.5–2.0 keV fluxes in units of 10-16 erg cm-2 s-1 calculated assuming the best-fit thermal plasma temperature listed in Column 8 or, for sources with too few counts to allow meaningful spectral fitting, a rest-frame temperature of 1 keV. The fluxes have been corrected for the portions of the aperture masked out to eliminate contaminating point sources. Column 10: Absorption-corrected rest-frame 0.5–2.0 keV luminosities in units of 1041 erg s-1. For sources with too few counts to allow meaningful spectral fitting, we assumed a neutral hydrogen column density of cm-2. Column 11: Monte Carlo simulation probability of an overdensity of optical galaxies centered on the X-ray emission as compared to field sources. The probability indicates the fraction of randomly selected regions with fewer sources than found to be coincident with the X-ray source. Simulations were performed using either the -band or -band (denoted by ) images; see 3.2 for details. Column 12: Probable redshift (see 4.1). Column 13: Comments.
| (1) | (2) | (3) | (4) | (5) | (6) | (7) |
|---|---|---|---|---|---|---|
| Source | Soft Counts | Full Counts | Comments | |||
| ClG 12366215 | 83.7 | 151.5 | 4.9 | 21.6 | 0.85 | |
| VLA J123725.7621128 | 85.9 | 197.6 | 4.3 | 26.4–142.5 | ? | Wide angle tail radio source |
Note. — Column 1: Sources of potential extended X-ray emission which are not formally detected (see 4.2); ClG 12366215 is shown in Figure 4.2, since it appears to have some associated point-source emission. Columns 2 and 3: Upper limits on the 0.5–2.0 keV and 0.5–8.0 keV counts were found with aperture photometry, using 30 radius apertures as noted in 4.1. The upper limits are calculated at the 3 level for Gaussian statistics. Column 4: Observed 0.5–2.0 keV flux limits in units of 10-16 erg cm-2 s-1 calculated assuming an absorbed MEKAL single temperature thermal plasma spectrum with cm-2 and keV. Large deviations from the assumed temperature should not change the flux by more than 20%. The fluxes have been corrected for the portions of the aperture masked out to eliminate contaminating point sources. Column 5: Absorption-corrected 0.5–2.0 keV luminosity limits in units of 1041 erg s-1. Column 6: Probable redshift (see 4.2). Column 7: Comments.
Appendix A Appendix A: Hobby-Eberly Telescope Observations
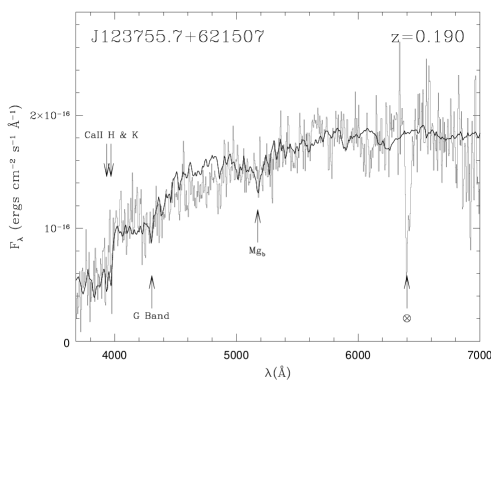
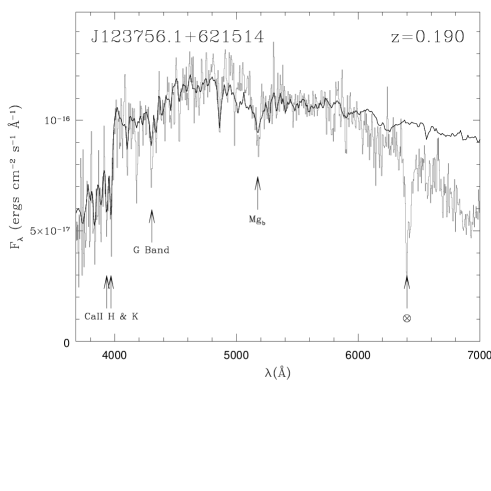
Moderate resolution long-slit spectroscopic observations were taken for two galaxies (123755.7621507 and 123756.1621514) that are likely to be associated with source 6. The spectra were taken during the moonless nights of 2001 June 13 and 14 with the LRS mounted at the prime focus of the HET. A 300 line mm-1 grism blazed at 5500 Å was used with a GG-385 UV-blocking filter. The detector was a thinned, antireflection-coated pixel2 Ford Aerospace CCD and was binned during readout; this produced an image scale of pixel-1 and a dispersion of 4.5 Å pixel-1. The spectra covered the range from 4150–9000 Å at a resolution of 20 Å. A slit was aligned at a position angle of during the first observation and exposed for 1300 s in an attempt to obtain simultaneous spectra of both objects. Only 123756.1621514 was exposed with enough signal-to-noise to extract a useful spectrum. A second observation of 1350 s was taken the next evening, this time with the slit aligned along the disk of 123755.7621507 (i.e., at a slit position angle of ) to increase the signal-to-noise ratio of the spectrum. Both observations were taken close to transit, with airmasses of 1.25 and 1.24, respectively. Conditions were less than ideal on the first night but were generally transparent and photometric on the second night; note that the first observation was performed shortly before the telescope closed down due to dust and high winds, and it appears that the spectrum of 123756.1621514 is consequently contaminated by dust extinction longward of 6000 Å. Unfortunately a flux standard star was not obtained during the first night, and thus we have used the flux standard from the second night to calibrate crudely the spectrum of 123756.1621514. Since we care only about the absorption features in the spectrum to extract a redshift, the overall shape of the continuum and its absolute normalization are not important. The flux standard star BD (Oke & Gunn, 1983; Massey et al., 1988) was observed during the second night at the same slit width and comparable air mass to flux calibrate our spectra. Ne and HgCdZn lamp exposures were taken each night to provide wavelength calibration lines. The wavelength calibration was confirmed using several narrow night sky emission lines (e.g., [O I] 5577, 6300) and should be accurate to 1 Å. At the beginning of each night, a series of quartz lamp spectra for flat fielding were obtained as well as a series of bias frames to remove residual structure in the DC offset not accounted for by the overscan region. No attempt has been made to remove the dark current, as it should be negligible.
The spectra were reduced using standard iraf procedures, and redshifts were assessed using the rv package and a template spectrum of the E0 elliptical galaxy NGC 3379 obtained at comparable spectral resolution. The key spectral features used to assess the redshifts of these two galaxies were the Ca II band, CH G band, and Mg I b absorption lines. Both 123755.7621507 and 123756.1621514 were found to lie at redshifts of . The flux-calibrated, extinction-corrected, rest-frame spectra for both sources are shown in Figure 1. To assess the accuracy of the redshift measurements and confirm the optical morphologies seen in Figure 1, we also display two spectral models from the PEGASE spectral synthesis templates (Fioc & Rocca-Volmerange, 1997) overlaid on the HET spectra. 123755.7621507, which appears to be an elliptical or bulge-dominated galaxy, is best fit with an old stellar population template. 123756.1621514, which appears to be a edge-on disk galaxy, is best fit with a young stellar population template. While these templates are not perfect matches to the data, they do clearly highlight the stellar absorption features of the respective galaxies. Note that the drop in the spectrum of 123756.1621514 above 6000 Å is likely due to atmospheric dust extinction.