Mid-Infrared Detection of a Hot Molecular Core in G29.96-0.02
Abstract
We present high angular resolution (05) 10 and 18 images of the region around G29.96-0.02 taken from the Gemini North 8-m telescope using the mid-infrared imager and spectrometer OSCIR. These observations were centered on the location of a group of water masers, which delineate the site of a hot molecular core believed to contain an extremely young, massive star. We report here the direct detection of a hot molecular core at mid-infrared wavelengths at this location. The size and extent of the core at 18 appears to be very similar to the morphology as seen in integrated NH3 maps. However, our observations indicate that the mid-infrared emission may not be exactly coincident with the NH3 emission.
1 Introduction
Very little is known about the earliest stages of massive star formation. O and B stars remain embedded in a shroud of obscuring natal material until they have evolved well past the zero age main sequence. This heavy extinction makes observations of high mass stars nearly impossible at wavelength shorter than 1 . In fact, little is still known about high mass star formation, even with the advent of sensitive near-infrared detector arrays in the recent decade.
Some observations of the earliest stages of massive star formation have come from deep molecular line imaging at the Very Large Array (VLA) of star forming regions containing water masers. These radio wavelength searches were seeking a molecular component to the ultracompact HII (UC HII) regions associated with young massive stars (Cesaroni et al., 1994). Owing to the high resolution and accurate astrometry of the VLA data, these new molecular line images showed that many water masers are not coincident with the UC HII regions at all, but instead are coincident with small, non-radio emitting cores that can be seen in molecular and sub-millimeter emission.
Cesaroni et al. (1994) observed four sites of UC HII regions in molecular transitions of NH3. They found small structures (0.1 pc), with kinetic temperatures greater than 50 and up to 200 K, densities approximating 107 cm-3, and masses of a couple hundred solar masses. Walmsley (1995) proposed that these hot molecular cores (or HMCs) could contain recently formed OB stars which are still undergoing an intense accretion phase. In this scenario it is believed that the water masers are excited by the embedded massive stellar sources and exist in their accreting envelopes, an idea originally proposed for OH masers by Mezger and Robinson (1968). In addition to the lack of observable emission at wavelengths less than 1 , Walmsley (1995) also argues that the high mass accretion rates of massive stars at these early stages could inhibit the onset of an observable UC HII region.
Cesaroni et al. (1994) argue that gas and dust would be well mixed in the ammonia cores and that there would be a high rate of collisions between the dust and gas. Kruegel and Walmsley (1984) estimate that temperature equilibrium between gas and dust should exist when n cm-3. Given the high densities of these cores, it is likely that the gas kinetic temperature is a fair approximation to the dust temperature. The gas temperatures were observed by Cesaroni et al. (1994) to be between 50 and 165 K. They argue that at these temperatures, the mid-infrared would be a promising wavelength regime for the discovery of more of these HMCs.
Of the four sources in the sample of Cesaroni et al. (1994), a source of great interest is G29.96-0.02. This is a clear case where the ammonia observations show a warm compact source, clearly offset (2) from a neighboring UC HII region and any extended radio continuum emission. The estimated core temperature is warm enough to detect at mid-infrared wavelengths, and the new generation of 8-meter class telescopes allows a resolution capable of separating the emission of the HMC from the warm dust in the nearby UC HII region. We present in this paper high resolution mid-infrared images of the region around G29.96-0.02, and the direct mid-infrared detection of the HMC at this site.
2 Observations and Data Reduction
Observations were obtained at the Gemini North Observatory 8-m telescope on 8 May 2001. The University of Florida mid-infrared camera/spectrometer OSCIR was used for all observations. OSCIR employs a Rockwell 128x128 pixel Si:As BIB (blocked impurity band) detector, with a 0084 pixel-1 scale at Gemini. The total field of view of the array is 1111. Images were taken through two filters, (=10.46 , =5.1 ) and (=18.06 , =1.7 ), centered on the coordinates of the radio continuum peak position of the UC HII region at R.A.(J2000)=18h46m0393, Decl.(J2000)=-0239219 (Hofner and Churchwell, 1996). Images presented in this paper have on-source exposure times of 180 seconds, and were taken at an airmass of 1.5. Background subtraction was achieved during observations via the standard chop-nod technique. Flux calibration was achieved by observing at a similar airmass the mid-infrared standard star Lyr, for which the flux densities were taken to be 38 Jy in the 10 filter and 12 Jy in the 18 filter. A point spread function (PSF) star was observed in conjunction with these observations to give an estimate of the spatial resolution of the observations. The full-width-half-maximum (FWHM) for the PSF star was 048 at 10 and 063 at 18 . Subtracting in quadrature the theoretical diffraction width yields for these observations an atmospheric seeing and/or telescope guiding contribution of 040 at both 10 and 18 .
During engineering work before these observations, a droplet of glycol coolant fell onto the dewar window, creating a small circular region of higher emissivity (and correspondingly, a lower window transmission) in the lower left (i.e. southwest) quadrant of the array. Though flatfielding did remove most of the effects of the spot (which is effectively 3 arcseconds in diameter), the spot in reality may change both the morphology and integrated flux of any source lying over it. Unfortunately, given the small field of view of OSCIR at Gemini and the large extent of the region being observed, the southern half of the UC HII region does lie over this spot.
3 Results and Discussion
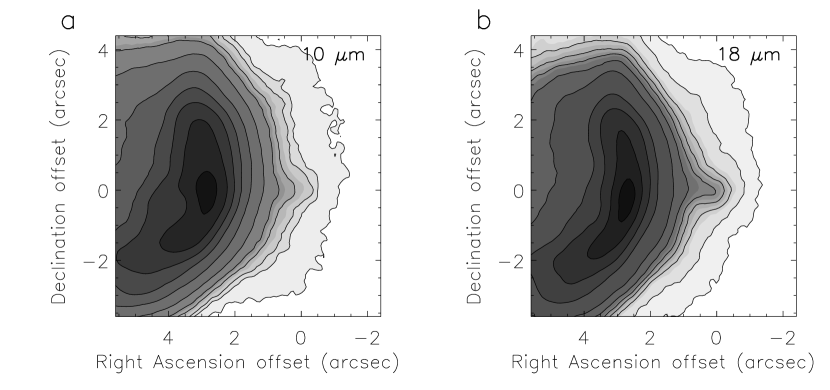
The 10 and 18 images are presented in Figure 1. The UC HII region is extremely bright in these images, and appears similar in morphology to the lower resolution mid-infrared images from Ball et al. (1996), and to the 2 cm radio continuum maps of Hofner and Churchwell (1996). We caution however that the actual mid-infrared morphology of the UC HII region may be different than presented in Figure 1 due to the effects of the glycol spot on the window. Furthermore, the flux of the UC HII region, may be likewise effected. Since the mid-infrared emission from the UC HII region extends beyond the field of view of the array, and since the glycol spot may affect the emission we do see, we do not present here any flux density estimates of the UC HII region itself. The HMC, on the other hand, was purposely placed on the array as far as possible from the glycol spot, and therefore the fluxes and morphology of the HMC presented here are not affected.
3.1 Background Subtraction and Flux Densities
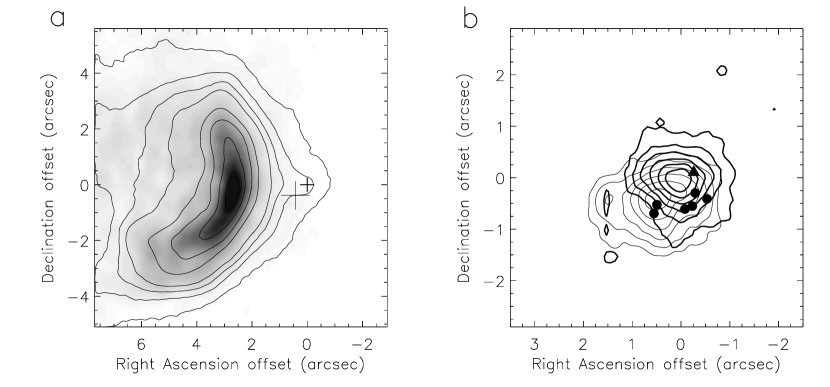
There is some difficulty in assessing the flux densities for the HMC because it lies in the extended dust emission from the UC HII region. However, in both the 10 and 18 images we were able to subtract out the UC HII region and background extremely well by fitting them with a 2 dimensional polynomial surface of fifth order in x and y, excluding a 2 2 rectangular region around the HMC (Figure 2). The flux densities for the HMC were found to be 113 mJy in the 10 filter and 2280 mJy in the 18 filter. Errors in the flux density measurements from uncertainty in the standard star flux, atmospheric variability, and uncertainty in the background subtraction lead to the quoted photometric error.
The HMC can be seen best at 18 , where it is brighter. This large difference between the 10 and 18 flux densities can be due to two factors. First, the HMC is cool and therefore peaks at wavelengths around 30 . Second, models by Osorio et al. (1999) of massive star formation via spherical accretion of a free-falling envelope of gas and dust show that silicate absorption is a prominent spectral feature at 10 during early stages of massive stellar evolution. We therefore would expect all HMCs to be more readily observed in the mid-infrared at wavelengths greater than 14 due to the rising SED and the absence of significant absorption at these longer wavelengths.
However in this particular case, the measured mid-infrared flux densities for the HMC in G29.96-0.02 yield a derived color temperature of 118 K under the assumption of optically thick emission, and 105 K in the optically thin case. The presence of cooler overlying absorbing dust would require yet higher temperatures. All of these temperature estimates are significantly warmer than the temperature of 85 K estimated by Cesaroni et al. (1994) from observations of NH3. The optically thin temperature is closest to the temperature derived from the ammonia observations, and may indicate that the mid-infrared emission is therefore optically thin. Moreover, this temperature difference is unlikely to be a result of differences between the local temperatures of the dust and gas, as Cesaroni et al. (1994) noted that these should be well-coupled. A possible explanation for this difference is that the optical depth unity surface of NH3 may be at a slightly larger radius in the HMC than the optical depth unity surface at 10 . Furthermore, we could be averaging over regions with different temperatures, possibly because of the presence of a radial temperature gradient or unresolved multiple sources, and that warmer regions contribute more strongly to the mid-infrared.
3.2 Hot Core Morphology
At both 10 and 18 the core is resolved, and is elongated in the E-W direction (Figure 2). The overall size and morphology of the HMC at 18 is similar to the integrated NH3(4,4) maps of Cesaroni et al. (1998). From gas kinematic studies, it was found that there is a velocity gradient along this axis of elongation in the molecular lines of NH3(4,4) (Cesaroni et al., 1998) and SiO(21) (Maxia et al., 2001). The combination of elongation of the molecular material and this velocity gradient has lead to the suggestion that this is a rotating disk around an accreting massive protostar.
The elongation of the mid-infrared source is very similar in both 10 and 18 . The Gaussian fits to the HMC yield a position angle of 94 and a major-to-minor FWHM ratio of 1.26 for the 10 image and 1.25 for 18 . The observed FWHM of the major axis of elongation at 10 is 133 and at 18 it is 142. The deconvolved source size obtained by subtracting the PSF FWHM in quadrature from the observed FWHM for the HMC is 123 at 10 and 127 at 18 . This corresponds to physical diameters of 7380 and 7620 AU, respectively, using a distance of 6.0 kpc (Pratap et al., 1999).
3.3 Astrometry
The absolute positions of the mid-infrared sources are unknown. No attempt was made to achieve accurate astrometry at the telescope due to time constraints. However, we detected the mid-infrared component of the UC HII region and the HMC, both of which have radio positions known to high absolute accuracy. In spite of this, there is still an ambiguity in establishing the correct astrometry of the sources. This stems from the fact that the peak of the UC HII region and the peak of the HMC are farther apart in the mid-infrared (26) than in the radio (21). This yields two possible astrometric scenarios.
3.3.1 Aligning the emission from the hot core
Because the morphology of the HMC at 18 is similar to the ammonia morphology in size, extent, and shape, we might assume that the emission is coming from the same source. Astrometry could be determined by registering the peaks of the HMC in the 18 map and the ammonia map of Cesaroni et al. (1998). In this astrometric scenario, the easternmost water masers of Hofner and Churchwell (1996) would be coincident with the ammonia and mid-infrared peaks. The rest of the water masers to the west of the peak, as well as the methanol masers, would then appear to be coming from a region traced by the outer contours of the mid-infrared and ammonia emission.
The problem with this alignment is that it requires that the arc of infrared emission from the UC HII region lie to the east of the arc of radio continuum emission. As the ionizing star is located within the arc (Watson et al., 1997), this requires that the mid-infrared emission arises closer to the ionizing star than the radio continuum emission. Given the similarity of the morphology of the arc in the mid-infrared and radio, and given that both are generated at locations where stellar photons encounter dense gas, we would expect both arcs to closely coincide.
3.3.2 Aligning the emission from the UC HII region
The more plausible scenario is to register the mid-infrared and radio images by aligning the peaks of the UC HII region at both wavelengths. In this case, however, we have the mid-infrared emission peak of the HMC offset to the southwest 3000 AU (05) of the HMC peak seen in ammonia emission. This offset between emission at molecular wavelengths and the mid-infrared is similar to that seen by Keto et al. (1992) for the HMC in W3(OH) which are offset by about 3500 AU. We show this astrometric scenario in Figure 3 with the locations of the water (Hofner and Churchwell, 1996) and methanol (Minier et al., 2001) masers overplotted. The postions of these masers are known to a high astrometric accuracy with respect to the ammonia emission ().
We could conjecture in this scenario that the offset between the ammonia and mid-infrared peaks may be due to optical depth effects. The core might be so dense that mid-infrared emission cannot escape here, and instead the mid-infrared emission that we are seeing is apparently tracing hot dust in a less embedded environment to the northeast. However, as metioned earlier, the color temperatures derived from the mid-infrared flux densities seem to indicate that the mid-infrared emission is optically thin. Furthermore, we noted that the difference between the mid-infrared derived color temperature and temperature derived from ammonia observations may be due to the presence of multiple sources. A second conjecture is that there may be two sources in close proximity to each other, making the source appear to be extended at both wavelengths. The observed extended emission of both the dust and ammonia might overlap, but the ammonia emission peaks with the easternmost water masers, while the mid-infrared dust emission appears to wrap around the ammonia peak. These two sources could therefore be in slightly different evolutionary stages, with the eastern source being extremely young and highly embedded and the western source being more evolved and therefore less embedded.
3.4 Millimeter Observations and SED Modeling
Apart from the mid-infrared continuum observations presented here, this HMC has also been observed at two other continuum wavelengths, namely 1 and 3 mm (Maxia et al. 2001). If the mid-infrared emission indeed comes from the same location as the 1 and 3 mm emission, one could model the SED from this source and determine physical parameters, such as accretion rates and luminosities (Osorio et al., 1999). Even if we believe that there is a single HMC responsible for the emission at all wavelengths, there appears to be problems with the 1 and 3 mm flux densities of Maxia et al. (2001). The slope of the SED in the Rayleigh-Jeans portion of the distribution is predominantly determined by the dust opacity at these wavelengths. Most models adopt a power law for the dust opacity of the form, , where for . Given the flux density values of Maxia et al. (2001), the value for would be negative, which seems unlikely. It seems plausible that the large beam size of the millimeter observations (HPBWaverage ) of Maxia et al. (2001) may have led to an inaccurate subtraction of the millimeter emission of the UC HII region from that of the HMC. Futhermore, observations at 3 mm are more prone to contamination by free-free emission from the nearby UC HII region than at 1 mm. At present therefore, we are only able to constrain the Wien side of the SED using our two mid-infrared flux density measurements, and the Rayleigh-Jeans side by upper limits from other observations. These types of loose constraints to the modeling cannot estimate physical parameters of the HMC with accuracy. Better sampling of the SED is needed from the mid-infrared to the millimeter.
If there are two HMCs here, the millimeter fluxes from these two source are blended in the flux densities quoted in Maxia et al. (2001) because of insufficient spatial resolution. In order to determine whether this site contains more than one HMC, and whether a more evolved source is responsible for the mid-infrared emission near the ammonia core, higher spatial resolution millimeter or submillimeter observations (e.g. ALMA) are required.
4 Conclusions
We have directly detected the hot molecular core of G29.96-0.02 at mid-infrared wavelengths. The size and morphology of the HMC in the mid-infrared is very similar to its appearance in the integrated NH3(4,4) maps of Cesaroni et al. (1998). The mid-infrared emission is elongated E-W, as is the ammonia emission. It is likely, however, that more than one embedded stellar source may exist at this location or that the emission in the mid-infrared and the ammonia emission may not be coming from the same location in the HMC. Higher resolution observations ranging between the mid-infrared and millimeter wavelengths are needed to investigate the possible duplicity of the HMC or to perform any accurate modeling of the HMC SED.
References
- Ball et al. (1996) Ball, R., Meixner, M.M., Keto, E., Arens, J.F., and Jernigan, G. 1996, AJ, 112, 1996
- Blaauw (1991) Blaauw, A. 1991, in The Physics of Star Formation and Early Stellar Evolution, ed. C.J. Lada & N.D. Kylafis (Dordrecht:Kluwer), 125
- Cesaroni et al. (1994) Cesaroni, R., Churchwell, E., Hofner, P., Walmsley, C.M., and Kurtz, S. 1994, A&A, 288, 903
- Cesaroni et al. (1998) Cesaroni, R., Hofner, P., Walmsley, C.M., and Churchwell, E. 1998, A&A, 331, 709
- Hofner and Churchwell (1996) Hofner, P. and Churchwell, E. 1996, A&AS, 120, 283
- Keto et al. (1992) Keto, E., Proctor, D., Ball, R., Arens, J., Jernigan, G. 1992, ApJ, 401, 113
- Kruegel and Walmsley (1984) Kruegel, E. and Walmsley, C.M. 1984, A&A, 130, 5
- Maxia et al. (2001) Maxia, C., Testi, L., Cesaroni, R., and Walmsley, C.M. 2001, A&A, 371, 287
- Mezger and Robinson (1968) Mezger, P.G. and Robinson, B.J. 1968, Nature, 220, 1107)
- Minier et al. (2001) Minier, V., Conway, J.E., and Booth, R.S. 2001, A&A, 369, 278
- Osorio et al. (1999) Osorio, M., Lizano, S., and D’Alessio, P. 1999, ApJ, 525, 808
- Pratap et al. (1999) Pratap, P., Megeath, S.T., and Bergin, E.A. 1999, ApJ, 517, 799
- Sobolev and Deguchi (1994) Sobolev, A.M., and Deguchi, S. 1994, A&A, 291, 569
- Sobolev et al. (1997) Sobolev, A.M., Cragg, D.M., & Godfrey, P.D. 1997, A&A, 324, 211
- Walmsley (1995) Walmsley, M. 1995, Revista Mexicana de Astronomia y Astrofisica Conference Series, 1, 137
- Watson et al. (1997) Watson, A.M., Coil, A.L., Shepherd, D.S., Hofner, P., & Churchwell, E. 1997, ApJ, 487, 818