GAMMA RAY BURSTS: SOME FACTS AND IDEAS
Gamma Ray Bursts (GRBs) are the most explosive events after the big bang: their energy output corresponds to a sizeable fraction of a solar mass entirely converted into energy in a few seconds. Although many questions about their progenitors remain to be answered, it is likely that they are generated by a newly formed and fast spinning black hole. The colossal power characterizing GRBs is carried by a surprisingly small amount of matter, which is accelerated to speeds differing from by one part in ten thousands. GRBs are then the most (special and general) relativistic objects we know of. Since GRBs are the brightest sources at high redshift, albeit for a limited amount of time, they are also the best torchlights we have to shine the far universe.
1 Introduction
On July 2, 1967, the american VELAaaaNote that the name VELA stands for “to watch”, from the spanish velar. satellites detected a flash of mysterious gamma rays coming from space. Soon after, other events, similar in nature and duration, were detected, even if the announcement of this major discovery awaited a few years, when was finally reported by Klebesadel, Strong & Olson (1973). Gamma–ray bursts (GRB) were therefore discovered by accident, thanks to a series of small military satellites designed to detect the radiation produced by the explosion of thermo–nuclear bombs, that had recently being banned by an international treaty. Even if small X–ray detectors could be enough for the detection of nuclear bomb exploding on earth, it was thought that the russians could have the technology to let a bomb explode on the dark side of the moon. In this case the X–rays are completely shielded, but the radio–active blast triggered by the bomb and expanding beyond the lunar dish, produces detectable –rays. This was the reason for having small –ray detectors on board. The VELA (limited) capability to reconstruct the source direction through differences in the arrival photon time (there always were two or more satellites in orbit) enabled to exclude the earth, the moon and the sun as sources, and established the cosmic origin of GRBs (see J. Bonnell at http://antwrp.gsfc.nasa.gov/htmltest/jbonnell/www/grbhist.html).
30 years since their detection by the VELA satellites, we now start to understand the physics of GRBs. This has been made possible by the precise localization of the Wide Field Camera of SAX, which allowed the detection of their X–ray afterglow emission (Costa et al. 1997) and the optical follow up observations, leading to the discovery that they are cosmological sources (van Paradijs et al. 1997). The huge energy and power releases required by their cosmological distances support the fireball scenario (Cavallo & Rees 1978; Rees & Mészáros 1992; Mészáros & Rees 1993), even if we do not know yet which kind of progenitor makes the GRB phenomenon.
There are already excellent reviews on GRBs (van Paradijs, Kouveliotou, & Wijers 2000; Meszaros 2001, Pian 2001, Klose 2000, Piran 1999, Meszaros 1999, Fishman & Meegan 1995), and I will not even try to be exhaustive in this contribution. I will instead concentrate on non–technical aspects of this very active research field, aiming at non specialized readers, and to point out some of the problems that are still under discussion.
2 Why GRBs are so fascinating?
Since their discovery, GBRs acquired a special “aura”, due, I think, mainly to their mysterious nature which persisted for decades. This certainly attracted many astrophysicists looking for a well posed but unsolved problem, and part of the popularity of GRBs is still due to that. The mystery lasted for so long because it was not possible to detect any counterpart at any wavelength, due to the too large error boxes of the positions given by the –ray instruments. Now, after knowning about their cosmological nature, the importance of GRBs has, if possible, increased, because they are good probes in at least three broad areas of physics: general relativity, special relativity, and cosmology. In fact we suspect they flag the birth of a stellar mass black hole, and that the corresponding liberation of energy is able to accelerate matter to bulk Lorentz factors exceeding 100, equivalent to speeds differing from by less than one part in ten thousand. When shining, they are the most powerful objects of the universe, and even if their brightness decreases fast, they offer the opportunity to explore the far universe (i.e. redshift greater than 10, if such distant bursts exist) with a level of detail impossible to achieve with any other class of objects.

3 Facts I: the pre–BeppoSAX era
After the discovery phase and after the confirmation by many small satellites hosting on board –ray detectors, we entered in the Compton Gamma Ray Observatory (CGRO) satellite era. Launched in April 1991, it had onboard several high energy instruments, and in particular BATSE, made by 8 –ray detectors (sensitive in the 20–600 keV range) especially designed for GRB observations, and EGRET, sensitive above 100 MeV.
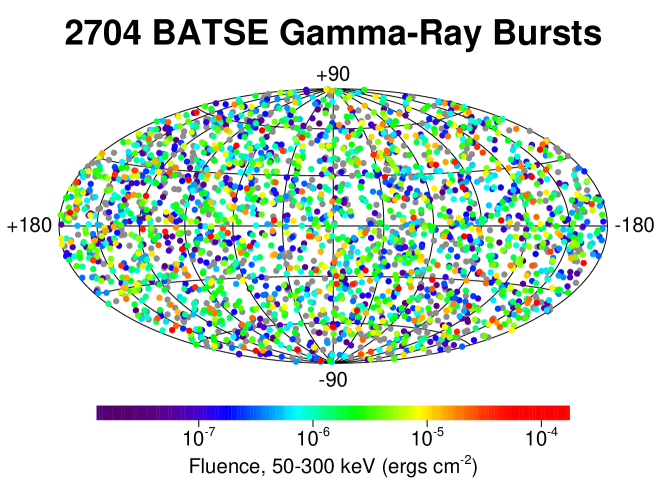
Isotropy in the sky — Fig. 1 shows the positions of 2704 bursts detected by BATSE, and it can be seen that their locations are distributed completely isotropically in the sky. No dipole or quadrupole moments have been detected.
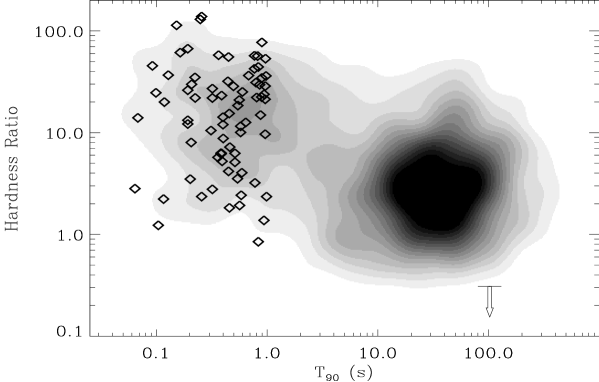
Duration — Fig. 2 shows that GRBs seem to come in (at least) two flavors: the majority of them lasts for more than 2 seconds, while about one third is shorter. All information derived from the precise localization of GRBs refer to long bursts. The bimodality of the distribution of their duration (measured by the time within which 90 per cent of the total fluence is contained) is confirmed by the associated spectral shape, since short bursts, on average, appear harder than long GRBs. Fig. 5 shows the hardness ratio (which is a measure of the slope of the spectrum: larger values means that the flux at high energies is more dominating) as a function of the duration of the emission.
 |
 |
 |
 |
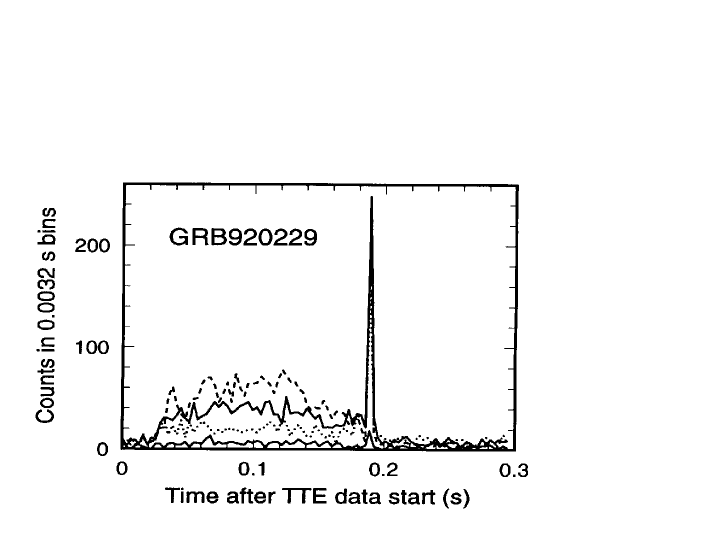
The light curve of GRBs is erratic (see Fig. 3) and sometimes highly variable: spikes as short as a fraction of a millisecond have been detected (see Shaefer & Walker 1999 and Fig. 4). The issue of variability is central for the modeling of GRBs: the extremely short timescales we observe demand large Lorentz factors, and the fact that the spikes at early and late times of the prompt emission have similar timescales (i.e. their duration does not increase) are major proofs against external shocks (see below) causing the prompt emission of GRBs (Fenimore, Ramirez–Ruiz & Wu 1999).
In addition, as Amelino–Camelia et al. (1998) pointed out (see also these proceedings) the very short variability of high energy photons coming from a cosmological (i.e. redshift greater than one) source can carry key information about the structure of spacetime, which can limit the possibility of having a breaking of the Lorentz invariance as proposed by some theories.
Fluences — Most –ray fluences (i.e. the flux integrated over the duration of the burst) are in the range – erg cm-2. The number counts of bursts are very flat, with . Schmidt (2001) finds that short and long bursts have similar values of , while Tavani (1998) found that short and soft bursts show little deviation from the Euclidean value .
Spectra — The spectra of GRBs are very hard, with a peak (in a – plot) at an energy of a few hundreds keV. Fig. 6 shows the distributions of the photon spectral indices derived by fitting the spectrum with the Band function (Band et al. 1993), consisting in two smoothly connected power laws (from Lloyd & Petrosian 1999, 2000, see also Preece et al. 1998), defined as at low energies and at high energies. As can be seen, the –distribution peaks in the range [1, 0.5] corresponding to –. This spectral index varies during the burst, as does . The general trend is that the spectrum softens, and decreases, with time. More precise statements must however wait for larger area detectors, since what we inevitably do, at present, is to fit a time integrated spectrum of a very rapidly variable source: the minimum integration time is 0.1 second for the strongest bursts, while the variability timescales can be hundreds of times shorter. Some bursts have been detected at very large –rays energies ( 100 MeV) by the EGRET instrument (see the review by Fishman & Meegan 1995, and references therein).

4 Facts II: the BeppoSAX era
Launched on April 1996, the BeppoSAX satellite made the breakthrough observations of GRBs, succeeding in positioning them with error boxes of only a few arcminutes through its coded mask Wide Field Camera sensitive at medium–hard X–ray energies [2–25 keV]. This made it possible to promptly slew the satellite in the found direction, to observe the error box region with the Narrow Field Instruments (NFI, in the 0.1–10 keV band) and to detect (in all cases but one) a new fading X–ray source , immediately identified as the X–ray afterglow of the GRB. Thanks to the prompt dissemination of the coordinates through the Gamma–ray Burst Coordinates Network (i.e. the GCN system, created by Scott Barthelmy) all ground based telescopes can point the target and try to detect the optical (and IR, and radio) afterglow.
X–ray afterglows — Usually, BeppoSAX could re–point in 6–8 hours from the trigger, and detect the X–ray afterglow, at an initial level of erg s-1 cm-2 or higher, and with a flux decaying roughly as – . The spectral shape is remarkably softer than the prompt emission, with roughly proportional to . When does the afterglow begins? We do not know yet, and this is one of the key question that HETE II and especially Swift can answer. Some hints (from SIGMA: GRB 920723, Burenin et al. 1999; from BATSE: GRB 980923, Giblin et al. 1999; from BeppoSAX, Frontera et al. 2000) suggest that the afterglow starts during the prompt emission or immediately after (and this would be in agreement with the optical flash observed in GRB 990123), but much more firm evidence is needed.
Optical afterglows — For about 1/2 of the bursts with good locations an optical afterglow has been detected. The monochromatic flux decreases in time as a power law –. Usually, the magnitudes of the optical afterglow detected one day after the –ray event are in the range 19–21. GRB 990123 is still the only burst detected so far in the optical while the prompt emission was still on, by the robotic telescope ROTSE, 22 seconds after the –ray trigger at , reaching 47 seconds after the trigger (Akerlof & McKay 1999; Akerlof et al. 2000) bbbThis is the optical flash, and is interpreted by the emission of the reverse shock crossing the fireball when first impacting into the interstellar material. The term flash is indeed appropriate. A magnitude 9 at a redshift corresponds a power erg s-1 in the optical band, meaning that if the same kind of object switches on at 1 kpc from earth, we would have two equally bright Suns in the sky, albeit for a short time.. For a complete review about the issue of optical and infrared afterglows see Pian (2001).
More than half of the bursts whose X–ray afterglow is detected could not be detected at optical frequencies, despite many of them have been observed with large telescopes at early times (see below and Lazzati, Covino & Ghisellini 2002).
Radio afterglows — The first GRB radio afterglow was detected for GRB 970508. In this case, the radio flux at 8.5 GHz behaved “nervously” for about one month, to “calm down” after this time. This has been interpreted as due to interstellar scintillation in our Galaxy, affecting sources of very small angular diameter. Therefore the fact that scintillation ceased after some time was a sign of the increased source dimension. Since this is a burst of known distance, it is possible to estimate the size needed to quench the scintillation effect, and then to estimate the velocity of the fireball, which turned out to be relativistic (Frail et al. 1997).
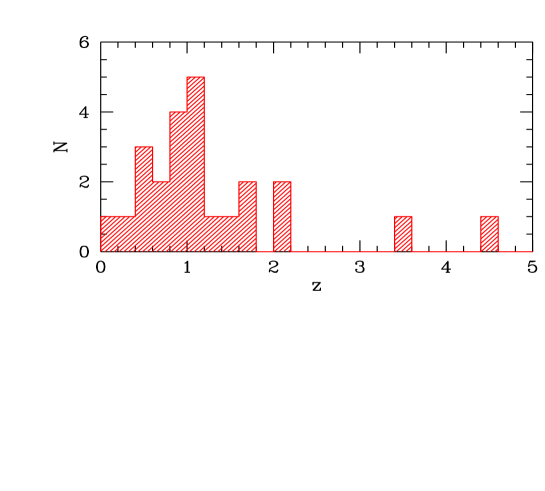
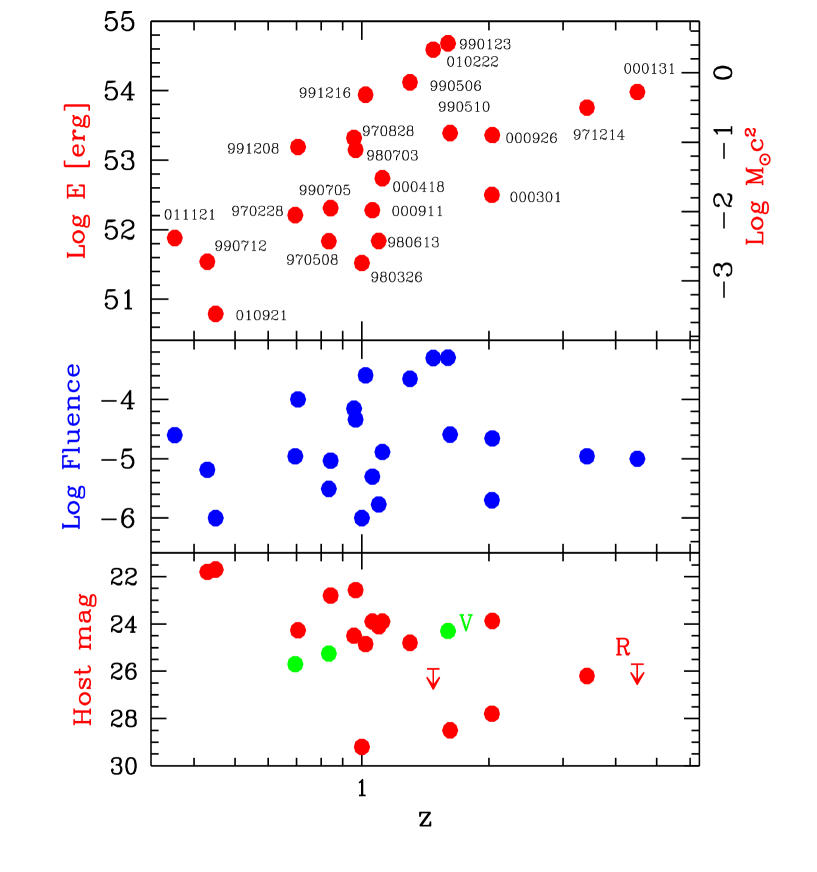
Redshifts —
Up to November 2001, about 20 redshifts of GRBs have been measured,
and Fig. 7 shows their distribution.
Apart from the controversial case of GRB 980425, possibly
associated with the nearby SN 1998bw (at ),
all other redshifts are within the 0.4–4.5 range.
Fig. 8 shows the –ray luminosity (assumed isotropically
emitted), the –ray fluence and the magnitude of the
host galaxy (when detected) as a function of redshift.
A particularly useful updated link with all the relevant information
about bursts with good localization is maintained by Jochen Greiner at:
http://www.aip.de/jcg/grbgen.html

The host galaxies — The host galaxies of GRBs are not particularly luminous (), they appear blue (Hogg & Fruchter 1999), and the location of the optical transient is never very distant from the galaxy center, in agreement with the idea that long GRBs are associated with massive (and short lived) progenitors (for a recent review see Djorgovski et al. 2001). Fig. 8 shows the magnitude of the host as a function of redshift (almost all magnitudes are in the band).
The GRB–Supernova connection — It is possible that GRB 980425 was associated with the nearby supernova SN 1998bw. If so, this GRB would be very anomalous, being 3–4 orders of magnitude underluminous with respect to the other bursts of known redshift. On the other hand even SN 1998bw is far from being a typical member of its class (for instance, from its radio light curve Kulkarni et al. 1998 estimated a very high brightness temperature, requiring a bulk flow with ). Independent of the reality of this association, these observations triggered much interest about the possibility that GRB are in some way associated with some rare kind of supernovae. The other main evidence in favor of it is the re–brightnening of the late optical–infrared light curve observed in some afterglows (Bloom et al. 1999; Reichart 1999; Galama et al. 2000; Lazzati et al., 2001), especially if accompanied by evidence of a spectral change (spectrum which becomes redder), as appropriate if the supernova emission exceeds the afterglow light (see one example in Fig. 9).
Iron lines — There are five bursts displaying evidence for large amounts of X–ray line emitting material around the site of the explosion: four (GRB 970508, Piro et al., 1999; GRB 970828, Yoshida et al., 1999; GRB 991216, Piro et al., 2000; GRB 000214, Antonelli et al., 2000) show an emission feature during the afterglow, and one (GRB 990705, Amati et al., 2000) displays an edge in absorption during the burst itself. The detection of emission features in the afterglow spectra of GRBs some hours after the GRB event poses strong constraints on the properties of the line–emitting material.
The first constraint comes from the large detected flux. Assuming the line lasts for seconds at the level of erg cm-2 s-1 for a burst at , this corresponds to line photons. If each iron atom produces line photons, the required total mass of iron is solar masses. It is clear that we need at the very least to bring down to reasonable values. This means that the iron must recombine sufficiently fast, and this implies large densities and not so large temperatures.
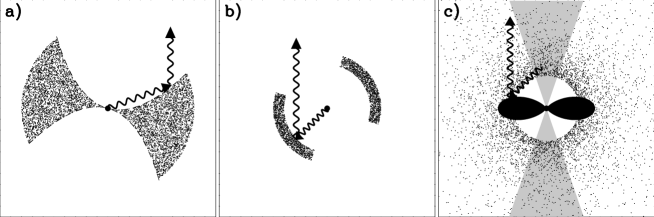
The second constraint concerns the geometrical setup: the line emitting material cannot be between us and the burst, because 1) we should see an absorption line, and 2) the large amount of material would stop the fireball and the associated afterglow, contrary to what observed. The line emitting material must therefore be out of the line of sight and nevertheless be illuminated by a large amount of ionizing flux. Furthermore, for a line observed after a time since trigger, we must have that the emitting material must be close to the burst site, within a distance given by
| (1) |
where is the angle between the location of the material and the line of sight (see the cartoon in Fig. 15 showing some possible set–ups, and see below for a brief discussion of the proposed models).

4.1 Afterglow in short GRBs?
Lazzati, Ramirez–Ruiz & Ghisellini (2001) have summed up the BATSE light curves of the best signal–to–noise bursts lasting for less than one second. The resulting 76 light curves were analized separately in each of the four BATSE energy channels, and some excess was found in the first two BATSE channels, between 30 and 100 seconds after the trigger. The four flux data points (two detections and two upper limits) indicate a relatively spectrum, similar to the shape of the X–ray afterglow of long bursts. This could be the first detection of an afterglow in short bursts: if confirmed, it proves that also short bursts can transform bulk into random energy, suggesting the presence of a relativistic fireball also in this case.
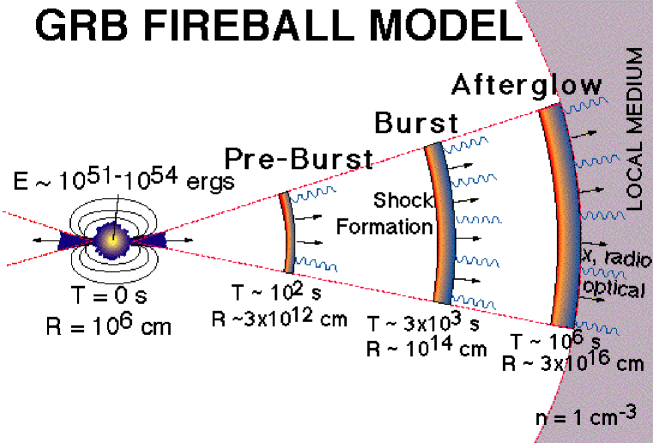
5 The fireball
The energy involved in GRB explosions is huge. No matter in which form the energy is initially injected, a quasi–thermal equilibrium (at relativistic temperatures) between matter and radiation is reached, with the formation of electron–positron pairs accelerated to relativistic speeds by the high internal pressure. This is a fireball (Cavallo & Rees 1978). When the temperature of the radiation (as measured in the comoving frame) drops below 50 keV the pairs annihilate faster than the rate at which they are produced. But the presence of even a small amount of barions, corresponding to only , makes the fireball opaque to Thomson scattering: the internal radiation thus continues to accelerate the fireball until most of its initial energy has been converted into bulk motion. After this phase the fireball expands at a constant speed and at some point becomes transparent.
The compactness problem — Even before the discovery that GRBs are at high redhift, researchers were puzzled about such rapidly variable and strong high energy fluxes. In fact, even if bursts were close by (say, in the Galactic halo), they would be highly super–Eddington, and this poses the problem to explain how high energy –rays can survive against the – process. In fact, from the minimum variability time–scale (time needed to double or halve the flux) we can estimate, by a causality argument, the size of the emitting region. Therefore we can form the luminosity to size ratio which controls the processes involving photons, and in particular the process (in fact its optical depth . Taken at face value, the ratio is too large (and therefore GRBs are too compact) to let any photon above threshold for pair production (i.e. with an energy greater than ) to survive.
Relativistic motion — If the source is moving relativistically, then the observed photon energies are blueshifted, and the typical angles (as observed in the lab frame) between photons are smaller, decreasing the probability for them to interact. This solves the compactness problem. Bulk Lorentz factors are required to avoid strong suppression of high energy –rays due to photon–photon collisions. It is worth stressing here that the photon–photon problem is particularly demanding if one associates the MeV photons seen by EGRET with the prompt emission of GRBs. It is much less severe if it is instead associated with the early afterglow. This is still an unsettled issue.
There is however a second argument demanding for strong relativistic motion, concerning the very fast observed variability. In fact the size associated with one millisecond is cm, which is much too small to be optically thin. To match the observed timescales with the size at which the fireball becomes transparent ( cm) we need a Doppler contraction of time given approximately by , yielding .
5.1 The internal/external shock scenario
If the central engine does not produce a single pulse, but works intermittently, it can produce many shells (i.e. many fireballs) with slightly different Lorentz factors. Late but faster shells can catch up early slower ones, producing shocks which give rise to the observed burst emission. In the meantime, all shells interact with the interstellar medium, and at some point the amount of swept up matter is large enough to decelerate the fireball and produce other radiation which can be identified with the afterglow emission observed at all frequencies.
This is currently the most accepted picture for the burst and afterglow emission, and it is called the internal/external shock scenario (Rees & Mészáros 1992; Rees & Mészáros 1994; Sari & Piran 1997). According to this scenario, the burst emission is due to collisions of pairs of relativistic shells (internal shocks), while the afterglow is generated by the collisionless shocks produced by shells interacting with the interstellar medium (external shocks). All the radiation we see is believed to come from the transformation of ordered kinetic energy of the fireball into random energy. For internal shocks, this must happen at some distance from the explosion site, to allow the shells to be transparent to the produced radiation ( cm). For external shocks, the deceleration radius, where the fireball starts to emit the afterglow, depends on the density of the interstellar medium (and by the possible presence of a stellar wind), by the energy of the fireball and its bulk Lorentz factor. For densities of the order of 1–10 proton/cm3, we get cm as a typical value for the start of the afterglow. Note that this would correspond to observe the initial afterglow seconds after the trigger.
5.2 Efficiency
In the internal shock scenario we have collisions of pairs of shells which are both relativistic, with bulk Lorentz factors and . After the collision, the merged shell is still relativistic, with a bulk Lorentz factor which is between and . The energy which is liberated in the process is therefore a small fraction of the initial one, unless the ratio is huge (Beloborodov 2000, Kobayashi & Sari 2001). But if the Lorentz factor of the shells is distributed in a large interval, then a very fast shell would move in the photon field created by the previous collisions, would scatter these ambient photons and would produce very high energy –rays by the inverse Compton process. This Compton drag effect can be relevant: it can in fact decelerate the fast shells and then it would narrow the range of the bulk Lorentz factors of the shells undergoing internal shocks, thus lowering their efficiency (Lazzati, Ghisellini & Celotti 1999).
5.3 Radiation mechanisms
It is reasonable to assume that internal and external shocks can amplify seed magnetic fields and accelerate electrons to relativistic random energies. These are the basic ingredients for the synchrotron process, which is therefore a strong candidate for the origin of the observed radiation of both the prompt and the afterglow emission. There is indeed strong evidence that this is the main process operating during the afterglow: the power law decay of the flux with time, the observed power law energy spectra and the recently detected linear optical polarization in GRB 990510 (Covino et al. 1999; Wijers et al. 1999) and GRB 990712 (Rol et al. 2000). The synchrotron nature of the prompt emission is instead controversial, and alternatives have been proposed, such as quasi–thermal Comptonization (Liang 1997, Ghisellini & Celotti 1999a), Compton drag (Lazzati et al. 2000), relativistic inverse Compton emission (Panaitescu & Meszaros 2000) and “jitter” radiation (i.e. electrons emitting by following magnetic field lines highly tangled on small scales; Medvedev 2000).
6 Spheres versus jets
A hot issue in the GRB field is the possible collimation of their emitting plasma, leading to anisotropic emission able to relax the power requirements, at the expense of an increased burst event rate. In this respect polarization studies could be crucial, since there can be a link between the deceleration of a collimated fireball, the time behavior of the polarized flux and its position angle, and the light curve of the total flux.
6.1 Arguments in favor of collimation
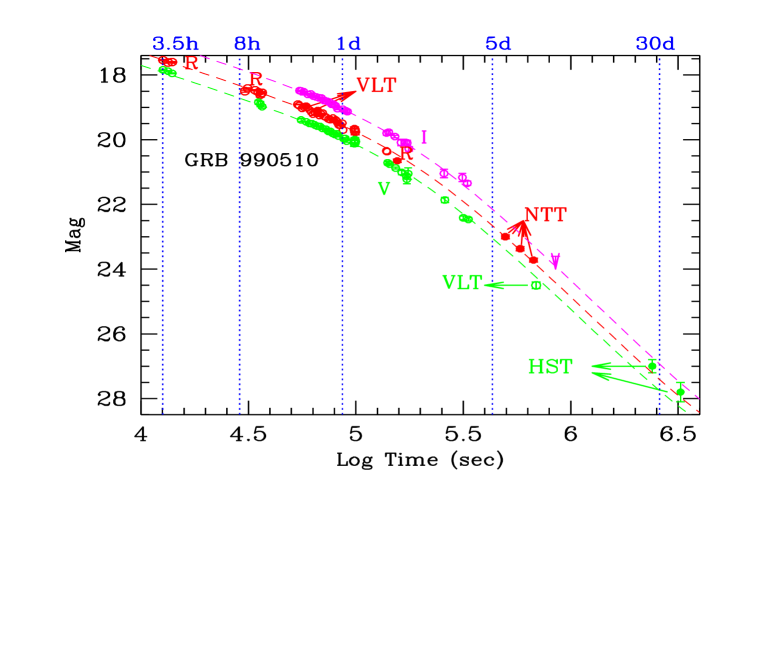
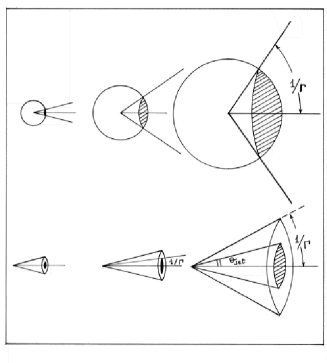
Breaks in the light curves — Assume that the burst is collimated within a cone of semiaperture . Assume also that, initially, the bulk Lorentz factor of the fireball is such that . In this case, because of relativistic aberration, the observer (which is within the cone defined by ) will receive light only from a section of the emitting surface, of aperture and radius , where is the distance from the apex of the cone. This is illustrated in Fig. 12. Initially, this area increases both because increases with time and because decreases. This leads to the estimate of how the received flux varies in time. If the fireball is spherical, this will continue as long as the motion is relativistic. But if the fireball is collimated, there is a time when becomes comparable to . After this time the observed area will increase only because increases while the decrease in will not “enlarge” the available surface (we ignore here the complications due to side expansion, which does not change qualitatively the argument). Since the rate of increase of the observed emitting area changes, then there will be a change in the slope of the light curve. An achromatic break is predicted. The best example observed so far of such a case is the afterglow of GRB 990510, shown in Fig. 13.
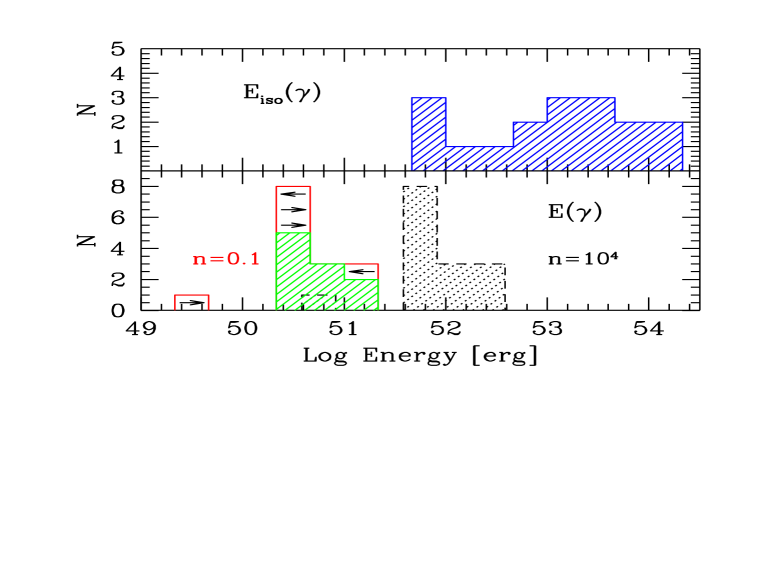
Clustering of fireball energies — Taking advantage of the relation between the time of the break in the light curve and the degree of collimation (strong collimation should produce an earlier break than mild collimation), Frail et al. (2001) calculated the “jet angle” for a small sample of bursts of known redshifts. This immediately yields the “true” energy dissipated during the prompt emission. The remarkable results of Frail et al. (2001) is that despite the “isotropic” energy values differ by some orders of magnitude, the corrected values are all very similar and cluster around a value of a few times erg, as shown in Fig. 14. These values are however obtained assuming a density of the decelerating interstellar medium of cm-3, a particularly small value, but in agreement with fits to the afterglow spectral energy distribution (from radio to X–rays, see, e.g. Panaitescu & Kumar 2001). Assuming a larger density makes the jet angle and the “true” energy to increase (even if they remain clustered: Fig. 14 shows how the distribution of energy shifts assuming cm-3).
Polarized afterglows — To produce polarized light some asymmetry is required. If the radiation is due to the synchrotron process, the magnetic field cannot be completely tangled, but must have some degree of order within the emitting available (i.e. within the angle) volume. Even in a spherical source there can be distinct regions of ordered magnetic fields producing a net polarized flux (Gruzinov & Waxman 1999), but a perhaps more natural asymmetry corresponds to a jet observed off axis (note that the probability of observing a jet exactly on axis is vanishingly small). Ghisellini & Lazzati (1999) and Sari (1999) have considered a jet geometry where the initially tangled magnetic field is “squeezed” (by compression) in one direction. It appears completely random for face–on observes (with respect to the direction of compression), but highly ordered to edge–on observers (a similar model was proposed by Laing 1980 for polarized, radio–loud Active Galactic Nuclei). Photons emitted in the plane of the slab can then be highly polarized. If the slab moves with Lorentz factor , those photons emitted in the slab plane (perpendicularly to the direction of motion) are aberrated in the observer frame, and make an angle with respect to the slab velocity. Observers looking at the moving slab at this angle will detect a large degree of optical polarization. In particular there will be 2 maxima in the light curve of the polarized light (which become 3 considering side expansion), with a switch of 90 degrees in the polarization angle between the two maxima.
Should these predictions be confirmed, we would have a very powerful tool to know the degree of collimation of the fireball, and hence the true total emitted power.
6.2 Arguments against strong collimation: Iron lines
The presence of (possibly broad) iron lines in the X–ray afterglow of some bursts imply that a dense, possibly iron–rich material must be present in the vicinity of the burst site. The large densities involved suggest that the line emission process is fast photoionization and recombination by an optically thick slab, reprocessing the impinging ionizing continuum in its layer (where is the relevant optical depth). The observed line flux would then be proportional to the projected emitting area, which becomes very small if the burst and afterglow fluxes are collimated in a cone as narrow as envisaged, e.g. by Frail et al. (2001).
Models proposed so far for the iron line origin can be broadly divided into two categories: “internal” (Meszaros & Rees 2001) and “external” (Lazzati, Campana & Ghisellini 1999; Vietri et al. 2001) models. The latter ones assume that a supernova explodes some time before the burst and forms a dense and iron rich remnant at – cm from the burst. This material is illuminated by the burst and afterglow X–ray flux, which can also transfer some linear momentum to the walls of the funnels excavated inside the remnant (see Fig. 15) which is therefore accelerated to velocities of km s-1. This can help explaining a paradox: in GRB 991216 the line is broad, implying velocities of 15,000 km s-1 (Piro et al. 2000). Since we can estimate (Eq. 1) the size of the emitting material, we can also estimate the time elapsed from the supernova explosion, and this turns out to be much too short for the decay of Cobalt and Nickel into iron (Vietri et al. 2001).
In the “internal” models the reprocessing material is identified with the funnel walls or the envelopes of the hypernova thought to be the progenitor of the burst. In such a scenario the super/hyper-nova explodes at the same time of the burst. In this case the appropriate density can be obviously much greater then in the “external” model, enhancing the recombination rate and therefore requiring less iron. On the other hand one needs a continuous illuminator lasting for at least one day after the burst explosion, generating erg s-1 to sufficiently photoionize the iron atoms. Three possibilities have been proposed: 1) instead of a black hole, the compact object resulting from the burst explosion is a magnetar, with a fastly decaying magnetic field; 2) accretion by fall–back material onto the black hole; 3) side–deposition at the top of the funnel of erg producing a continuous X–ray radiation illuminating filaments or clumpy material which generates the line.
We can see that in both class of models there must be a sizeable fraction of energy not well collimated (e.g. the relevant must be relatively large).
There is finally a very serious energy budget problem: if the “true” energy derived by Frail et al. (2001) is to be taken seriously, we have a few times erg available in –rays, and a factor less (i.e. erg) in ionizing X–ray photons. The observed lines have erg s-1. If they last for seconds we have : that is, a completely unreasonable conversion efficiency of 100 per cent.
7 The primary energy source
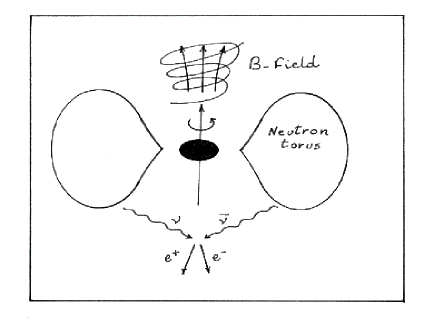
The greatest unknown in GRB science is what is the progenitor. In recent years the attention of the community polarized onto three proposals: 1) the merging of two compact objects, such as two neutron stars forming a black hole surrounded by some accreting neutron–dense torus (Paczynski 1986; Goodman 1986; Eichler et al. 1989; Meszaros & Rees 1997); 2) the core collapse of a very massive star (hypernova, Woosley 1993; Paczynski 1998; Fryer, Woosley & Hartmann 1999); 3) the formation of a black hole from a rapidly spinning but decelerating neutron star left over by a previous explosion of a “quasi–normal” supernova (supranova, Vietri & Stella 1998).
Irrespective of the differences among these three proposals, the central engine could be very similar, being composed by the same ingredients: a fast spinning black hole surrounded by a very dense (neutron–dense) torus. In this case the available sources of energies, apart from gravitational radiation, are in the form of neutrinos, accretion of the torus material onto the black hole, and rotation of both the torus and the hole.
The black hole is more massive than the disk: it should have at least 2 solar masses, and probably more in the collapsar scenario, versus 0.1–0.2 solar masses in the torus. Therefore, if the hole is fastly spinning, most of the energy is in its rotation. One promising way to extract this energy is the Blandford & Znajek (1977) process, in which the rotational energy of a Kerr black hole can be extracted by a magnetic field surrounding the hole providing a source of power:
| (2) |
where is the specific black hole angular momentum ( for maximally rotating black holes), is the Schwarzchild radius and . For a maximally rotating black hole of 10 solar masses the extractable rotational energy is erg: even if the bursts are not collimated in a narrow cone, there is (theoretically) plenty of energy stored in the black hole spin.
8 Open issues and problems
In the very recent past the GRB field witnessed extraordinary successes both in the theory and in the observations, and the fireball–internal/external shock scenario is becoming a paradigm. All this is obviously great, since a framework is always useful to systemize ideas, observations, and maybe to sharpen our criticisms. On the other hand a paradigm helps lazy people to do useful but “ordinary” work without exploring alternatives. Therefore it can be useful to point out some areas where the proposed solutions are still not completely convincing (even if this will be a biased list, based on my own prejudices).
Efficiency and energetics of internal shocks — Kumar (1999); Lazzati, Ghisellini & Celotti (1999); Spada, Panaitescu & Meszaros (2000) and Panaitescu & Kumar (2001) pointed out that internal shocks are not the most efficient way to transform the bulk kinetic energy of the fireball(s) into radiation. With a Lorentz factor contrast of a few between the colliding shells we have efficiencies of the order of 1 per cent. This implies that: 1) the total fireball energy is much more than what we estimate from the –ray radiation, and 2) that the afterglow, powered by the much more efficient external shocks, should radiate more energy than the burst. This is not not what we observe.
The peak energy of the prompt emission — The peaks (in ) of the prompt emission spectra () are remarkably narrowly distributed, clustering around a few hundreds keV. This despite the possible spread of the Lorentz factor values and also the different redshifts. The value of is tantalizingly close to , possibly suggesting the importance of Compton down–scattering and/or photon–photon processes for the prompt emission (Ghisellini & Celotti 1999b; Thompson & Madau 2000; Brainerd 1994).
Radiation mechanism of the prompt emission — In the internal shock scenario, the prompt emission is thought to be synchrotron emission by electrons with a low energy cutoff. This should yield spectra with a low energy tail (equivalent to ), in rough agreement with the distribution of the low energy spectral index (as shown in Fig. 6). But in the very same scenario, the magnetic field is large enough to make electrons radiatively cool on a timescale much shorter than a milliseconds (and of course much shorter than any integration time to get a spectrum). Furthermore, we know that the electrons must cool fast, since the light curves do vary on the millisecond timescales. The synchrotron spectrum of a cooling electron is (equivalent to ) and this slope is much too softer than observed (Ghisellini, Celotti & Lazzati 2000).
What causes the intermittent release of energy — The term “fireball” may lead to think of a great and single explosion. But what we need in GRBs is an intermittent source of energy (i.e. thousands of fireballs). Consider that the Schwarzchild radius light crossing timescale for a 10 solar mass black hole is s, while we see bursts lasting for more than 100 seconds. To make a comparison, think of a AGN black hole producing a very energetic phenomenon lasting for 300 years. Indeed, there is time for quasi–stationary processes. Even if the Blandford–Znajek process can indeed work for “all” this time (and for hundreds million years in radio–loud AGNs), it is not clear what can cause the on–off states as witnessed by the erratic light curves.
What fixes the relatively small amount of mass in the fireball — We are convinced that the bulk Lorentz factors are of the order of . This must correspond to a moving mass of the order of – solar masses (depending on the “true” fireball energy). For a fixed value of the fireball energy per unit solid angle, the above amount of mass cannot be much less, since otherwise the fireball becomes transparent when pairs annihilate, letting internal radiation escape freely with a blackbody spectrum and leaving no energy for the afterglow. It cannot be much more than that, since otherwise the bulk Lorentz factor becomes too small to account for the observed variability. Therefore we must explain what causes the “right” amount of barion contamination.
Density of the circumburst material — The three leading models mentioned in Section 7 envisage very different densities of the circumburst material. In fact in the collapsar model the GRB is associated with a newly formed star, which should live in a star forming region of densities of about cm-3, corresponding, for a 1 pc region, to Hydrogen column densities of cm-2. Besides that, the star itself should be surrounded by the circumburst material of its stellar wind. Studies of winds in massive stars give outflows of – yr-1, with a velocity of – km s-1. Supranovae should be located in dense star forming region as well, but during the delay between the supernova and the burst explosion, the newly born neutron star can “clean” the environment through the super–Eddington luminosity produced by the neutron star before the GRB event (Vietri & Stella 1998). Finally, NS–NS mergings should instead happen far away from their original birth place, and so be characterized by surrounding densities of the order of 0.1–1 cm-3.
Therefore it seems odd that there is some consensus regarding collapsars as the progenitor for long bursts, and at the same time almost all hints we currently have indicate a small value for the density, i.e. 0.1–10 cm-3. These include fits of the afterglow spectra (see e.g. Panaitescu & Kumar 2001) and X–ray absorption rarely exceeding cm-2 (Owens et al. 1998; Galama & Wijers 2001; Stratta et al., in prep.). This issue could greatly benefit from early low energy X–ray observations, revealing a time dependent column, since the absorbing material, being neutral at first, can become completely ionized after the passage of the burst photons if sufficiently close to the GRB site (Lazzati & Perna 2001).
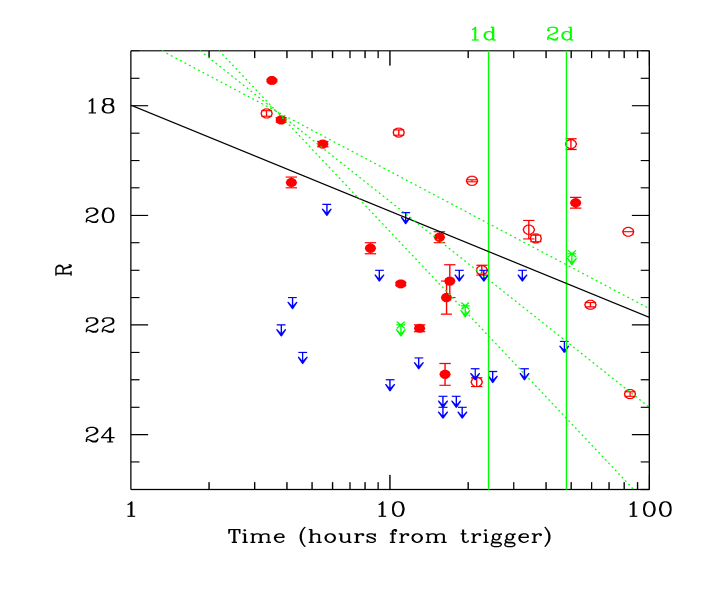
“Failed optical afterglows” — More than half of the bursts with detected X–ray afterglows were not detected in the optical. This is not due to adverse observing conditions (i.e. too short exposures or too late observations), as shown by Fig. 17 (see Lazzati, Covino & Ghisellini 2002). Are they optically reddened? If the dust responsible for absorption is too close to the GRB site (within a few parsec) it should sublimate (Fruchter, Krolik & Rhoads 2001), while if it is far away (as in a ultra–luminous IR galaxy, Ramirez–Ruiz, Trentham & Blain 2001) we should see some absorption in X–rays. The other alternatives are very high redshift bursts (, so that the Ly– clouds absorb all of the optical flux), or an intrinsic optical weakness, despite of a normal behavior in X–rays.
9 The future
It is my impression that the field of GRB is now living the same excitement felt soon after the discovery that quasars were at cosmological distances. If true, then the GRB field should be in its infancy, even though the next four or five years could bring it to adultness. This is because we expect a huge impetus from new planned mission and projects, and because the field has already attracted hundreds of researches.
9.1 Issues
Short bursts — Are short bursts really a separate class of bursts, with a different progenitor? We need accurate localization of short bursts and of course to find their redshifts. BeppoSAX only triggered on long bursts, so our hope relies on HETE II and/or the next missions.
Cosmology — If bursts are really associated with massive stars, then they should trace the high mass end of the initial mass function at all redshifts. There is the exciting possibility for a small but important fraction of bursts to be associated to the so called Pop III stars, thought to be responsible of the first metal enrichment of the primordial gas and possibly for its re–ionization (see e.g. the review by Loeb & Barkana 2001).
9.2 Projects
Swift — The most powerful tool we will have to study GRB is the dedicated satellite called Swift (http://swift.gsfc.nasa.gov/). It will host three instruments: a hard X–ray [10–150 keV] coded mask with a wide field of view and localization accuracy of a few arcminutes, a low and medium X–ray telescope [0.1–10 keV] with arcsecond localization performances, and an optical monitor (30 cm of diameter) with optical and UV filters and low dispersion grisms. Swift is planned to observe 250–300 burst per year, to distribute their coordinates immediately, to slew to target in a few tens of seconds, and start to observe with the X–ray mirrors and the optical monitor while the prompt emission can still be on. The launch is foreseen in 2003. All data will be public.
REM: an infrared robotic telescopes —
On ground, even before Swift, several groups are planning to
organize the necessary follow–up observations of GRBs,
to find their redshift and also to observe at other wavelengths,
not covered by the optical monitor onboard Swift.
This will in fact be blind in the infrared, where dust
and/or Ly– clouds absorption have small or no effect.
It is therefore crucial to have a completely robotic,
fast slewing infrared telescope, such as
REM (Rapid Eye Mount, see the web page at:
http://golem.merate.mi.astro.it/projects/rem/).
This will also be equipped with a dichroic beam splitter, and it will
be able to perform simultaneous IR and optical spectrophotometric
observations.
If the afterglow of a burst is seen in the IR but not in the optical,
we will have a very good high redshift candidate object,
and we will have the opportunity to alert much larger telescopes
(REM has a 60 cm diameter mirror) to perform high resolution
infrared spectroscopy at potentially any redshift.
There is no other way to acheive this result.
Acknowledgments
I thank Annalisa Celotti and Davide Lazzati for years of fruitful collaboration and them again, together with Sergio Campana, Stefano Covino, and Daniele Malesani for their help in improving this manuscript.
References
References
- [1] Akerlof C. & McKay T.A., 1999, IAUC 7100
- [2] Akerlof C. et al., 2000, ApJ, 532, L25
- [3] Amelino–Camelia G. et al., 1998, Nature, 393, 763
- [4] Antonelli A. et al., 2000, ApJ, 545, L39
- [5] Amati L., et al., 2000, Science, 290, 953
- [6] Band R. et al., 1993, ApJ, 413, 281
- [7] Beloborodov A.M., 2000, ApJ, 539, L25
- [8] Blandford R.D. & Znajek R.L., 1977, MNRAS, 176, 465
- [9] Bloom, J.S. et al., 1999, Nature, 401, 453
- [10] Brainerd J.J., 1994, ApJ, 428, 21
- [11] Burenin R.A. et al., 1999, A&A, 344, L53
- [12] Cavallo G. & Rees M.J., 1978, MNRAS, 183, 359
- [13] Costa E. et al., 1997, Nature 387, 783
- [14] Covino S. et al., 1999, A&A, 348, L1
- [15] Djorgovski S.G. et al., 2001, in Gamma–Ray Bursts in the Afterglow Era: 2nd Workshop”, eds. N. Masetti et al., ESO Astroph. Symposia, Berlin: Springer Verlag, in press (astro–ph/0107535)
- [16] Eichler D., Livio M., Piran T. & Schramm D., 1989, Nature, 340, 126
- [17] Fenimore E.E., Madras C.D. & Nayakshin S., 1996, ApJ, 473, 998
- [18] Fenimore E.E., Ramirez–Ruiz E. & Wu B., 1999, ApJ, 518, L73
- [19] Fishman G.J. & Meegan C.A., 1995, ARA&A, 33, 415
- [20] Frail D.A., Kulkarni S.R., Nicastro L., Feroci M. & Taylor G.B., 1997, Nature, 389, 261
- [21] Frail D.A. et al., 2001, ApJ, 562, L55
- [22] Frontera F. et al., 2000, ApJS, 127, 59
- [23] Fruchter A.S., Krolik J.H. & Rhoads J.E., 2001, ApJ, in press (astrop–ph/0106343)
- [24] Fryer C., Woosley S. & Hartmann D., 1999, ApJ, 526, 152
- [25] Galama T.J. & Wijers, R.A.M.J., 2001, ApJ, 549, L209
- [26] Galama T.J. et al., 2000, ApJ, 536, 185
- [27] Ghisellini G. & Lazzati D., 1999, MNRAS, 309, L7
- [28] Ghisellini G., Celotti A. & Lazzati D., 2000, MNRAS, 313, L1
- [29] Ghisellini G. & Celotti A., 1999a. ApJ, 511, L93
- [30] Ghisellini G. & Celotti A., 1999b, in GRBs: the first three minutes ASP Conf. Series, eds. J. Poutanen & R. Svensson, p. 189 (astro–ph/9906145)
- [31] Giblin T. et al., 1999, ApJ, 524, L41
- [32] Goodman J., 1986, ApJ, 308, L47
- [33] Gruzinov A., & Waxman E., 1999, ApJ, 511, 852
- [34] Hogg D.W. & Fruchter A.S., 1999, ApJ, 520, 54
- [35] Israel G.L. et al., 1999, A&A, 348, L5
- [36] Klebesabel R.W., Strong I.B. & Olson R.A., 1973, ApJ, 182, L85
- [37] Klose S., 2000, in Review in Modern Astronomy 13, New Astrophysical Horizons, edited by R.E. Schielicke. (Hamburg), Astronomische Gesellschaft, p.129 (astro–ph/0001008)
- [38] Kobayashi S. & Sari R., 2001, ApJ, 551, 934
- [39] Kulkarni S. et al., 1998, Nature, 395, 663
- [40] Kumar P., 1999, ApJ, 538, L125
- [41] Laing R.A., 1980, MNRAS, 193, 439
- [42] Lazzati D., Ramirez–Ruiz E. & Ghisellini G., 2001, 379, L39
- [43] Lazzati D. & Perna R., 2001, MNRAS, in press (astro–ph/0110486)
- [44] Lazzati D. et al., 2001, A&A, 378, 996
- [45] Lazzati D., Covino S. & Ghisellini G., 2002, MNRAS, in press (astro–ph/0011443)
- [46] Lazzati D., Ghisellini G., Celotti A. & Rees M.J., 2000, ApJ, 529, L17
- [47] Lazzati D., Ghisellini G. & Celotti A., 1999, MNRAS, 309, L13
- [48] Lazzati D., Campana S. & Ghisellini G., 1999. MNRAS, 304, L31
- [49] Liang E.P., 1997, ApJ, 491, L15
- [50] Lloyd N.M. & Petrosian V., 1999, ApJ, 511, 550
- [51] Lloyd N.M. & Petrosian V., 2000, ApJ, 543, 722
- [52] Loeb A. & Barkana R., 2001, ARA&A, 39, 19
- [53] Medvedev A., 2000, ApJ, 540, 704
- [54] Mészáros P., 2001, ARA&A, in press (astro-ph/0111170)
- [55] Mészáros P., 1999, 19th Texas Symposium on Relativistic Astrophysics and Cosmology (astro–ph/9904038)
- [56] Mészáros P. & Rees M.J., 1993,
- [57] Mészáros P. & Rees M.J., 1997, ApJ, 482, L29
- [58] Mészáros P. & Rees M.J., 2001,
- [59] Owens A. et al., 1998, A&A, 339, L37O
- [60] Paczynski B., 1986, ApJ, 308, L43
- [61] Paczynski B., 1998, ApJ, 494, L45
- [62] Panaitescu A. & Mészáros P., 2000, ApJ, 544, L17
- [63] Panaitescu A. & Kumar, P., 2001, ApJ, 560, L49
- [64] Pian E., 2001, in “Supernovae and Gamma–Ray Bursters”, K.W. Weiler editor, Springer–Verlag Press, in press, (astro–ph/0110051)
- [65] Piran P., 1999, Phys. Rep., 314, 575 (astro–ph/9810256)
- [66] Piro L., et al., 1999, ApJ, 514, L73.
- [67] Piro L., et al., 2000, Science, 290, 955
- [68] Preece R.D. et al., 1998, ApJ, 496, 849
- [69] Ramirez–Ruiz E., Trentham N. & Blain A.W., 2001, MNRAS in press (astro–ph/0103239)
- [70] Rees M.J. & Mészáros P., 1992, MNRAS, 258, P41
- [71] Rees M.J. & Mészáros P., 1994, ApJ, 430, L93
- [72] Reichart D., 1999, ApJ, 521, L111
- [73] Rol E. et al., 2000, ApJ, 544, 707
- [74] Sari R. & Piran, T., 1997, MNRAS, 287, 110
- [75] Sari R., 1999, ApJ, 524, L43
- [76] Schaefer B.E. & Walker K.C., 1999, ApJ, 511, L89
- [77] Schmidt M., 2001, ApJ, 559, L79
- [78] Spada M., Panaitescu A. & Mészáros P., 2000, ApJ, 537, 824
- [79] Tavani M., 1998, ApJ, 497, L21
- [80] Thompson C. & Madau, P., 2000, ApJ, 538, 105
- [81] van Paradijs J. et al., 1997, Nature, 386, 686
- [82] van Paradijs J., Kouveliotou C. & , and Wijers R.A.M.J. , 2000, ARA&A, 38, 379
- [83] Vietri M., Ghisellini G., Lazzati D., Fiore F. & Stella L., 2001, ApJ, 550, L43
- [84] Vietri M. & Stella L., 1998, ApJ, 507, L45
- [85] Yoshida, A., et al., 1999, Astr. Ap. Suppl., 138, 433.
- [86] Woosley S., 1993, ApJ, 405, 273
- [87] Wijers R.A.M.J. et al., 1999, ApJ, 523, L33