Implications of the synchrotron emission in plerionic nebulae: a second component in the Crab Nebula
Abstract
High-quality spatially resolved spectra of synchrotron emission from plerions represent a powerful diagnostic tool for the physical conditions in these objects. A fundamental question is to what extent spatial variations of the synchrotron spectrum originate from the evolution of a single population of injected electrons, and when instead they imply the coexistence of different populations of electrons. Here I shall discuss observations of the Crab Nebula at millimetric wavelengths which, compared with a radio map, show evidence for the emergence of a second synchrotron component, characterized by a flatter spectrum and undetected in the radio range. This component is confined to the inner part of the nebula, and cannot originate from synchrotron-dominated evolution, also because in the Crab Nebula the electrons emitting at millimeter wavelengths evolve almost adiabatically. Then its discovery indicates that there are more populations of injected particles. Finally, the detection of a low-frequency break in the spectra of synchrotron filaments can be interpreted as an effect of higher magnetic fields in filaments.
Osservatorio Astrofisico di Arcetri, Largo E. Fermi 5, Firenze (Italy)
1. Introduction
Synchrotron emission from Crab-like nebulae (plerions) provides information on magnetic fields and relativistic electrons contained in these nebulae. One of the goals of the analysis of this emission is to determine the characteristics of the particles injected in the nebula, and eventually those of the injection processes. However in order to obtain the injected spectrum it is necessary to correct for the evolution of particles, which are subject both to adiabatic and synchrotron losses: the former ones dominate at lower particle energies and preserve the shape of the distribution, while the latter ones dominate for more energetic particles, causing a steepening in their distribution.
In the integrated synchrotron spectrum at least two regions with different spectral indices are expected, separated by a break at frequency , where the adiabatic and synchrotron losses are equal (for a more detailed treatment see Pacini & Salvati 1973). At frequencies higher than spectral inhomogeneities in the spectral index are generally explained in terms of synchrotron evolution; while below the power-law index of the present particle distribution must correspond to that at injection. In the case of the Crab Nebula, where , Bietenholz et al. (1997) show that the radio spectral index is highly homogeneous, with an upper limit of only : this result has been interpreted as a compelling evidence in favour of a single component of injected particles.
Here I shall report on observations at mm wavelengths (a work in collaboration with R. Cesaroni and R. Neri), which instead indicate the coexistence of two components. Details on the observations as well as an extensive discussion of the results are presented by Bandiera et al. (2001).
2. 230 GHz observations of the Crab Nebula
The Crab Nebula has been mapped at 230 GHz using the MPIfR bolometer array MAMBO, at the 30-m IRAM telescope (Pico Veleta, Spain), with a angular resolution and a 10% photometric accuracy. The 230 GHz map has been compared with a 1.4 GHz VLA map (kindly provided by M.F. Bietenholz), suitably downgraded to the same resolution. The patterns in the two maps are similar, but not identical. This is apparent from the spectral map between the two frequencies (Bandiera et al. 2001): this map shows that in the inner region the spectral index is flatter (by ) than in the rest of the nebula, and is also flatter than the radio spectral index (a similar effect is seen also at 850 m; Green, at this meeting). This means that, in the range from radio to mm wavelengths, the spectrum of the inner nebula is concave, a behavior hard to explain in terms of synchrotron losses, which on the contrary generate steeper spectra at higher frequencies. Moreover, since is much higher than 230 GHz, synchrotron losses are not expected to affect the electron distribution in this energy range. A concave spectrum, instead, naturally appears in the case of the coexistence of two different power-law components.
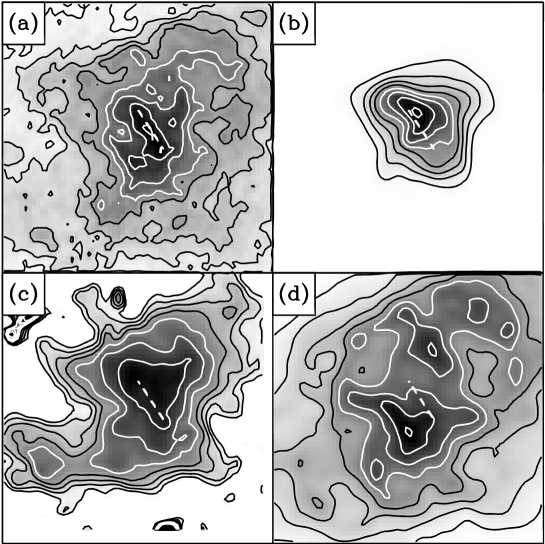
With this in mind we have mapped the residuals after having subtracted an extrapolation of the radio map (after PSF equalization). The map of residuals shows an excess in the inner region, plus a pattern of secondary negative features, whose positions coincide with those of radio filaments. By a non-linear filtering we have synthesized a map of the filaments and we have combined it with the map of residuals in a way to minimize the ripples. We came out with a map of what we guess is the second component (Fig. 1a). In size, shape and position this component resembles the X-ray map (Fig. 1b) and the optical flatter spectrum region (Fig. 1c; Véron-Cetty & Woltjer 1993): this is an unexpected result, because the latter two maps were believed to be shaped by synchrotron losses, while the mm component is not. Finally, this second component is anticorrelated with the radio map (Fig. 1d).

3. Discussion
Let me first discuss the negative features coincident with radio filaments. They indicate that, in between radio and mm wavelengths, the spectrum of the filaments is steeper than the integrated spectrum. If this is ascribed to the presence of a synchrotron break, this break must be located at about 70 GHz, namely at a frequency times lower than the for the integrated spectrum. If electrons cannot diffuse through filaments we have : thus in filaments the field should be times higher than the average.
The fact that even these secondary features are real makes us confident that the primary feature in the residual map, namely the excess in the inner nebula, is not just an instrumental artifact. Even though the 230 GHz map has been compared with a radio map obtained about 10 years earlier, and even though there is evidence of rapid variability in radio (Bietenholz et al. 2001; and at this meeting), there are various reasons why the observed excess cannot be an artifact of time variability. First of all, Bietenholz et al. show a wavy structure of the variability pattern that, when smeared to resolution, should average down to zero. Moreover the extension we find is larger than that of the time-variable region in radio. Finally if there have been “bursts of injected particles”, their effect should be detectable for a long time; on the contrary, the evolution of the Crab integrated flux is found to be smooth (Aller & Reynolds 1985).
An analysis of the integrated spectrum of the Crab Nebula allowed us to exclude a thermal origin (either dust or free-free) for this component. Even in the case of a synchrotron nature stringent limits on the electron distribution follow from the data at other wavelengths. The absence of this component at radio wavelengths implies a low-energy cutoff at a ; moreover, its emergence at optical frequencies and beyond constrains the slope of the distribution above to be about –2 (about –0.5 in the spectrum; Fig. 2).
In this way a total number of electrons is estimated for this component (for an assumed nebular field ). This value for is in nice agreement with what predicted by Kennel & Coroniti (1984) model, which otherwise fails to account for the number radio emitting electrons. This may indicate that the Kennel & Coroniti mechanism is producing the newly discovered component, while the radio component requires a different mechanism.
Acknowledgments.
This work has been supported by the Italian Ministry for University and Research under Grant Cofin99–02–02, and by the National Science Foundation under Grant No. PHY99-07949.
References
Aller, H. D., & Reynolds, S. P. 1985, ApJ, 293, L73
Bandiera, R., Neri, R., & Cesaroni, R. 2001, A&A (submitted)
Bietenholz, M. F., Frail, D. A., & Hester, J. J. 2001, ApJ, 560, 254
Kennel, C. F., & Coroniti, F. V., 1984, ApJ, 283, 710
Pacini, F., & Salvati, M., 1973, ApJ, 186, 249
Véron-Cetty, M. P., & Woltjer, L., 1993, A&A, 270, 370