The Aquarius Superclusters
I. Identification of Clusters and
Superclusters11affiliation: Partly based on observations at
European Southern Observatory (ESO), under the ESO-ON agreement to operate
the 1.52m telescope; Observatório do Pico dos Dias, operated by the
Laboratório Nacional de Astrofísica (LNA); and Complejo Astronomico El
Leoncito (CASLEO), operated under agreement between the Consejo Nacional de
Investigaciones Científicas de la República Argentina and the National
Universities of La Plata, Córdoba and San Juan.
Abstract
We study the distribution of galaxies and galaxy clusters in a field in the Aquarius region. In addition to 63 clusters in the literature, we have found 39 new candidate clusters using a matched-filter technique and a counts-in-cells analysis. From redshift measurements of galaxies in the direction of these cluster candidates, we present new mean redshifts for 31 previously unobserved clusters, while improved mean redshifts are presented for 35 other systems. About 45% of the projected density enhancements are due to the superposition of clusters and/or groups of galaxies along the line of sight, but we could confirm for 72% of the cases that the candidates are real physical associations similar to the ones classified as rich galaxy clusters. On the other hand, the contamination due to galaxies not belonging to any concentration or located only in small groups along the line of sight is 10%. Using a percolation radius of 10 Mpc (spatial density contrast of about 10), we detect two superclusters of galaxies in Aquarius, at 0.086 and at 0.112, respectively with 5 and 14 clusters. The latter supercluster may represent a space overdensity of about 160 times the average cluster density as measured from the Abell et al. (1989) cluster catalog, and is possibly connected to a 40 Mpc filament from 0.11 to 0.14.
1 Introduction
Superclusters of galaxies are the largest known systems of galaxies, and are representative of the largest expected fluctuations in primordial spectrum. Furthermore, since perturbations on supercluster scales are likely still in a linear growth regime, they have not reached a state of equilibrium and are probably in the phase of condensing out of the Hubble flow, so they may have imprints of the processes that occurred during their formation (West, 1989). Thus, their study may ultimately give some clues about the nature of density fluctuations and also of the formation and evolution of galaxies and clusters. The orientation of galaxies relative to other galaxies as well as the system within which they are embedded also produce estimates of the amount of dark matter inside larger volumes. By characterizing the observed supercluster properties it is possible to place constraints that must be satisfied by any successful theory that explains the formation and evolution of galaxies and the large scale structures they are embedded in.
So far there have been two approaches used in the identification of superclusters. One searches for significant density enhancements in the spatial distribution of galaxies (e.g.; Tully, 1982; Basilakos, Plionis & Rowan-Robinson, 2001), which requires a relatively high redshift sampling rate, while the other uses clusters of galaxies (or even of quasars) to delineate these structures. In either case, because of the large scale sizes of superclusters, as well as the difficulty of defining supercluster membership, the characteristic properties of these systems are very uncertain, and thus somewhat inconclusive. For instance, it is not clear whether superclusters have already reached their maximum expansion phase and are now collapsing. Superclusters masses are also highly uncertain, estimates ranging from to ( km s-1 Mpc-1) (e.g.; Small et al., 1998; Barmby & Huchra, 1998; Bardelli et al., 2000). The derived estimates for mass-light ratios imply of about 0.2 to 0.4 of the critical value (Postman, Geller & Huchra, 1988; Quintana et al., 1995; Small et al., 1998; Barmby & Huchra, 1998).
In this paper we analyze the distribution of galaxy clusters in a region of located in the direction of Aquarius constellation. This region contains two large concentrations of such systems identified by Abell (1961), named SC-16 and SC-17, which are among the richest superclusters in that catalog. This concentration of galaxies has also been identified by more recent works using objective criteria applied to catalogs of clusters (e.g.; West, 1989; Einasto et al., 1996, 2001a, 2001b). In general, these works have used cluster catalogs for which the redshifts are either based on the 10th brightest galaxy ( relation) or on a very small number of spectroscopic measures per cluster.
The first targeted study of clusters in Aquarius region was carried out by Ciardullo, Ford & Harms (1985), who, by using spectroscopic redshifts of the brightest cluster galaxies, claimed that SC-16 was a superposition of 22 clusters with . A more extensive study of the distribution of galaxies in this region was carried out by Batuski et al. (1999, hereafter B99), who obtained redshifts for a sample of clusters in a strip of sky, including Aquarius and Eridanus supercluster candidate regions. In the region of Aquarius that we are considering in this work B99 measured about 200 redshifts around 11 clusters. Using the cluster redshifts available at that time, B99 find a filamentary supercluster made up of 14 Abell clusters (where is the richness class, as defined by Abell, 1958), with an estimated extension of about 110 Mpc, oriented almost along the line of sight. They also find a “knot” of 5 clusters at 0.11 that represents an overdensity about 150 times greater than the mean spatial density for clusters. Until now, effectively, only the richest Abell clusters were used to study this region. Our goal in this work is to study the distribution of galaxies in this region, by considering systems not only in rich clusters but also in lower density-contrast candidate systems, identified using objective criteria.
2 Photometric Data
In this paper we analyze the galaxy distribution in the region enclosed by the limits in right ascension of , and declination of , located in the Aquarius constellation, containing SC-16 and SC-17.
The catalog is derived from APM scans of -band films taken with the ESO Schmidt telescope, supplemented by data from the COSMOS/UKST Southern Sky Object Catalog (SSC, Yentis et al., 1992; Drinkwater, Barnes & Ellison, 1995), which was obtained on-line from the Anglo-Australian Observatory111 http://www.aao.gov.au/local/www/surveys/cosmos/ and the Naval Research Laboratory/Royal Observatory of Edinburgh222 http://xip.nrl.navy.mil/www_rsearch/RS_form.html. Catalogs characteristics are summarized in Table 1.
The magnitudes are defined from the combination of the 4415 Tech-Pan emulsion plus RG630 filter. Prior to the photometric calibration, the plates were placed on a uniform instrumental system following Maddox, Efstathiou & Sutherland (1990), and then corrected to a common zero point. The uncertainty in the zero point determination is 0.13 mag. The instrumental magnitudes were then calibrated with CCD data for a sequence of 18 galaxies, 5 measured at the 1.60m telescope of Observatório do Pico dos Dias (OPD, Brasópolis, Brazil) and 13 from Cunow & Wargau (1994). The five galaxies measured at OPD are listed on Table 2. The (2OG570+3KG3) filters reproduce the Cousins magnitude system (Bessell, 1990). The Cunow & Wargau (1994) galaxies are also in this system. The rms in the calibration relation is of about 0.1 mag, for the magnitude range , as can be seen in Figure 1. As an independent check on the photometric calibration, in Figure 2 we plot the number counts in the Aquarius region and those of Jones et al. (1991), Bertin & Dennefeld (1997), Kümmel & Wagner (2001) and Yasuda et al. (2001). The completeness of this catalog (i.e., unambiguous identification of objects as galaxies) is estimated to be of 90% around and 80% around 19.0. Most of the misclassified galaxies at these limits are objects classified by the APM algorithm as “merged”. The detection limit is around , while the estimated optimal range of magnitudes for this data is . The figure suggests that there might be a lack of galaxies at magnitudes brighter than . This is partly due to the misclassification of brighter galaxies as merged objects, as well as to a low space density of nearby galaxies. On the other hand, for magnitudes fainter than this limit the counts are higher than the expected, what may indicate the presence of large scale structures.
The magnitudes result from the combination of IIIa-J emulsion with the GG395 filter used in the UKST Survey. The calibration of galaxy magnitudes was done using existing CCD photometry in B and V (Yentis et al., 1992). By comparing such magnitudes with ESO Imaging Survey (EIS, Prandoni et al., 1999) data, Caretta, Maia & Willmer (2000) find that they have a rms error of 0.2 mag in the range . The completeness level varies from about 90% at 19.5-20.0, to 80% at 20.0-20.5. So, we consider in this work only SSC galaxies brighter than , limiting the loss of galaxies at about 15%. The distribution of the galaxy magnitudes is shown in Figure 3. Also plotted are the expected galaxy number counts as estimated for the Edinburgh-Durham Southern Galaxy Catalogue (EDSGC, Lumsden et al., 1997), covering the Southern Galactic Cap; for the EIS, covering the Southern Galactic Pole region; for the Northern Ecliptic Pole region (NEP, Kümmel & Wagner, 2001); and for the Sloan Digital Sky Survey (SDSS) commissioning data (Yasuda et al., 2001). The same conclusion taken from Fig. 2 can be drawn from Fig. 3, since the excess in the distribution for galaxies fainter than is also present.
We matched the galaxies with all objects in catalog using a search radius of , which is an optimal tolerance given the density of the catalogs, which simultaneously increased the match success and almost eliminated the possibility of double matches. Astrometric uncertainties in both catalogs are smaller than , while systematic deviations between them are not larger than in and in . About 90% of the SSC galaxies had counterparts in the catalog. From these, about 70% were also classified as galaxies in catalog and 25% as merged. The distribution of color indices, , for Aquarius galaxies333The complete photometric catalog of Aquarius is available on request to the authors is shown in Figure 4.
3 Selection of Spectroscopic Targets
Given the large number of potential candidates for spectroscopic observations, we narrowed down the sample of galaxies to objects that are likely members of groups and clusters. This was done by using catalogs of clusters presented in the literature, as well as by applying 2 different algorithms to the projected distribution of galaxies, in order to detect slightly lower density enhancements from which potential poor clusters and groups of galaxies might be identified. For each identified aggregate of galaxies (cluster/group) we have searched for surface density peaks inside the estimated Abell radius. From a field centered on each peak, we selected about the 15 brightest galaxies as spectroscopic targets.
3.1 Catalogs of clusters from the literature
The Aquarius region contains 48 clusters originally identified by Abell (1958), comprising systems from all richness () and distance classes. From Abell, Corwin & Olowin (1989, ACO) 7 additional rich southern clusters and 3 supplementary ones are found.
Two other catalogs, both machine-based, have clusters in the Aquarius region: the Edinburgh-Durham Cluster Catalog (EDCC, Lumsden et al., 1992) and the Automatic Plate Measuring machine Cluster Catalog (APMCC, Dalton et al., 1997). The former covers only about half of the Aquarius region (35 ), with 18 catalogued clusters, most of them (15) corresponding to Abell/ACO clusters. The APMCC, on the other hand, fully covers the Aquarius region, where 17 clusters are found, 15 of which are also in the Abell/ACO catalogs.
Although X-rays are one of the most efficient means of detecting rich clusters of galaxies, there are still few cluster candidates in the Aquarius region with confirmed X-ray emission. X-rays have been detected in 13 Abell/ACO clusters by the ROSAT All-Sky survey (Ebeling et al., 1996, 1998), the HEAO-1 (Ulmer et al., 1981; Wood et al., 1984) and the Einstein Observatory (HEAO-2) (Abramopoulos & Ku, 1983; Gioia et al., 1990; Elvis et al., 1992; Oppenheimer et al., 1997). In general, these X-ray detections may be considered as corroborative to the reality of such galaxy clusters.
3.2 Clusters from Matched-filter Algorithm
In order to identify new significant galaxy density enhancements, we applied the matched-filter technique described by Kawasaki et al. (1998), to the galaxy catalogs discussed in section 2. The matched-filter is a maximum likelihood-based method that objectively identifies two-dimensional density enhancements by considering projected positions and apparent magnitudes. Basically it uses a filter which suppresses galaxy fluctuations that are not due to galaxy clusters. As discussed by Postman et al. (1996), this method is optimized to detect weak signals in a noise-dominated background and has a good dynamic range, besides being able to suppress false detections. The price that is payed for this is that one must assume a parametric form both for the cluster luminosity function and its radial profile.
In the case of the galaxy distribution in Aquarius, the filter assumes a spherically symmetric King (1966) model with core () and tidal () radii such that (Kawasaki et al., 1998). The Schechter function parameters were fixed as follows: , , and , these values being typical of poor clusters of galaxies (Valoto et al., 1997). For the K-corrections, the fitting formulae for E/S0 galaxies defined by Shanks et al. (1984) were used. Other parameters that are considered by the matched-filter are the cluster redshift, , and its richness, . The is defined as the number of member galaxies with magnitudes brighter than () and within central 1.5 Mpc. In the present analyses, all parameters except , , and are basically fixed.
When computing the likelihood for the Aquarius region, the model of the spatial and luminosity distributions of the filter were compared to the actual galaxy distribution considering only those galaxies within a circular region with radius and in the magnitude range of and for the and data, respectively. In the first step of the procedure, we fix () at (0.2, 50 kpc) and tune only in order to maximize the likelihood at each given point and to simplify the calculation. The likelihood and corresponding were computed at all lattice points separated by 0.02 to make a “likelihood map” and a “richness map”. Because of simpler appearance of clusters in the richness map, we use the latter to detect clusters (see Fig. 2 of Kawasaki et al., 1998). Next, we smooth the raw richness map with a Gaussian filter with (Figures 5a and 5b). Cluster candidates are then detected as local peaks with () in the smoothed richness map. Then and were surveyed in the range of and for data and and for data, respectively, to estimate the redshift and richness for each candidate. An Abell-like richness, , was calculated from , using the relationship between them obtained from Monte-Carlo simulations. Uncertainties in these estimated quantities, also obtained from Monte-Carlo simulations, are of 0.03 in redshifts and 20% for both and .
A total of 57 cluster candidates were identified in the band galaxy catalog. Two of these were discarded, having resulted from obvious contamination caused by bright stars. Of the remaining 55 cluster candidates, 18 are new identifications, though 1 is outside the region considered in this work. The richness map of this sample is shown in Figure 5a. Selected peaks, those with , are marked in the figure with pluses. Since for the band galaxy catalog the optimal magnitude range covers , redshifts of clusters at should have the best estimation.
The band galaxy catalog shows 44 detections, of which 26 are in common with the band matched-filter catalog. Of these, only one has not been previously detected by the Abell, ACO, EDCC and APMCC catalogs. The number of new detections in the catalog is of 9 clusters. Figure 5b shows the richness map of this catalog, where again peaks above are marked with pluses.
Although the matched-filter does provide an estimate of the cluster redshift, given the somewhat low- of the objects in Aquarius, the measured uncertainty () is too large to provide a meaningful estimate of the cluster distance.
3.3 Clusters from Galaxy Surface Overdensities (Counts-in-Cells)
As the catalogs and methods presented above were designed to search mainly for rich clusters of galaxies, we tried an additional technique to identify smaller potential aggregates of galaxies, such as poor clusters and groups. The idea is that these structures may trace lower density contrast structures such as filaments and walls, as observed in the Great Wall (Ramella, Pisani & Geller, 1997). The main limitation of this procedure is that only positional information is used, so that the rate of false detections due to foreground/background contamination is larger than with the matched-filter technique. In order to minimize the contamination from interlopers and spurious detections, we optimized the search so that the cells would cover with a step of , equivalent to a resolution of 0.2 Mpc at the distance in which we expect to find the most representative supercluster ( 0.11). In addition to the cell size, we considered three samples: and data and a sample that contain only galaxies redder than (), typically redder than Sab (Fukugita, Shimasaku & Ichikawa, 1995), taking advantage of the fact that the morphology-density relation is also statistically valid for groups of galaxies (Maia & da Costa, 1990) and that early-type galaxies are generally red. Such an approach would preferentially detect objects located in the centers of clusters and rich groups (e.g.; Gladders & Yee, 2000).
The efficiency of the counts-in-cells approach was estimated by running the algorithm on the Updated Zwicky Catalog (UZC, Falco et al., 1999), where the cells were optimized for a distance similar to that of the Great Wall. By comparing the results from the counts-in-cells analysis against the catalog of groups identified in the UZC by Merchán, Maia & Lambas (2000), we find that the overall detection rate is 80% for all UZC groups () and greater than 90% for groups located at the distance of the Great Wall ().
The result from this analysis for Aquarius is shown in Figure 6 where surface density isocontour maps for , and , are presented in panels (a), (b) and (c), respectively. From the three maps we selected 38 peaks presenting projected densities higher than 3 times the standard deviation of background density () in the three plots (hereafter sample SD-1). Besides these conspicuous overdensities, other 27 additional clumps, presenting a density contrast greater than 3 in two of the maps (hereafter sample SD-2), were also identified.
3.4 The Aquarius Cluster Catalog
By combining all the detections described above, we are now able to construct a catalog of galaxy aggregates, potential clusters and groups in the region we are studying. This is presented in Table 3 where we show in column (1) the identifier in our catalog (Aquarius Cluster Catalog - AqrCC) and, in columns (2) and (3), the J2000.0 coordinates from the first catalog that the cluster was identified. In column (4) we list the Abell identification and in column (5) the corrected number of galaxies, , from the ACO catalog. The EDCC numbers are listed in column (6), while column (7) contains the corrected number of galaxies according to Lumsden et al. (1992), . The APMCC identification is presented in column (8), followed in column (9) by the cluster richness, , and the estimated redshift, , in column (10). The matched-filter richness and estimated redshift are presented in columns (11) and (12), (13) and (14), for the and data, respectively. Column (15) notes clusters that have been identified as X-ray sources; and column (16) notes objects identified by the counts-in-cells analysis.
There are 102 cluster or group candidates identified in Table 3, of which 39 are new detections. A map showing the projected distribution of objects in Table 3 is presented in Figure 7, where it can be seen that most objects are contained in at least two catalogs of objects.
A comparison of the percentual overlap between different catalogs is shown in Table 4. The ACO and SD-2 catalogs detect, on average, about 75% and 85% of objects in the other catalogs, respectively. The SD-1, MF-B and MF-R catalogs, on the other hand, detect about 60-65%, while the EDCC and APMCC detect on average, respectively, 50% and 25% of systems in the other catalogues.
4 The Cluster Redshifts
Redshift observations now exist for 72 of the 102 aggregates in Table 3. Cluster redshifts, both from the literature and from our new measurements, are presented in columns (17) to (22). Column (17) lists the mean cluster redshift from NED, followed by the number of redshifts used to estimate that value in column (18), and reference (19); new cluster redshifts obtained in this work are shown in column (20), while column (21) presents the number of cluster galaxies with redshifts; and finally, column (22) indicates notes to individual clusters. The detailed parameters obtained for each observed cluster, like velocity dispersions, virial masses, richnesses, core radii, luminosities, etc., will be subject of a forthcoming paper.
From the 72 observed cluster/group candidates, 69 resulted in a positive identification in redshift space. Of these, 31 are new cluster redshift measurements, while of the 38 with previous redshifts from the literature, 35 had additional galaxies observed in the present survey. For 12 of these clusters, the inclusion of new observations gives a mean redshift that differs from the previous published values by more than 2000 km s-1. In the case of 9 of these clusters, the published redshift was based on a single galaxy, which is likely to be an interloper. In two of these cases, the observed overdensity is a superposition of two systems and, since we chose the richer of them as representing the cluster, the previous redshift is of a galaxy belonging to the poorer system.
About half of the observed aggregates show a single significant peak in the distribution of observed galaxy redshifts up to 0.2. By a significant peak we mean that there are no gaps larger than 1500 km s-1 amongst the member galaxy velocities. For 32 aggregates we find more than one significant peak in redshift space. This high fraction of superpositions is not unexpected in a direction that possibly intercepts more than one supercluster. There are 3 cases in which we failed to detect a redshift peak. Therefore, we identified 109 significant peaks in the redshift distributions of 69 candidates. These concentrations in redshift space, that we call generically “galaxy systems”, have richness classes that vary from rich clusters to small groups.
We estimate the actual fraction of overdensities in the projected distribution of galaxies that result from chance alignments, by adding the fraction of detection failures in redshift space and the fraction of superposition of only small groups of galaxies. For that, we separated the 72 observed candidates according to the fraction of observed galaxies that turned out to be system members and visual inspection of system images. For the 51% of the cases that a single system was found, the fraction of system members to observed galaxies () is 0.55 (mean 0.8), i.e., most of the observed galaxies were converted to system members. The mean value for the velocity dispersion of these systems is 789319, typical value for rich galaxy clusters (Fadda et al., 1996; Mazure et al., 1996). So, we considered such systems as rich galaxy clusters. The other 45% that turned out to be more than one galaxy system in redshift space, were separated in three categories. The first is composed by clusters with superimposed (or background) groups, for which the main clump has 0.4 and the other clumps have 0.3. The richness of the main system is slightly contaminated, but we also consider it as a rich cluster, since the mean velocity dispersion is also close to what is expected for such systems, 767411. These correspond to 21% of the aggregates with redshift, pushing the fraction of probable clusters to 72%. The other two categories are cases of significant superposition (24%). Although two or more galaxy systems may exist in these directions, the available information does not allow a great deal of confidence in classifying them as poor clusters or groups. Instead, we separated them in cases of two significant systems, when both have 0.3 (11% of cases), or superimposed smaller groups, when all have 0.3 (13%). Thus, we estimate the contamination in the AqrCC could range between 4%, from the cases in which we failed in detecting a system, to 17%, adding the cases of only superimposed smaller groups. This is a conservative range, since some of the systems classified as groups may turn to be undersampled rich clusters at 0.2, as their images suggest. This is the case of AqrCC_002 (A2509), AqrCC_018 (A2536), AqrCC_033 (A2550) and AqrCC_080 (A2604). For one of these, A2536, we have deeper photometry that confirms its higher cluster richness, while A2550 has confirmed X-ray emission. Thus, removing these deeper clusters from the maximum contamination, the fraction of chance alignments becomes 10%.
The same analysis can be done for each of the original catalogs, which is shown in Table 5. Previous estimates of contamination for Abell/ACO, EDCC and APMCC are, respectively, 10-15%, 8-13% and 3-5% (e.g.; De Propris et al., 2001). We find for Abell 2-15% and for ACO 3-15%, in accordance to the above estimates. For EDCC and APMCC the small number of objects in Aquarius does not allow making an evaluation of the contamination.
Since we have new mean redshifts for most of the clusters in the Abell, EDCC and APMCC catalogs, we can also make a rough estimate of the depth of each of these cluster catalogs by using the mean redshift of the most distant quartile of clusters. For ACO we have spectroscopic redshifts for 98% (57) of the clusters and we confirm the expected depth of this catalog to be about 0.2; while for EDCC and APMCC we find 0.19 and 0.13, respectively, for the average of the 25% more distant clusters, both 100% complete on redshift in Aquarius.
5 Discussion
The observed overdensity of Abell clusters in the region may be taken as preliminary evidence that there might be superclusters of galaxies in this part of the sky. The projected density of Abell and ACO clusters in Aquarius (excluding the supplementary catalog objects) is 0.83 clusters/, which is an overdensity of about 4 when compared to a slice of 15 at the same galactic latitude. Similarly, for the EDCC the mean surface density of the overall catalog is 0.45 clusters/, while in Aquarius this increases to 0.54 clusters/. For the APM clusters the projected densities are 0.22 clusters/ and is 0.29 clusters/, respectively.
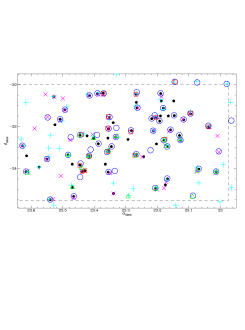
A redshift cone diagram showing the 109 systems with available redshifts, is presented in Figure 8, with different symbols for the four categories described on the previous section. Concentrations of clusters at 0.08 and 0.11 are easily seen. It is also noticeable that most of the identified groups follow the structures defined by the clusters (in fact, 55% of them seem to be part of concentrations at 0.08 and 0.11). Details of Figure 8 are presented in Figures 9, 10 and 11, which also show the cluster names.
To test whether the distribution of clusters seen in Figure 8 could be forming larger systems, we applied a percolation analysis to the data. The results of the percolation are presented in Table 6, in two blocks: the first (top) where only the 56 rich clusters are considered, and the second (bottom) where all systems are considered. The first column of Table 6 shows the search radius in Mpc, while column 2 shows the corresponding space overdensity. The mean spatial density is that estimated from the ACO catalog (e.g.; De Propris et al., 2001; Einasto et al., 1996; Zucca et al., 1993) – Mpc-3 – corrected for the number of ACO clusters in the sample over their total number in the region (58). Even though few rich clusters are lost in the identification process, it is likely that the number of less dense systems is underestimated. As can be seen in Table 6, with a small percolation radius (), corresponding to an overdensity of about , some supercluster core seeds emerge at about 0.08, 0.11 and 0.15. As the is increased, the supercluster cores grow fast, particularly when the small clusters and groups are considered. The concentration at 0.086 has two cores, that coalesce at = 10 Mpc with the groups (only at 15 Mpc without them), forming a supercluster of at least 5 clusters and 12 groups. The largest structure, on the other hand, has a main concentration at 0.11 and may extend up to 0.14. At 0.112 there are 3 cores that coalesce at 10 Mpc, with 14 clusters and at least 10 groups. From 0.11 to 0.14 there is a filament of about 40 Mpc, with at least 7 clusters and 8 groups, connecting with the concentration at 0.11 with 15 Mpc. Besides these two large superclusters, an additional 4 potential concentrations appear beyond 0.14, respectively at 0.147, 0.171, 0.201 and 0.212. These concentrations might be severely undersampled in our survey, as most of their brighter galaxies are are close to the photometric limits of our survey. Consequently we have, for example, a small number of redshifts per cluster (only 7 on average for 0.14 clusters against 14 for 0.14) and a very small number of groups detected (only 8 of 35 have 0.14).
Because the present work probes more densely the galaxy distribution in Aquarius, some of our results differ from those of B99. The main discrepancy is for 4 clusters that have a mean redshift which differ significantly from the values of B99. All of them are cases for which B99 observed galaxies in a larger area around the ACO cluster position and almost all the galaxies they used to calculate the mean redshifts are outside the estimated Abell radius, being generally galaxies belonging to the superclusters’ dispersed component superimposed to the observed cluster. In contrast, all the galaxies we observed are inside the Abell radius and have a greater chance of being a representative sample to measure the mean cluster redshift. In one specific case, AqrCC_058 (A3996), we do not find a cluster around ACO position, but only the superposition of the dispersed component of both the 0.08 and 0.11 superclusters. In the case of four clusters for which B99 used data from the literature (all of them based on a single galaxy redshift) we also have new mean redshift measurements. However, two are cases of superposition of two systems (poor clusters or groups) where we choose the richer to quote the redshift but the first observation was for a galaxy of the other system. In consequence of these redshift re-evaluations two clusters were removed from the B99 “knot”, AqrCC_058 and AqrCC_036 (A2553), though we now find 14 clusters for this 0.11 concentration (their 4 plus 10 new ones, including 6 ACO clusters, 2 APMCC ones, 1 EDCC and 1 new detection). Another thing that can be noted, both from Figure 8 and Table 6, is that the Aquarius supercluster of B99 was split in two distinct structures. For B99 the clusters from 0.08 to 0.12 formed a supercluster at a 8. Nevertheless, one of the clusters that made the link for this filament, A2541 (AqrCC_025), is one of the cases of re-evaluation which had only one observed galaxy previously, and has since shown to be more distant – it is, in fact, part of the core of 0.11 supercluster. Thus, even when considering a much smaller density contrast ( 3) or using groups, we could not connect both superclusters. Moreover, the 30 candidates of AqrCC that are yet unobserved have small estimated richnesses and also estimated redshifts that could not turn them to be potential links between the superclusters.
Considering the spatial distribution of the 5 clusters in the 0.086 supercluster, we are able to estimate a space overdensity of about 130 times the considered mean density, for an equivalent volume of 61910 Mpc3. Similarly, for the 14 clusters in the 0.112 supercluster, we find a spatial overdensity of 100 or, if we remove the cluster AqrCC_063 (A2583) from the supercluster, which is slightly far from the main concentration, we finally find a space overdensity of 160 for a volume of 122918 Mpc3. In terms of mass, if we consider the mean velocity dispersion we obtained for rich clusters, a mean mass for groups (e.g.; Maia, Willmer & da Costa, 1998), and a fraction of about one third for the dispersed component (e.g.; Small et al., 1998), we can estimate for the 0.086 and 0.112 superclusters the masses of at least and , respectively.
6 Summary
In this work we combine publicly available as well as new data to study the distribution of galaxies in a area in the Aquarius constellation.
(i) A compilation of galaxy clusters from the literature reveals the presence of 63 clusters in the region, corresponding to a projected density of 0.95 clusters. If only rich ACO clusters are considered, this represents an overdensity of more than 4 in the surface density of such systems.
(ii) We identify 26 new cluster candidates through the use of the matched-filter technique and 13 additional lower density enhancements by using isocontours maps.
(iii) We present new redshifts for 31 clusters in the Aquarius region, and provide more robust estimates for 23 systems confirming previous redshifts from the literature. We also report 12 new measurements, typically from 7 galaxies observed per cluster, that differ by more than 2000 km s-1 from previous measurements. The completeness of Aquarius Cluster Catalog in redshifts is 70%.
(iv) From the 72 observed cluster candidates, 51% revealed a single significant peak in redshift space, while 45% showed more than one and 4% did not show any. Moreover, 72% of them were found to be probable real clusters, while 24% may possibly be poor clusters or groups.
(v) Contamination in AqrCC with projected overdensities due to chance alignment (no concentration detected or only superimposed small groups in the redshift space) is estimated to be about 10%.
(vi) We find 2 rich superclusters in Aquarius region, at 0.086 and 0.112, respectively with 5 and 14 clusters at a spatial number density contrast of about 10 ( 10 Mpc). For both of them, a number of smaller galaxy systems (at least 10 for each), possibly poor clusters or groups, were also found to be part of the superclusters at the same percolation radius. The 0.11 supercluster may even be connected to a 40 Mpc filament of at least 7 clusters from 0.11 and 0.14. We also find possible cluster concentrations at 0.15, 0.17, 0.20 and 0.21, that need deeper photometry and spectroscopy to be confirmed.
(vii) With the cluster redshifts available in this region, we estimate that the characteristic depth of the most distant quartile of the Abell/ACO, EDCC and APMCC catalogs are respectively 0.20, 0.19 and 0.13. The redshift completenesses in Aquarius for these catalogs are 98% for Abell/ACO and 100% for the others.
(viii) Our analysis presents some differences relative to B99. The re-evaluation of some cluster redshifts, used by B99 to detect the supercluster, revealed 2 significant superclusters in this part of the sky, rather than only one structure that extends along the line of sight, as they suggested. Their conclusion was probably based on an incorrect redshift for the cluster A2541, which led them to connect both structures.
(ix) Our data support the interpretation of B99 that the 0.11 supercluster in Aquarius is very likely a significant concentration of matter, representing an overdensity of 160, and a mass of at least .
References
- Abell (1958) Abell, G.O. 1958, ApJS 3, 211
- Abell (1961) Abell, G. O. 1961, AJ 66, 607
- Abell, Corwin & Olowin (1989) Abell, G.O., Corwin Jr., H.G., Olowin, R.P. 1989, ApJS 70, 1
- Abramopoulos & Ku (1983) Abramopoulos, F., Ku, W.H.M. 1983, ApJ 271, 446
- Bardelli et al. (2000) Bardelli, S., Zucca, E., Zamorani, G., Moscardini, L., Scaramella, R. 2000, MNRAS 312, 540
- Barmby & Huchra (1998) Barmby, P., Huchra, J.P. 1998, AJ 115, 6
- Basilakos, Plionis & Rowan-Robinson (2001) Basilakos, S., Plionis, M., Rowan-Robinson, M. 2001, MNRAS 323, 47
- Batuski et al. (1995) Batuski, D.J., Maurogordato, S., Balkowski, C., Olowin, R.P. 1995, A&A 294, 677
- Batuski et al. (1999) Batuski, D.J., Miller, C.J., Slinglend, K.A., Balkowski, C., Maurogordato, S., Cayatte, V., Felenbock, P. 1999, ApJ 520, 491
- Bessell (1990) Bessell, M.S. 1990, PASP 102, 1181
- Bertin & Dennefeld (1997) Bertin, E., Dennefeld, M. 1997, A&A 317, 43
- Caretta, Maia & Willmer (2000) Caretta, C.A., Maia, M.A.G., Willmer, C.N.A. 2000, AJ 119, 524
- Ciardullo, Ford & Harms (1985) Ciardullo, R., Ford, H., Harms, R. 1985, ApJ 293, 69
- Colless & Hewett (1987) Colless, M., Hewett, P. 1987, MNRAS 224, 453
- Collins et al. (1995) Collins, C.A., Guzzo, L., Nichol, R.C., Lumsden, S.L. 1995, MNRAS 274, 1071
- Cunow & Wargau (1994) Cunow, B., Wargau, W. F. 1994, A&AS 107, 277
- Dalton et al. (1994) Dalton, G.B., Efstathiou, G., Maddox, S.J., Sutherland, W.J. 1994, MNRAS 269, 151
- Dalton et al. (1997) Dalton, G.B., Maddox, S.J., Sutherland, W.J., Efstathiou, G. 1997, MNRAS 289, 263
- De Propris et al. (2001) De Propris, R., et al. (2dFGRS team) 2001, astro-ph/0109167
- Drinkwater, Barnes & Ellison (1995) Drinkwater, M.J., Barnes, D. G., Ellison, S. L. 1995, PASAu 12, 248
- Ebeling et al. (1996) Ebeling, H., Voges, W., Böhringer, H., Edge, A.C., Huchra, J.P., Briel, U.G. 1996, MNRAS 281, 799
- Ebeling et al. (1998) Ebeling, H., Edge, A.C., Böhringer, H., Allen, S.W., Crawford, C.S., Fabian, A.C., Voges, W., & Huchra, J.P. 1998, MNRAS 301, 881
- Einasto et al. (1996) Einasto, M., Tago, E., Jaaniste, J. Einasto, J., Andernach, H. 1996, A&AS 123, 119
- Einasto et al. (2001a) Einasto, M., Einasto, J., Tago, E., Müller, V., Andernach, H. 2001, astro-ph/0012536
- Einasto et al. (2001b) Einasto, M., Einasto, J., Tago, E., Andernach, H.,Dalton, G.B., Müller, V. 2001, astro-ph/0012538
- Elvis et al. (1992) Elvis, M., Plummer, D., Schachter, J., Fabbiano, G. 1992, ApJS 80, 257
- Fadda et al. (1996) Fadda, D., Girardi, M., Giuricin, G., Mardirossian, F., Mezzetti, M. 1996, ApJ 473, 670
- Falco et al. (1999) Falco, E.E., Kurtz, M.J., Geller, M.J., Huchra, J.P., Peters, J., Berlind, P., Mink, D.J., Tokarz, S.P., Elwell, B. 1999, PASP 111, 438
- Fukugita, Shimasaku & Ichikawa (1995) Fukugita, M., Shimasaku, K., Ichikawa, T. 1995, PASP 107, 945
- Gioia et al. (1990) Gioia, I.M., Maccacaro, T., Schild, R.E., Wolter, A., Stocke, J.T., Morris, S.L., Henry, J.P. 1990, ApJS 72, 567
- Gladders & Yee (2000) Gladders, M., D., & Yee, H. K. C. 2000, AJ, 120, 2148
- Jones et al. (1991) Jones, L.R., Fong, R., Shanks, T., Ellis, R.S., Peterson, B.A. 1991, MNRAS 249, 481
- Kapahi et al. (1998) Kapahi, V.K., Athreya, R.M., Breugel, W.V., McCarthy, P.J., Subrahmanya, C.R. 1998, ApJS 118, 275
- Kawasaki et al. (1998) Kawasaki, W., Shimasaku, K., Doi, M., Okamura, S. 1998, A&AS 130, 567
- King (1966) King, I.R. 1966, AJ 71, 64
- Kowalski, Ulmer & Cruddace (1983) Kowalski, M.P., Ulmer, M.P., Cruddace, R.G. 1983, ApJ 268, 540
- Kümmel & Wagner (2001) Kümmel, M.W., Wagner, S.J. 2001, A&A 370, 384
- Lumsden et al. (1992) Lumsden, S.L., Nichol, R.C., Collins, C.A., Guzzo, L. 1992, MNRAS 258, 1
- Lumsden et al. (1997) Lumsden, S.L., Collins, C.A., Nichol, R.C., Ecke, V.R., Guzzo, L. 1997, MNRAS 290, 119
- Maddox, Efstathiou & Sutherland (1990) Maddox, S.J., Efstathiou, G., Sutherland, W.J. 1990, MNRAS 246, 433
- Maia & da Costa (1990) Maia, M.A.G., da Costa, L.N. 1990, ApJ 352, 457
- Maia, Willmer & da Costa (1998) Maia, M.A.G., Willmer, C.N.A., da Costa, L.N. 1998, AJ 115, 49
- Mazure et al. (1996) Mazure, A., Katgert, P., den Hartog, R., Biviano, A., Dubath, P., Escalera, E., Focardi, P., Gerbal, D., Giuricin, G., Jones, B., Le Fèvre, O., Moles, M., Perea, J., Rhee, G. 1996, A&A 310, 31
- Merchán, Maia & Lambas (2000) Merchán, M.E., Maia, M.A.G., Lambas, D.G. 2000, ApJ 545, 26
- Oppenheimer et al. (1997) Oppenheimer, B.R., Helfand, D.J., Gaidos, E.J. 1997, AJ 113, 2134
- Postman, Geller & Huchra (1988) Postman, M., Geller, M.J., Huchra, J.P. 1988, AJ 95, 267
- Postman et al. (1996) Postman, M., Lubin, L.M., Gunn, J.E., Oke, J.B., Hoessel, J.G., Schneider, D.P., Christensen, J.A. 1996, AJ 111, 615
- Prandoni et al. (1999) Prandoni, I., Wichmann, R., da Costa, L., Benoist, C., Méndez, R., Nonino, M., Olsen, L., Wicenec, A., Zaggia, S., Bertin, E., Deul, E., Erben, T., Guarnieri, M. D., Hook. I., Hook, R., Scodeggio, M., Slijkhuis, R. 1999. A&A 345, 448
- Ramella, Pisani & Geller (1997) Ramella, M., Pisani, A., Geller, M.J. 1997, AJ 113, 483
- Quintana & Ramírez (1995) Quintana, H., Ramírez, A. 1995, ApJS 96, 343
- Quintana et al. (1995) Quintana, H., Ramirez, A., Melnick, J., Raychaudhury, S., Slezak, E. 1995, AJ 110, 463
- Ratcliffe et al. (1998) Ratcliffe, A., Shanks, T., Parker, Q.A., Broadbent, A., Watson, F.G., Oates, A.P., Collins, C.A., Fong, R. 1998, MNRAS 300, 417
- Shanks et al. (1984) Shanks, T., Stevenson, P.R.F., Fong, T., MacGillivray, H.T. 1984, MNRAS 206, 767
- Small et al. (1998) Small, T.A., Ma, C-P, Sargent, W.L.W., Hamilton, D. 1998, ApJ 492, 45
- Steiner, Grindlay & Maccacaro (1982) Steiner, J.E., Grindlay, J.E., Maccacaro, T. 1982, ApJ 259, 482
- Stocke et al. (1991) Stocke, J.T., Morris, S.L., Gioia, I.M., Maccacaro, T., Schild, R., Wolter, A., Fleming, T.A., Henry, J.P. 1991, ApJS 76, 813
- Tully (1982) Tully, R.B. 1982, ApJ 257, 389
- Ulmer et al. (1981) Ulmer, M.P., Kowalski, M.P., Cruddace, R.G., Johnson, M., Meekins, J., Smathers, H., Yentis, D., Wood, K., McNutt, D., Chubb, T.A., Byram, E.T., Friedman, H. 1981, ApJ 243, 681
- Valentijn & Casertano (1988) Valentijn, E.A., Casertano, S. 1988, A&A 206, 27
- Valoto et al. (1997) Valotto, C.A., Nicotra, M.A., Muriel, H., Lambas, D.G. 1997, ApJ 479, 90
- West (1989) West, M.J. 1989, ApJ 347, 610
- Wood et al. (1984) Wood, K.S., Meekins, J.F., Yentis, D.J., Smathers, H.W., McNutt, D.P., Bleach, R.D., Byram, E.T., Chubb, T.A., Friedman, H. 1984, ApJS 56, 507
- Yasuda et al. (2001) Yasuda, N. et al. 2001, AJ 122, 1104
- Yentis et al. (1992) Yentis, D. J., Cruddace, R. G., Gursky, H., Stuart, B. V., Wallin, J. F., MacGillivray, H. T., Collins, C. A. 1992. In Digitised Optical Sky Surveys, eds. H. T. MacGillivray & E. B. Thomson (Kluwer: Dordrecht), p. 67
- Zucca et al. (1993) Zucca, E., Zamorani, G., Scaramella, R., Vettolani, G. 1993, ApJ 407, 470


Separate figures in files Aquar1_fig5a.gif and Aquar1_fig5b.gif
Separate figure in file Aquar1_fig6.eps


| Catalog | Source | Band | Digitization∗∗ Including object detection and classification. | Sampling Rate | Seeing |
|---|---|---|---|---|---|
| SSC | UKST/ESO plates | COSMOS | 1.08” | 3”†† Typical seeing for UKST survey plates (Heydon-Dumbleton, Collins & MacGillivray 1989). | |
| AqrR | ESO Schmidt films | APM | 0.54” | 1.5” |
| Object | Coordinates (J2000.0) | ||||||||
|---|---|---|---|---|---|---|---|---|---|
| Nr. | () | () | †† Considered total isophote: . | Obs.♯♯ Site of spectroscopic observation or reference: (1) Steiner et al. (1982); (2) CASLEO 2.15m telescope, Argentina; (3) Ciardullo et al. (1985); (4) ESO 1.52m telescope, Chile. | |||||
| 1 | 23 07 41.46 | -22 42 39.0 | 16.27 | 18.20 | 1.96 | 0.1998 | 1,2 | ||
| 2 | 23 07 37.93 | -22 43 05.2 | 16.81 | 18.12 | 1.18 | 0.1916 | 1,3 | ||
| 3 | 23 07 42.49 | -22 43 49.9 | 16.97 | 18.86 | 1.81 | 0.1698 | 3 | ||
| 4 | 23 07 37.78 | -22 42 15.3 | 17.92 | 19.64 | 1.69 | 0.1999 | 4 | ||
| 5 | 23 07 41.29 | -22 44 05.9 | 18.06 | 19.89 | 1.94 | 0.2009 | 4 | ||
| Aqr | Coordinates (J2000.0) | ACOaa Numbers in parenthesis are richness classes () | EDCCbb “o” means that the cluster is out of the region covered by EDCC. | APMCC | MF- | MF-R | X-raycc Source of X-ray observations for AqrCC clusters: (1) HEAO-1 satellite (1H); (2) Einstein Observatory (HEAO-2); (3) Einstein extended Medium Sensitivity survey (MS); (4) Einstein Slew survey (1ES); (5) Einstein eXtended Sensitivity Survey (EXSS); (6) ROSAT All-Sky Survey (RASS) – references are in the text. | dd “o” means that the cluster is out of the photometric data area; “b” that it was detected above in contour map; “r” that it was detected above in contour map; and “c” that it was detected above in contour map. | Literatureee Reference codes are: (1) Steiner, Grindlay & Maccacaro (1982); (2) Kowalski, Ulmer & Cruddace (1983); (3) Ciardullo, Ford & Harms (1985); (4) Colless & Hewett (1987); (5) Valentijn & Casertano (1988); (6) Stocke et al. (1991); (7) Dalton et al. (1994); (8) Batuski et al. (1995); (9) Collins et al. (1995); (10) Quintana & Ramírez (1995); (11) Dalton et al. (1997); (12) Kapahi et al. (1998); (13) Ratcliffe et al. (1998); (14) Batuski et al. (1999); (15) De Propris et al. (2001). | Newff Notes to individual candidates:
(1) A2514 – no concentration detected in redshift space; (2) A2518 – probable superimposed groups at 0.092 and 0.134; (3) A3964 – probable superimposed groups at 0.133 and 0.198; (4) A2539 – probable superimposed groups at 0.175 and 0.186; (5) Aqr_022 – group at 0.083 superimposed to a possible cluster at 0.128; (6) Aqr_024 – may constitute a double system with A2554, separated by about 2 Mpc; (7) A2541-A2546 – probably a double system of clusters, with about 2 Mpc separation; (8) Aqr_027 – group at 0.111 (or dispersed component of 0.11 supercluster) superimposed to possible cluster at 0.200; (9) Aqr_030 – superposition of small groups; (10) Aqr_040 – superposition of possible clusters at 0.091 and 0.170; (11) A2565 – superposition of two poor clusters or rich groups, respectively at 0.083 and 0.129; (12) Aqr_048 – superposition of small groups; (13) S1113-A3997 – probably a double system of clusters, separated by about 2 Mpc; (14) A3996 – superposition of small groups; (15) A2580-A2596 – possibly a double system with about 2 Mpc separation; (16) Aqr_062 – no concentration detected in redshift space; (17) S1117 – no concentration detected in redshift space; (18) Aqr_071 – probably a substructure of cluster ED291; (19) APM894 – probably a substructure of cluster APM895; (20) A2599 – probable poor cluster at 0.091 superimposed to cluster at 0.127; (21) A2605 – superposition of possible cluster at 0.089 to cluster at 0.112; (22) A2614 – superposition of small groups. |
|||||||||||||||||||||
|---|---|---|---|---|---|---|---|---|---|---|---|---|---|---|---|---|---|---|---|---|---|---|---|---|---|---|---|---|---|---|---|
| CC | () | () | Name | Nr. | Nr. | Ref. | Note | ||||||||||||||||||||||||
| (1) | (2) | (3) | (4) | (5) | (6) | (7) | (8) | (9) | (10) | (11) | (12) | (13) | (14) | (15) | (16) | (17) | (18) | (19) | (20) | (21) | (22) | ||||||||||
| 001 | 22 57 52.6 | -24 55 19 | 31 | 0.080 | o | ||||||||||||||||||||||||||
| 002 | 22 57 53.1 | -21 43 56 | A2509 | 70(1) | o | o | 0.2306 | 1 | 3 | 0.2305 | 3 | ||||||||||||||||||||
| 003 | 22 58 00.7 | -20 50 56 | o | 32 | 0.090 | o | |||||||||||||||||||||||||
| 004 | 22 58 46.4 | -19 58 55 | A3949 | 43(0) | o | 61 | 0.114 | o | 0.1580 | 6 | |||||||||||||||||||||
| 005 | 22 59 27.6 | -23 49 01 | 107 | 0.177 | b | 0.1177 | 11 | ||||||||||||||||||||||||
| 006 | 23 00 03.6 | -25 35 56 | 55 | 0.100 | o | ||||||||||||||||||||||||||
| 007 | 23 00 17.3 | -23 11 53 | A2514 | 64(1) | 64 | 0.216 | r | 0.0000 | 1 | ||||||||||||||||||||||
| 008 | 23 00 31.9 | -22 26 49 | 105 | 0.252 | r | ||||||||||||||||||||||||||
| 009 | 23 00 47.6 | -24 09 52 | A2518 | 78(1) | 231 | 21 | 57 | 0.083 | 80 | 0.207 | b, r, c | 0.1351 | 1 | 3 | 0.1342 | 7 | 2 | ||||||||||||||
| 010 | 23 02 12.7 | -22 01 12 | A2521 | 103(2) | o | 845 | 77 | 0.117 | 90 | 0.121 | 50 | 0.109 | 2,5 | b, r, c | 0.1340 | 2 | 5 | 0.1364 | 17 | ||||||||||||
| 011 | 23 04 04.3 | -24 41 20 | 58 | 0.133 | |||||||||||||||||||||||||||
| 012 | 23 04 05.2 | -24 01 49 | A2526 | 53(1) | 242 | 73 | 55 | 0.157 | 55 | 0.201 | r, c | 0.2043 | 6 | ||||||||||||||||||
| 013 | 23 04 21.8 | -19 54 48 | A3964 | 42(0) | o | 44 | 0.100 | o | 0.1325 | 4 | 3 | ||||||||||||||||||||
| 014 | 23 05 11.5 | -25 18 48 | A2527 | 68(1) | 244 | 34 | 0.1630 | 7 | |||||||||||||||||||||||
| 015 | 23 05 40.1 | -21 23 47 | A2528 | 39(0) | o | 852 | 66 | 0.099 | 66 | 0.077 | 49 | 0.134 | b, r, c | 0.0955 | 1 | 3 | 0.0949 | 12 | |||||||||||||
| 016 | 23 06 58.0 | -21 40 46 | A2531 | 73(1) | o | 53 | 0.116 | b, r, c | 0.1741 | 1 | 3 | 0.1731 | 7 | ||||||||||||||||||
| 017 | 23 07 34.3 | -22 39 45 | A2534 | 110(2) | 253 | 73 | 90 | 0.149 | 74 | 0.169 | 5 | b, r, c | 0.1976 | 3 | 1,3 | 0.2014 | 16 | ||||||||||||||
| 018 | 23 07 46.2 | -22 25 45 | A2536 | 102(2) | 5 | b, r, c | 0.1971 | 1 | 3 | 0.1973 | 4 | ||||||||||||||||||||
| 019 | 23 08 27.6 | -25 46 19 | 69 | 0.121 | o | ||||||||||||||||||||||||||
| 020 | 23 08 35.1 | -19 52 29 | A2538 | 72(1) | o | 859 | 88 | 0.086 | 93 | 0.079 | o | 0.0831 | 42 | 4 | 0.0829 | 44 | |||||||||||||||
| 021 | 23 08 45.8 | -21 28 44 | A2539 | 66(1) | o | b, r, c | 0.1735 | 1 | 3 | 0.1863 | 4 | 4 | |||||||||||||||||||
| 022 | 23 08 53.0 | -20 47 00 | b, c | 0.0825 | 6 | 5 | |||||||||||||||||||||||||
| 023 | 23 09 27.9 | -22 09 43 | A2540 | 70(1) | 61 | 0.195 | 1 | r, c | 0.1297 | 1 | 3 | 0.1290 | 8 | ||||||||||||||||||
| 024 | 23 09 54.0 | -21 30 00 | b, c | 0.1109 | 7 | 6 | |||||||||||||||||||||||||
| 025 | 23 10 04.1 | -22 57 43 | A2541 | 83(2) | 256 | 51 | 51 | 0.117 | 58 | 0.159 | b, r, c | 0.1100 | 2 | 9 | 0.1135 | 16 | 7 | ||||||||||||||
| 026 | 23 10 04.5 | -24 29 43 | A2542 | 57(1) | 71 | 0.167 | 59 | 0.166 | b, r, c | 0.1603 | 1 | 3 | 0.1684 | 4 | |||||||||||||||||
| 027 | 23 10 27.6 | -24 47 27 | 51 | 0.157 | b, c | 0.1998 | 5 | 8 | |||||||||||||||||||||||
| 028 | 23 10 45.9 | -22 39 42 | A2546 | 90(2) | 258 | 41 | 862 | 63 | 0.108 | 86 | 0.121 | b, r, c | 0.1119 | 1 | 3 | 0.1130 | 22 | 7 | |||||||||||||
| 029 | 23 10 51.4 | -21 07 42 | A2547 | 84(2) | o | 82 | 0.129 | b, r, c | 0.1501 | 2 | 3,12 | 0.1517 | 15 | ||||||||||||||||||
| 030 | 23 11 15.0 | -20 47 03 | o | 81 | 0.155 | b, r, c | 0.1076 | 9 | 9 | ||||||||||||||||||||||
| 031 | 23 11 21.2 | -20 25 41 | A2548 | 65(1) | o | 23 | 0.156 | b, r, c | 0.1101 | 1 | 3 | 0.1107 | 9 | ||||||||||||||||||
| 032 | 23 11 24.0 | -21 30 00 | b, r, c | ||||||||||||||||||||||||||||
| 033 | 23 11 33.5 | -21 44 41 | A2550 | 122(2) | o | 1 | b, r, c | 0.1543 | 1 | 2 | 0.1226 | 6 | |||||||||||||||||||
| 034 | 23 12 10.0 | -22 50 00 | b, c | ||||||||||||||||||||||||||||
| 035 | 23 12 15.1 | -21 33 56 | A2554 | 159(3) | o | 866 | 112 | 0.102 | 77 | 0.083 | 64 | 0.100 | 1 | b, r, c | 0.1111 | 28 | 4 | 0.1108 | 35 | ||||||||||||
| 036 | 23 12 22.4 | -24 56 40 | A2553 | 76(1) | 264 | 56 | 100 | 0.141 | 70 | 0.167 | b, r, c | 0.1496 | 2 | 10 | 0.1481 | 4 | |||||||||||||||
| 037 | 23 12 45.5 | -22 12 40 | A2555 | 72(1) | 53 | 0.091 | 42 | 0.101 | 1 | b, r, c | 0.1385 | 1 | 3 | 0.1106 | 11 | ||||||||||||||||
| 038 | 23 13 03.3 | -21 37 40 | A2556 | 67(1) | o | 1,4,5,6 | b, c | 0.0865 | 2 | 2,3 | 0.0871 | 9 | |||||||||||||||||||
| 039 | 23 13 15.7 | -23 08 40 | S1099 | 17(0) | b | 0.1104 | 12 | ||||||||||||||||||||||||
| 040 | 23 14 37.0 | -23 26 02 | 49 | 0.210 | b, r | 0.0910 | 6 | 10 | |||||||||||||||||||||||
| 041 | 23 15 50.9 | -21 06 37 | A2565 | 4 | o | 46 | 0.089 | 65 | 0.199 | b, r, c | 0.1271 | 1 | 3 | 0.0825 | 12 | 11 | |||||||||||||||
| 042 | 23 15 57.5 | -23 19 37 | A3985 | 36(0) | 270 | 21 | 874 | 53 | 0.080 | 52 | 0.068 | 60 | 0.157 | b, r, c | 0.1094 | 17 | |||||||||||||||
| 043 | 23 16 00.0 | -20 51 00 | b, c | ||||||||||||||||||||||||||||
| 044 | 23 16 03.2 | -20 27 41 | A2566 | 51(1) | o | 872 | 42 | 0.086 | 39 | 0.066 | 6 | b, c | 0.0821 | 1 | 3 | 0.0822 | 11 | ||||||||||||||
| 045 | 23 16 33.6 | -24 58 37 | 52 | 0.110 | b | ||||||||||||||||||||||||||
| 046 | 23 16 57.0 | -22 11 36 | A2568 | 35(0) | 876 | 45 | 0.112 | b, c | 0.1398 | 1 | 3 | 0.1397 | 6 | ||||||||||||||||||
| 047 | 23 17 32.3 | -25 20 45 | 275 | 8 | 37 | 0.080 | b | 0.1453 | 6 | ||||||||||||||||||||||
| 048 | 23 17 35.2 | -22 37 05 | b, r | 0.0827 | 5 | 12 | |||||||||||||||||||||||||
| 049 | 23 19 44.6 | -19 30 04 | o | 83 | 0.131 | o | |||||||||||||||||||||||||
| 050 | 23 19 50.7 | -22 04 34 | A2575 | 80(2) | r | ||||||||||||||||||||||||||
| 051 | 23 19 56.8 | -22 30 34 | A2576 | 92(2) | 284 | 31 | 68 | 0.102 | 63 | 0.142 | 2 | b, r, c | 0.1875 | 10 | 8 | 0.1876 | 10 | ||||||||||||||
| 052 | 23 20 03.1 | -24 07 34 | S1113 | 8(0) | b | 0.1468 | 9 | 13 | |||||||||||||||||||||||
| 053 | 23 20 21.1 | -25 11 56 | 148 | 0.309 | b, r | ||||||||||||||||||||||||||
| 054 | 23 20 21.1 | -24 42 00 | 18 | 0.041 | |||||||||||||||||||||||||||
| 055 | 23 20 44.8 | -22 57 33 | A2577 | 73(1) | 2 | b, r, c | 0.1251 | 1 | 10 | 0.1248 | 7 | ||||||||||||||||||||
| 056 | 23 20 24.0 | -21 49 00 | c | ||||||||||||||||||||||||||||
| 057 | 23 21 08.4 | -21 33 33 | A2579 | 66(1) | o | 887 | 62 | 0.116 | 34 | 0.087 | 45 | 0.127 | b, r, c | 0.1117 | 1 | 10 | 0.1114 | 9 | |||||||||||||
| 058 | 23 21 20.5 | -22 06 33 | A3996 | 59(1) | 889 | 41 | 0.109 | 49 | 0.162 | r, c | 0.1155 | 8 | 14 | 0.0854 | 6 | 14 | |||||||||||||||
| 059 | 23 21 21.0 | -24 10 33 | A3997 | 39(0) | 65 | 0.183 | b, r | 0.1478 | 8 | 13 | |||||||||||||||||||||
| 060 | 23 21 54.0 | -23 48 00 | b, r | ||||||||||||||||||||||||||||
| 061 | 23 21 23.2 | -23 11 16 | A2580 | 62(1) | 287 | 20 | 888 | 76 | 0.116 | 89 | 0.104 | 74 | 0.153 | 2,3,5,6 | b, r, c | 0.1870 | 1 | 6 | 0.0890 | 17 | 15 | ||||||||||
| 062 | 23 21 24.8 | -22 33 10 | b, r | 0.0000 | 16 | ||||||||||||||||||||||||||
| 063 | 23 22 19.2 | -20 24 52 | A2583 | 52(1) | o | 890 | 57 | 0.100 | 62 | 0.176 | b, r, c | 0.1160 | 1 | 11 | 0.1145 | 8 | |||||||||||||||
| 064 | 23 23 14.4 | -22 49 31 | S1117 | 19(0) | b, r, c | 0.0000 | 17 | ||||||||||||||||||||||||
| 065 | 23 23 25.9 | -20 25 31 | A2586 | 46(0) | o | 62 | 0.116 | 44 | 0.108 | b, r, c | 0.1448 | 11 | |||||||||||||||||||
| 066 | 23 23 32.3 | -22 24 31 | A2587 | 97(2) | c | 0.2157 | 6 | ||||||||||||||||||||||||
| 067 | 23 24 08.3 | -22 33 47 | 291 | 20 | 167 | 0.175 | 54 | 0.190 | b, r, c | 0.1224 | 15 | ||||||||||||||||||||
| 068 | 23 24 44.3 | -23 06 30 | A4003 | 49(0) | 0.0866 | 1 | 13 | 0.2159 | 2 | ||||||||||||||||||||||
| 069 | 23 24 55.7 | -20 31 30 | A2595 | 4 | o | 106 | 0.168 | 81 | 0.209 | r, c | 0.1803 | 5 | |||||||||||||||||||
| 070 | 23 24 59.0 | -23 25 03 | A2596 | 44(0) | 293 | 27 | 893 | 46 | 0.092 | 52 | 0.088 | b, r, c | 0.0892 | 24 | 15 | ||||||||||||||||
| 071 | 23 25 22.8 | -22 26 50 | b, r, c | 0.1226 | 5 | 18 | |||||||||||||||||||||||||
| 072 | 23 25 47.5 | -24 06 38 | 894 | 50 | 0.116 | b, c | 0.1116 | 6 | 19 | ||||||||||||||||||||||
| 073 | 23 26 19.5 | -24 08 53 | 895 | 50 | 0.111 | 59 | 0.082 | 50 | 0.142 | b, r, c | 0.0880 | 1 | 11 | 0.1116 | 21 | ||||||||||||||||
| 074 | 23 26 43.9 | -23 50 53 | A2599 | 51(1) | 297 | 60 | 898 | 59 | 0.098 | b, c | 0.0889 | 4 | 7,9 | 0.0906 | 14 | 20 | |||||||||||||||
| 075 | 23 26 43.9 | -22 24 29 | A2600 | 50(1) | 298 | 25 | 896 | 46 | 0.105 | 58 | 0.094 | b, r, c | 0.1205 | 12 | 14 | 0.1187 | 13 | ||||||||||||||
| 076 | 23 26 44.3 | -24 25 29 | A2601 | 62(1) | r | 0.1113 | 7 | 14 | 0.2126 | 5 | |||||||||||||||||||||
| 077 | 23 27 56.4 | -25 20 28 | A2603 | 64(0) | 81 | 0.231 | b, r, c | 0.2109 | 6 | ||||||||||||||||||||||
| 078 | 23 28 11.0 | -24 54 26 | 300 | 17 | 47 | 0.088 | b, c | 0.1125 | 12 | ||||||||||||||||||||||
| 079 | 23 28 12.0 | -23 48 00 | c | ||||||||||||||||||||||||||||
| 080 | 23 28 31.7 | -22 31 28 | A2604 | 31(0) | 19 | 0.128 | r | 0.2121 | 3 | ||||||||||||||||||||||
| 081 | 23 29 01.8 | -23 21 02 | A2605 | 54(1) | 303 | 12 | 33 | 0.071 | b, c | 0.1121 | 13 | 21 | |||||||||||||||||||
| 082 | 23 29 37.3 | -21 12 27 | A2606 | 78(1) | o | 126 | 0.188 | 118 | 0.250 | 6 | r, c | 0.2800 | 1 | 12 | 0.1431 | 4 | |||||||||||||||
| 083 | 23 30 00.0 | -20 39 40 | o | 43 | 0.117 | c | |||||||||||||||||||||||||
| 084 | 23 30 21.6 | -24 21 32 | 78 | 0.191 | r | ||||||||||||||||||||||||||
| 085 | 23 30 31.3 | -21 39 27 | A2608 | 59(1) | o | 62 | 0.114 | 43 | 0.130 | b, r, c | 0.0498 | 5 | 14 | 0.1557 | 4 | ||||||||||||||||
| 086 | 23 30 41.5 | -23 03 29 | 48 | 0.125 | b | ||||||||||||||||||||||||||
| 087 | 23 31 30.0 | -21 55 00 | r, c | ||||||||||||||||||||||||||||
| 088 | 23 31 42.2 | -20 35 04 | o | 58 | 0.119 | 32 | 0.088 | b, r, c | 0.1490 | 4 | |||||||||||||||||||||
| 089 | 23 31 42.7 | -25 45 07 | 291 | 0.223 | o | ||||||||||||||||||||||||||
| 090 | 23 32 17.3 | -22 24 40 | 57 | 0.132 | c | ||||||||||||||||||||||||||
| 091 | 23 32 25.7 | -25 29 26 | A4014 | 35(0) | 55 | 0.119 | 47 | 0.181 | b, r, c | 0.1128 | 11 | 15 | 0.1130 | 11 | |||||||||||||||||
| 092 | 23 32 41.3 | -23 01 44 | 72 | 0.146 | |||||||||||||||||||||||||||
| 093 | 23 32 55.0 | -21 34 25 | A2614 | 54(1) | o | 46 | 0.167 | r | 0.1635 | 4 | 22 | ||||||||||||||||||||
| 094 | 23 33 01.4 | -23 33 25 | A2615 | 114(2) | 30 | 0.081 | 125 | 0.237 | b, r, c | 0.2061 | 5 | ||||||||||||||||||||
| 095 | 23 33 19.0 | -20 28 01 | o | 64 | 0.206 | ||||||||||||||||||||||||||
| 096 | 23 34 31.4 | -23 56 17 | 67 | 0.139 | b, c | ||||||||||||||||||||||||||
| 097 | 23 35 21.8 | -22 05 42 | o | 50 | 0.180 | ||||||||||||||||||||||||||
| 098 | 23 36 54.0 | -23 24 00 | b, c | ||||||||||||||||||||||||||||
| 099 | 23 37 00.9 | -24 09 23 | A2628 | 83(2) | 324 | 33 | 58 | 0.112 | 65 | 0.196 | b, r, c | 0.1858 | 10 | 8 | 0.1858 | 10 | |||||||||||||||
| 100 | 23 37 01.7 | -20 51 54 | o | 87 | 0.172 | ||||||||||||||||||||||||||
| 101 | 23 37 42.7 | -22 55 23 | A2629 | 100(2) | 80 | 0.155 | 111 | 0.232 | r, c | 0.2069 | 7 | ||||||||||||||||||||
| 102 | 23 37 55.9 | -22 35 53 | 78 | 0.154 | |||||||||||||||||||||||||||
| “Fiducial” | ACO | EDCC | APMCC | MF-B | MF-R | SD-1†† aggregates detected above in 3 maps | SD-2‡‡ aggregates detected above in 2 maps |
|---|---|---|---|---|---|---|---|
| Detections∗∗ number of clusters in the catalog | 58 | 18 | 17 | 54 | 44 | 38 | 65 |
| ACO | 83 | 88 | 59 | 75 | 84 | 68 | |
| EDCC | 49 | 67 | 56 | 36 | 51 | 39 | |
| APMCC | 26 | 33 | 22 | 21 | 29 | 25 | |
| MF-B | 55 | 89 | 71 | 59 | 71 | 54 | |
| MF-R | 68 | 56 | 63 | 57 | 68 | 55 | |
| SD-1†† aggregates detected above in 3 maps | 66 | 67 | 77 | 59 | 59 | ||
| SD-2‡‡ aggregates detected above in 2 maps | 90 | 89 | 100 | 77 | 82 |
| Catalog | Abell | ACO | EDCC | APMCC | MF-B | MF-R | SD-1 | SD-2 | AqrCC |
|---|---|---|---|---|---|---|---|---|---|
| Clusters w/ redshift | 47 | 57 | 18 | 17 | 39 | 38 | 37 | 57 | 72 |
| single cluster in | 0.49 | 0.49 | 0.55 | 0.65 | 0.56 | 0.47 | 0.51 | 0.51 | 0.51 |
| w/ superimposed group | 0.28 | 0.25 | 0.28 | 0.23 | 0.23 | 0.29 | 0.27 | 0.23 | 0.21 |
| two concentrations | 0.08 | 0.11 | 0.17 | 0.06 | 0.13 | 0.08 | 0.05 | 0.11 | 0.11 |
| only small groups | 0.13 | 0.12 | 0.00 | 0.06 | 0.08 | 0.14 | 0.14 | 0.12 | 0.13 |
| no concentration | 0.02 | 0.03 | 0.00 | 0.00 | 0.00 | 0.02 | 0.03 | 0.03 | 0.04 |
| (Mpc) | 0.058 | 0.086 | 0.091 | 0.111 | 0.112 | 0.113 | 0.123 | 0.132 | 0.142 | 0.147 | 0.155 | 0.171 | 0.184 | 0.201 | 0.212 | |||||||||
|---|---|---|---|---|---|---|---|---|---|---|---|---|---|---|---|---|---|---|---|---|---|---|---|---|
| 3.5 | 250 | 2 | 2+2 | 2 | 2 | 2 | 2 | |||||||||||||||||
| 5 | 90 | 2+2 | 5 | 4 | 2 | 2 | 2 | |||||||||||||||||
| 10 | 10 | 2+3 | 14 | 5 | 3 | 4 | 2 | 2+2+3 | ||||||||||||||||
| 15 | 3 | 5 | 21 | 8 | 4 | 2 | 3 | 7 | ||||||||||||||||
| 3.5 | 200 | 4+2+4 | 2 | 2+2 | 4 | 2 | 2 | 2 | 2 | 2 | 2+2 | 2 | ||||||||||||
| 5 | 70 | 7+2+6 | 2 | 7 | 6 | 2 | 2 | 2+2 | 2 | 2 | 2 | 2+2 | 2 | |||||||||||
| 10 | 9 | 3+2 | 17 | 3 | 24 | 6 | 7 | 5 | 4 | 2 | 2+3 | 2+3 | 2+2 | 2+2+4 | ||||||||||
| 15 | 3 | 6 | 21 | 43 | 4 | 5 | 6 | 5 | 4 | 8 | ||||||||||||||