Intermediate-band Surface Photometry of the Edge-on Galaxy: NGC 4565
Abstract
We present a deep, 42.79 hr image of the nearby, edge-on galaxy NGC 4565 in the Beijing-Arizona-Taipei-Connecticut (BATC) band using the large-format CCD system on the 0.6m Schmidt telescope at the Xinglong Station of the National Astronomical Observatories of China (NAOC). Following the procedures previously developed by our team for the analysis of deep images of galaxies (Zheng et al.), we obtain a final image that is calibrated to an accuracy of 0.02 mag in zero point, and for which we can measure galaxy surface brightness to an accuracy of 0.25 mag at a surface brightness at 27.5 mag arcsec-2 at 6660, corresponding to a distance of 22 kpc from the center of the disk. The integrated magnitude of NGC 4565 in our filter is (= R magnitude of 9.1) to a surface brightness of 28 mag arcsec-2. We analyze the faint outer parts of this galaxy using a two-dimensional model comprised of three components: an exponential thin disk, an exponential thick disk, and a power-law halo. Combined with a need to provide a cut-off radius for the disk, a total of 12 parameters are included in our model. We determine the best values of our model parameters via 10,000 random initial values, 3,700 of which converge to final values. We then plot the for each converged fit versus parameter value for each of the 12 parameters. The thin disk and thick disk parameters we determine here are consistent with those of previous studies of this galaxy. However, our very deep image permits a better determination of the power law fit to the halo, constraining this power law to be between and , with a best fit value of . We find the axis ratio of the halo to be 0.44 and its core radius to be 14.4 kpc (for an adopted distance of 14.5 Mpc). We also agree with others that the bulge of NGC 4565 is fit well by an exponential luminosity distribution with scale height similar to that found for the thin disk.
1 INTRODUCTION
In this paper we continue our investigations into the faint surface brightness distributions of edge-on galaxies using data obtained as part of the Beijing-Arizona-Taipei-Connecticut (BATC) Multi-Color Survey of Sky (cf. Fan et al. 1996, Yan et al. 2000). In previous papers detailing our investigations of NGC 5907 (Shang et al. 1998; Zheng et al. 1999), we showed that this galaxy does not have a luminous halo, counter to what was previously suggested (Sackett et al. 1994; Morrison, Boroson, & Harding 1994). Rather, our images showed a faint ring around NGC 5907, likely the result of the tidal disruption of a dwarf galaxy.
The existence of very faint surface brightness features around edge-on spiral galaxies is further investigated here with BATC observations of the well-known galaxy NGC 4565. As opposed to NGC 5907, NGC 4565 is at high Galactic latitude (), implying that its halo should be less contaminated by bright Galactic stars than are our observations of NGC 5907. NGC 4565 is classified as Sb (de Vaucouleurs et al. (1991)). We place it at a distance of 14.5 Mpc, based on its distance in the Mark III catalog (1043 km s-1; Willick et al. (1996)) and a Hubble constant of 72 km s-1 (Freedman et al. (2001)). It is known to have a Seyfert nucleus (Ho et al. (1997)), and has been much studied in the past in terms of optical surface photometry (Jensen & Thuan (1982), hereafter JT; van der Kruit (1979); van der Kruit & Searle (1981), hereafter KS; Kormendy & Bruzual (1978); Hamabe et al. (1980); & (1997), hereafter NJ; Dettmar & Wielebinski (1986)). Most of those earlier studies were based on photographic data. The V-band data of NJ used a CCD with a relatively small field of view, making it difficult for them to accurately determine sky background levels. Infrared J, H and K imaging by Rice (1996) completes the existing photometric imaging data on this galaxy.
Our observations and the details of our reduction of the data we have obtained for NGC 4565 are given in Section 2. The measurement of the luminosity profiles and error analysis are presented in Section 3. Section 4 gives the results of model fitting, comparison and possible systematic effects from PSF and disk inclination. The last section summarizes the main results of this paper.
2 OBSERVATIONS AND DATA REDUCTION
2.1 Observations
Observations of NGC 4565 were obtained with the 60/90cm Schmidt telescope at the Xinglong Station of the National Astronomy Observatories of China (NOAC), using a thick Ford CCD with 15 m pixels at the f/3 prime focus. The field of view of this CCD is and the scale is 1.7′′/pixel. With the nearly one degree field of view, there is sufficient sky in a single frame such that objects with visual sizes less than 30′ can have their sky background determined accurately. The Lick data-taking system is employed and all the CCD images are overscan-subtracted (i.e., initially bias-subtracted) during the readout time (Zheng et al. (1999)).
The filter used for the observations reported here is the BATC filter with central wavelength of 6660 and bandwidth of (Fan et al. (1996) and Yan et al. (2000)). This filter is a good compromise between getting as far to the red as possible, and avoiding many bright sky emission lines with the broadest possible filter. Indeed, all of the BATC filters are designed to avoid contamination by emission lines from the night-sky (cf. Fan et al. 1996).
We obtained 190 images of NGC 4565 from 1995 to 1997, of which we deemed 150 images taken in 22 runs (Table 1) as suitable for analysis. Most of these images are of exposure times 900 to 1200 sec. In a given night all exposures were dithered randomly at a level of pixels to facilitate removal of cosmic rays and CCD defects during the data reduction. The net effect of such dithering is to reduce the full exposure field of view to less than the full field of the CCD. All images used in this analysis have FWHM seeing between 1.7 to 2.6 pixels, or 2.9′′ to 4.4′′, somewhat larger than the typical seeing at the Xinglong observing station. During the observations the gain of the CCD system was adjusted several times (for various reasons owing to having the CCD system work well), resulting in gains of 3.7 e-/adu in 1995, 4.1 e-/adu in 1996, and 3.3 e-/adu in 1997. Readout noise was constant (12 e-) during the three years.
| Date | Naafootnotemark: | Exp.(sec.)bbfootnotemark: | Gain(e-/adu) |
|---|---|---|---|
| 95/01/28 | 1 | 1800 | 3.7 |
| 95/03/03 | 8 | 9600 | 3.7 |
| 95/03/04 | 2 | 1800 | 3.7 |
| 95/05/05 | 2 | 2400 | 3.7 |
| 95/05/06 | 7 | 6623 | 3.7 |
| 95/05/24 | 4 | 3720 | 3.7 |
| 96/01/21 | 4 | 4800 | 4.1 |
| 96/02/17 | 17 | 15300 | 4.1 |
| 96/02/18 | 20 | 18000 | 4.1 |
| 96/02/19 | 20 | 18000 | 4.1 |
| 96/02/20 | 16 | 14400 | 4.1 |
| 96/02/21 | 4 | 3600 | 4.1 |
| 97/03/15 | 4 | 4800 | 3.3 |
| 97/03/29 | 3 | 3600 | 3.3 |
| 97/03/30 | 1 | 1200 | 3.3 |
| 97/04/04 | 4 | 4800 | 3.3 |
| 97/04/05 | 6 | 7200 | 3.3 |
| 97/04/08 | 5 | 6000 | 3.3 |
| 97/04/09 | 7 | 8400 | 3.3 |
| 97/04/10 | 5 | 6000 | 3.3 |
| 97/04/11 | 6 | 7200 | 3.3 |
| 97/05/28 | 4 | 4800 | 3.3 |
| Total | 150 | 154043 |
a -Numbers of frames observed
b -The total exposure time at one night
2.2 Bias and dark
The mean value of overscan-subtracted bias was stable within any one month period of time. 10 bias frames (5 at the start of the night, 5 at the end) are taken daily for the BATC program. As we can track the stability of the bias during the year, we are able to average from 200 to 300 individual bias frames for each night of observation, which removes any stable structure in the bias frame (any variable level is removed via the overscan subtraction). It is this average of many bias frames that is subtracted from the images of a given night. The CCD dark count has been constantly monitored throughout the BATC survey, and has always been found to be stable and rather free of gradients. As the average dark count/pixel is 3 e-/hour, the dark count level in a 42.8 hour exposure is 128 e-/pixel, or 0.04% of the sky level in this combined image and the spatial variation of dark is even smaller; i.e., of negligible importance. This constant dark count value was scaled to exposure time for each image, then subtracted.
2.3 Flat Field
As detailed in our previous papers (cf. Fan et al. 1996; Zheng et al. 1999), the BATC program has developed the means by which we can use dome flats to obtain accurate, high signal-to-noise (S/N), flat fields for flat-fielding sky images. Briefly, the Xinglong Schmidt telescope is equipped with a UV-transparent plastic diffuser plate that can be firmly placed directly in front of the Schmidt corrector. The diffuser provides randomly scattered light to the corrector, reproducing the flux from a uniform sky. Such a method is necessary to accurately flat field our images, as Wild (1997) points out that over a one degree scale, no part of the sky is really flat. Additionally, this fact is attested to by the many BATC images our survey has obtained. We note, however, that it is only with narrow or intermediate-band filters that this diffuser on a Schmidt telescope can produce reliable flat fields. Otherwise, the dome flat field can introduce second-order color terms to broad band observations that must be removed using direct sky images (Fan et al. (1996)).
We take twelve dome flats each day, each with exposure times of 150 seconds. This length of exposure reduces the effect of the finite time for shutter opening and closing, resulting in a spurious gradient of less than 0.013% (cf. Sec. 3.3). All twelve dome flats in one day are combined as the final flat field to correct the frames obtained on the same night. The total count of combined dome flat is about 840,000 electrons per pixel, far higher than that of sky background (about 2,000 electrons per pixel) in a single exposure frame.
2.4 Image Combination
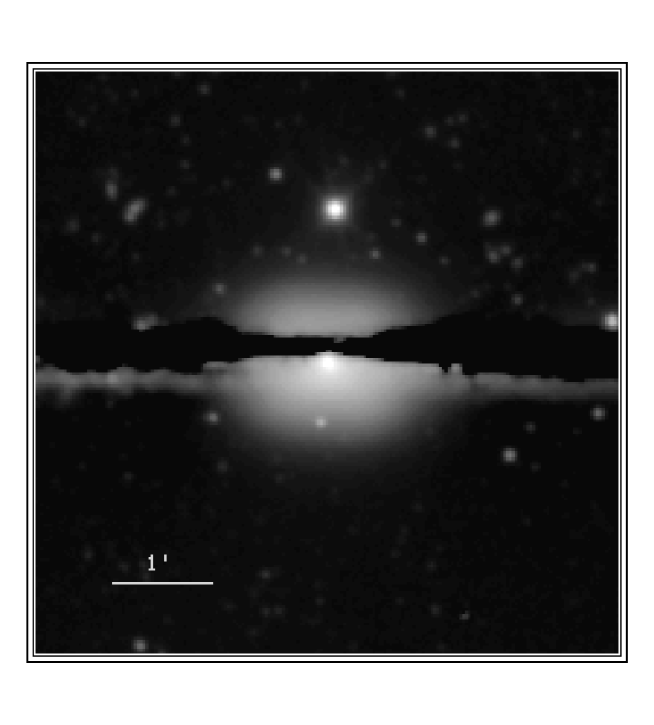
Air mass corrections have to be done for our images on a pixel-by-pixel basis, as there exists close to a 1% gradient in air mass correction over one square degree, even at an altitude of 60 degrees. To take into account the different sets of data (gain differences, dithering, seeing differences, etc.), we combine these images in two steps. First we separate the image frames into 11 groups. Each group includes the frames observed in the same state of instrument system and similar observation conditions (e.g., similar seeing). On average, the observations for a given night are in the same group. The availability of hundreds of well-defined point sources (both stars and distant galaxies) in these frames aided the combination of all frames to a common system. This combination accounts for both dithered frames as well as for slight rotations in the CCD chip from year-to-year. To get all combined images to the same effective seeing radius of 2.3 pixels (), some of the combined images were convolved with Gaussian functions to add small additional values of seeing. Three sigma rejection was used to remove cosmic-rays, hot-points, bad pixels and Schmidt telescope-related ghost-images. The final image shown in Figure 1 is the result of merging the 11 combined frames, a total of 42.79 hours of observation.
2.5 Flux calibration
Photometric calibration was provided by the five nights that were photometric (Mar. 4, 1995, Mar. 6, 1995, Jan. 6, 1997, Jan. 17, 1997, and Apr. 16, 1997). Following the now-standard BATC photometric calibration (cf. Zhou et al. (2001); Yan et al. (2000)), four Oke & Gunn (1983) standard stars (HD 19445, HD 84937, BD +26∘2606 and BD+17∘4708) are used as BATC calibration stars. The calibrations of five nights agree quite well, yielding a zero point accuracy of 0.02 mag as determined from 48 bright stars over the five photometric nights. This zero point yields a sky background in the 6660 intermediate-band BATC filter of 20.72 mag , with a corresponding magnitude of 20.300.02 mag for 1 electron in the 42.79 hour image. The sky background is 0.54 mag brighter than it was for our NGC 5907 observations with the same filter (cf. Zheng et al. 1999), likely owing to a combination of most of the images being taken closer to solar maximum (1996-1997) than were the NGC 5907 images, plus an increase of sky brightness over the last few years at the Xinglong observing station (Liu (2001)).
3 MEASUREMENT OF PROFILES AND ERROR ESTIMATE
Accurate determination of sky background level is a key point for accurate, deep surface photometry. Small variations in sky background, either due to undulations in the CCD sensitivity, or star halos, can affect the measurement of very faint surface brightnesses in galaxies. These issues have been investigated in detail for our data-taking system in our previous investigation of NGC 5907 (Zheng et al.). Here we employ the same methodology as Zheng et al. in obtaining as accurate a fit to the sky background as our data allow.
We first trim our final image to a size of pixels () centered on NGC 4565 (Figure 1). The small size, relative to our full CCD, is due to the dithering of many images. The average sky level in the final image is close to 302,500 e-/pixel, which would nominally yield a statistical error of 550 e-/pixel. However, in combining the images the data are effectively smoothed in to an area of somewhat less than 4 pixel2, yielding a statistical error of 320 e-/pixel for sky in the combined image. In neither case, however, does this statistical error reflect the true error in sky background value, as the true error is convolved with other large-scale sources of variation on the CCD (cf. disucssion below).
3.1 Star and galaxy masking
The software SExtractor (Bertin and Arnouts (1996)) was used to find all objects in our final image with peak flux higher than 3 sigma above the sky background, as well as to separate stars from some of the fainter galaxies in this field. Following Zheng et al., we also classified all stellar–appearing objects into four types: point sources (stars and faint galaxies) whose wings extend less than 25 pixels at a mask level of 40 e- (about 10% the sky variation), bright stars (wing radii 25 pixels), saturated stars (whose peaks are higher than 107 e-) and resolved galaxies. We find more than 12,000 objects in the trimmed image, similar to what we found for the NGC 5907 long exposure images.
To remove as much of the wings of the bright stars as possible, we construct an average PSF from the PSFs of nearly 100 relatively isolated bright stars. In so doing, we can reduce the size needed to mask bright stars by first removing the fainter parts of their PSFs, which are fit using the average PSF. Unfortunately, at the very faint light levels to which our data are sensitive ( mag arcsec-2), we find nearly 10,000 faint objects (almost all distant galaxies at this high Galactic latitude; cf. Odewahn et al. 1996), which limits the radius of our accurate PSF to 25 pixels.
The PSFs of the myriad of faint objects are well fit by this average PSF within a radius of 25 pixels. The fact that we have to restrict the PSF to a radius of 25 pixels is unfortunate for, as luck will have it, too many of the bright stars in this image seem to be near this galaxy (cf. Fig. 1). As shown in Zheng et al., residual light from bright stars affects the measurement of very faint light levels around galaxies. On the other hand, choosing very large masks is not an option, as we find that if we masked out the full PSF of the saturated stars near NGC 4565, we would be left with little of the galaxy to measure.
As a compromise, we first assume that the outer wings of bright and saturated stars are center-symmetric, then later deal with the known asymmetries in the Schmidt PSF. We apply median filters to construct a one-dimensional PSF, whose wings can extend to as far as 300 pixels (510 arcsec) in radius. From this symmetric PSF we construct a two-dimensional PSF and separately subtract it from all the bright and saturated stars. We subtract the wings of the PSF from saturated stars manually to find the best scale factor for each star. The final masks for the saturated stars are designed to be larger than the residual asymmetrical ripples seen in the subtracted PSFs (cf. Zheng et al. (1999)). Also sets of small masks are applied to mask the spikes in the Schmidt PSF. Background galaxies and faint stars are masked entirely, with the radius of the masks checked by eye. NGC 4565 itself was masked using three circles: one with a radius of 350 pixels, and two with radii of 250 pixels, The final masked image is shown as Figure 2.
3.2 Sky background fitting
The remaining sky background comprises 27.3% of the area of the final masked image. Before sky fitting, a median filter of 1515 pixels is convolved with the masked image using only unmasked pixels. This was done to increase the fraction of area with sky background, as most of masked regions with radii less than 10 pixels are replaced by surrounding background. After such median filtering, the effective sky background increases to 52.8% of the whole image.
We use the method of Zheng et al. to fit the sky background. Briefly, because of the large masked central region of object galaxies, one-dimensional row or column fitting with functions of high order will introduce uncontrolled fluctuations in the fitted sky. To avoid this, a one order Spline3 fit was applied in one-dimension, both row-by-row and column-by-column separately (cf. Zheng et al.), using only those unmasked points with backgrounds of the average. We then average the row-fitted and column-fitted images and smoothed the average with a circular-gaussian filter of =30 pixels. This smoothed fit is then adopted as the sky background and subtracted from the final image.
As a test, we also use one-dimensional, low-order Legendre polynomials in place of the Spline3 fits. The difference between the two sky images in the central region around NGC 4565 is less than 40 (out of a sky background of 302,500 ). Hence, determination of the sky background is not significantly affected by the spline-fitting function used. To estimate the systematic error of sky-fitting, we again mask the background subtracted image and separate the image into 400 adjoining regions of 8585 pixels. The standard variation of mean values of these 8585 boxes is 115 . This is regarded as the best estimate of the added error introduced by our sky-fitting procedure. Figure 3 shows the plots of four slices of sky background–subtracted image, which shows the accuracy of the method (cf. Figures 7 and 8 in Zheng et al.).

3.3 Error estimate
There are two types of errors that can affect our results. One type is random and yields a Poisson distribution that can be suppressed by increasing the number of sampled points. The another type is systematic in nature, and is usually independent of sample size. In the following, we will discuss the error sources individually.
Readout noise
Readout noise is random noise which is introduced in the process of data readout. For our CCD, the value is 12 per frame. Because the combined image is made of 150 frames, the final noise is 147.0 . The bins used for the analysis of the light distribution in the halo of NGC 4565 vary in size from 24 pixels (a box of 83 pixels) to 1750 pixels (a box of 35 50 pixels). Hence, when averaged in this way, the readout noise is 30.0 for the smallest bins, and 3.5 for the largest bins.
Sky background photon noise
As discussed above, the merging process to produce the final image effectively smooths the data, such that the flux in each pixel is an average of nearly 4 pixel2 around it. Hence, in the final image, the photon error per pixel is 320 e-, as opposed to the 550 e- one might otherwise expect from a mean sky background of 302,500 . Using this value, we estimate the photon sky noise to be 15 e- for a region pixels in size (our largest bin size), and 130.6 e- for a region pixels in size (our smallest bin size).
Dark current noise
The dark current of our combined image of 42.79 hour is 128.3 . This introduces random noise of 11.3 . For the smallest and largest bins, this value reduces to 2.3 and 0.27 separately.
Bias subtraction noise
Since the readout noise is 12 and 200 to 300 bias frames are used to form final average bias, the error from bias subtraction is about 0.8 , yielding 0.02 for the region of pixels and 0.17 for the smallest bins used here.
Flat field: Random and Systematic Noise
The averaged nightly flat used here is comprised of 12 dome-flats with total counts about 840,000 , yielding a photon noise close to 0.1%, or 330.1 equivalent sky background counts. Given that that final image includes 150 shifted, averaged flats the error per pixel is reduced to 0.009%. This part of the flat field error is random in nature and translates to a formal error of 0.0002% for the largest sample bins used here, to 0.0018% for the smallest bins.
The stability of the large-scale flat field was checked by comparing the dome-flats from adjacent nights. The average results of these tests indicate an error of 0.03%, or close to 90 for our measured sky background. In our CCD system, the opening and closing time of shutter is 20 milliseconds and the exposure time of each dome-flat is 150 seconds. So there exists a 0.013% gradient due to finite shutter speed in the each dome-flat frame. Combining these two sets of errors, we estimate the error from systematic variations in the large-scale flat-field is 0.033%, equivalent to 100 of sky background.
Intrinsic variation in galaxy brightness
Following MBH (Morrison et al. (1994)) and Zheng et al., we can calculate the random error due to intrinsic variation in the surface brightness of the galaxy. In the terminology introduced by Tonry and Schneider (1988), m1 for our image is 20.30 mag, the exposure time is 154,043 sec, the distance is 14.5 Mpc and is adopted as 0 (Zheng et al. (1999)). In the case of 300 from the galaxy (equal to a surface brightness of 28.23 mag ), this error is 53.8 , or an error of 18translates to an average error of 1.29 for the largest bins used here, to 10.98 for the smallest bins.
Background subtraction
There are two types of background subtraction errors, both dominated by systematic effects. One is the accuracy of the sky background subtraction, for which we adopt the value of 115 e- obtained above. The second comes from imperfect star subtraction, especially for saturated stars. For this we adopt an average error of 100 e-/pixel by checking the regions in which stars are subtracted. We acknowledge this error can be significantly higher for selected stars, especially for the saturated stars which are so close to NGC 4565. For the true errors involved in star subtraction, we must look to the consistency of the luminosity profiles at faint surface brightness levels.
3.4 The Total Error Budget
All the sources of errors discussed are listed in Table 2. We assume that the mean count per pixel from the object galaxy is 300 e- (i.e., in its faint halo), a sky level of 302,500 e- and bin sizes of 3550 pixels and 83 pixels for surface photometry. This leads to a final error of close to 400 . Errors for each bin are calulated based on the number of non-masked pixels in that bin, ratioed to the error expected for all pixels in that bin having data.
As photon noise in the sky is the dominant source of error in our data, we give the expected error per bin for both the smallest bin we use for -profiles (83 pixels) and the largest bin we use for -profiles (3550 pixels). The error for the faintest part of NGC 4565 is close to 183 , or 63 . That is, the relative error of measured flux at 28.77 mag arcsec-2 is 100%, leading to an error bar of 0.75 mag arcsec-2. This also corresponds to an error of 0.25 mag arcsec-2 at a surface brightness of 27.5 mag arcsec-2. In fact, the error is a little higher than this, because there exist masked regions in the measured boxes. The main sources of error are from large-scale variation of flat-field, sky fitting and residuals from star subtraction.
| Source of variation | % | 3550 bin(e-)a | % | 83 bin(e-)a | % | |
|---|---|---|---|---|---|---|
| Readout noise | 147.0 | 0.049 | 3.5 | 0.001 | 30.0 | 0.010 |
| Photon noise of sky | 320.0 | 0.106 | 15.0 | 0.005 | 130.6 | 0.043 |
| Dark | 11.3 | 0.004 | 0.27 | 0.0001 | 2.3 | 0.0008 |
| Bias (formal) | 0.8 | 0.0003 | 0.02 | 0.0000 | 0.17 | 0.0001 |
| Flat field (small-scale/pixel scale) | 26.9 | 0.009 | 0.6 | 0.0002 | 5.1 | 0.0017 |
| Flat field (large-scale/ pixel scale) | 100.0 | 0.033 | 100.0 | 0.033 | 100.0 | 0.033 |
| Surface brightness fluctuationsb | 53.8 | 0.018 | 1.29 | 0.0004 | 10.98 | 0.0036 |
| Background subtraction | 115.0 | 0.038 | 115.0 | 0.038 | 115.0 | 0.038 |
| Star subtraction | 100.0 | 0.033 | 100.0 | 0.033 | 100.0 | 0.033 |
| Total | 401.2 | 0.133 | 182.9 | 0.060 | 226.6 | 0.075 |
a The error in surface photometry for bins of or
at a count of sky level
b Here assuming 300 from the galaxy.
4 ANALYSIS AND RESULTS
4.1 Luminosity profiles
As others have done (cf. NJ), we use a contour map to determine the position angle of the major axis. Then the sky-subtracted image is rotated to that angle to put the major axis of the object galaxy along the x-axis direction. At the same time, all circular masks but the three masks used for the object galaxy were transformed to the new coordinate system and imposed on the rotated image (Figure 4).
For purposes of analysis, we measure the luminosity profiles of NGC 4565 in two orthogonal directions. One direction is parallel to the galaxy minor axis (the “” direction), the other is parallel to the major axis (the “” direction). We sample the direction in discrete lengths (parallel to the major axis) of 35 pixels (1 arcmin) on both sides of the major axis. We employ bins of varying width perpendicular to the major axis (i.e., along the direction): from 1 pixel when = 0 (i.e., on the major axis) to 50 pixels for the largest distances (). This methodology yields bin sizes that vary from 351 pixels to 3550 pixels. Only unmasked pixels are used, and the flux cited is the median value for that bin. The measured and profiles are shown in Figure 5. Here we adopt a distance of 14.5 Mpc, with kpc.
We see that the four -profiles in each plot (i.e., all four quadrants of the galaxy) agree reasonably well down to surface brightness of 28 mag arcsec-2, or a level of 0.12% of sky) within a radius of 6 arcmin. Greater than that distance, the well-known warp in the disk of this galaxy (SE to NW) (cf. Sancisi (1976); van der Kruit (1979); & (1997); see below) begins to break down the symmetry. The -profiles are tabulated in Table 3 (full table in electronic form).
The series of profiles are parallel to the major axis with distance: 0′′,10′′,20′′,30′′,40′′,60′′,80′′,100′′ and 120′′ respectively. Since the -profiles decreases quickly at small and relatively slow at larger , the sizes of rectangles are changed from 83 pixels at to 811 pixels at . The measured profiles are also in Figure 5. The asymmetries of the NW and SE parts are also shown in -plots. The data are listed in Table 4.
| i(6660) | High Error | Low Error | |||
|---|---|---|---|---|---|
| (arcmin) | (arcsec) | (kpc) | () | () | () |
| 0.00 | 2.57 | 0.18 | 19.50 | 0.04 | 0.04 |
| 5.99 | 0.42 | 20.27 | 0.03 | 0.03 | |
| 9.41 | 0.66 | 20.59 | 0.02 | 0.02 | |
| 12.83 | 0.90 | 20.37 | 0.02 | 0.02 | |
| 16.25 | 1.14 | 20.07 | 0.02 | 0.02 | |
| 19.67 | 1.38 | 19.85 | 0.01 | 0.01 | |
| 23.09 | 1.62 | 19.93 | 0.01 | 0.01 | |
| 26.51 | 1.86 | 20.16 | 0.01 | 0.01 | |
| 29.93 | 2.10 | 20.42 | 0.02 | 0.02 | |
| 33.35 | 2.34 | 20.73 | 0.02 | 0.02 |
Note.– Only a portion of Table 3 listed here.
| i(6660) | High Error | Low Error | |||
|---|---|---|---|---|---|
| (arcsec) | (arcsec) | (kpc) | () | () | () |
| 0.00 | 0.00 | 0.00 | 17.55 | 0.10 | 0.11 |
| 10.26 | 0.72 | 18.45 | 0.09 | 0.09 | |
| 20.52 | 1.44 | 18.85 | 0.06 | 0.06 | |
| 30.78 | 2.16 | 19.23 | 0.07 | 0.08 | |
| 41.04 | 2.89 | 19.57 | 0.07 | 0.07 | |
| 51.30 | 3.61 | 19.74 | 0.06 | 0.06 | |
| 61.56 | 4.33 | 20.01 | 0.07 | 0.07 | |
| 71.82 | 5.05 | 20.22 | 0.06 | 0.07 | |
| 82.08 | 5.77 | 20.53 | 0.02 | 0.02 | |
| 92.34 | 6.49 | 20.53 | 0.02 | 0.03 |
Note.– Only a portion of Table 4 listed here.
4.2 Warp
Figure 6 shows the central points of the profiles parallel to the minor axis. This was determined by keeping the upper and lower profiles in the best agreement. By plotting these central points as a function of radius in this galaxy, we map out its warp from SE to NW sides. The NW warp was first found in HI (Sancisi (1976)) and the optical warp of both sides was discussed by NJ.
The figure shows that the stellar warp starts at 21 kpc from the center of galaxy and is less distorted than that of NGC 5907 (Zheng et al. (1999); Morrison et al. (1994)), whose warp starts from 4.1 kpc. In fact, the starting points of warp are asymmetric: 21 kpc NW and 25 kpc SE. This causes the asymmetries in -plots and -plots (Figure 5). The amplitude of the warp increases rapidly after it begins, becoming more than 1 kpc from the centrally–defined major axis after a distance of 30 kpc. We plan to take further deep images of NGC 4565 to better explore its fainter stellar populations, including those in its warp.

4.3 Comparison with previous work
Jensen and Thuan (1982) present the luminosity profile of NGC 4565 in the B and R bands, using photographic data. As our intermediate-band i filter centered at 6660 is quite similar to R-band (cf. Fan et al. 1996), it is straightforward to compare with JT’s results. Zhou et al. (2001) give the transformation between the BATC i-band and R-band as: . The data of JT are then compared to our own as a function of the direction for six values of , as shown in Figure 7. Here we plot the difference between observed profiles and our fitted profile , as a function of distance. In general, the JT’s data (upper plots) agree with ours (lower plots) within 0.5 mag, but the data of JT become systematically fainter than ours at large radii and -distances. Given that the data of JT are photographic, their faint values are more subject to larger systematic problems than ours.


4.4 The adopted model
Previous studies have shown that one single disk can not fit the fainter parts of the -profiles of NGC 4565 reasonably (Jensen & Thuan (1982); Shaw & Gilmore (1989); & (1997)). Rather, for the profiles we adopt a three-component model: thin disk (seen at inclination ), thick disk (cf. Burstein (1979)), and halo. The structure for the thin and thick disks adopted is that of the sech model (van der Kruit & Searle 1981), which has a density distribution of a self-gravitating isothermal sheet in the direction. Alternate fits proposed by de Grijs & van der Kruit (1996) (i.e., exponential or sech() light distributions), while fitting better at small values, are not as physically motivated as the model. Moreover, all three models show the similar behavior at large , showing that the different models do not affect the model of the halo one derives for edge-on galaxies. A standard exponential disk was used in the radial direction (), well away from the bulge.
The density distribution of both the thin and the thick disks is described by
| (1) |
with and as the disk scale height and scale length and equal to twice the scale height of the exponential model. As galaxy disks do not go to infinity in either the or the directions (cf. Figure 4), we introduce a cutoff in the -distribution at , beyond which for , . For an edge-on galaxy, this means
| (2) |
Here, is the projected distance from the center along the major axis.
A power-law halo is introduced as the third component, with its luminosity distribution modeled as in NJ:
| (3) |
where is the core radius, is the axis ratio and is the power index. For an edge-on galaxy, this model has the form (where is the standard Gamma function):
| (4) |
4.5 Profile fitting
4.5.1 Data used for fitting
As its dust lane nearly bisects the major axis of NGC 4565, it is difficult for us to fit all the components of this galaxy (nucleus, bulge, disks and halo) simultaneously. The primary purpose of the present paper is to search for luminous halos in edge-on galaxies. Hence, we concentrate only on the three components whose luminosity distributions affect the halo of this galaxy: thin disk (via projected major axis), thick disk and halo. To avoid the possible effect of nucleus, bulge, dust lane and warps, only the -profiles with 2′ 7′ were used in the fit. For -profiles, we rejected the profiles along the dust lane and the points within bulge. Though there exists obvious asymmetries between the NW and SE parts of galaxy, they are treated here the same owing to the fact that large areas in both sides of the galaxy are masked.
A general method was used to estimate the parameters of the fits. In principle, one should use a weighted fitting scheme (cf. Shaw & Gilmore 1989) of the form:
| (5) |
with and as observed and fitted surface brightnesses. In practice, the values assigned to depend on what one is trying to fit. Unfortunately, the manner in which we can compensate for fainter surface brightness levels (by using larger sample bins) does not fully compensate for the observational errors in the outer regions, which are much larger than those in the inner regions. In addition, by sampling with different bin sizes, we have more measurements nearest the major axis than we do far away from the major axis. Thus, we have more points in our fit for the inside regions with small uncertainties than those for the outside with large uncertainties. Strictly error–weighting the data would bias the fits toward the innermost data. As such, we chose to give equal weight to the bins, which better accounts for the larger number of bins close to the major axis. The fitting algorithm was implemented using the Levenberg-Marquardt technique, with the subroutine used taken from Numerical Recipes (Press et al. (1992)).
4.5.2 Estimates of parameters
Three parameters must be determined before fitting: the coordinates of the galaxy center and and the sky background value. The latter component has already been removed from the data to be analyzed. The effect of inclination is neglected here (but considered later), as NGC 4565 is so nearly edge-on. This leaves us 12 parameters to fit, namely: 3 surface brightness , and (with 1 = thin disk; 2 = thick disk and 3 = halo), the scale heights and of thin and thick disks components in -direction and scale lengths and in radial direction, the cutoff radius and of two kinds of disks, and the core radius , axis ratio q and power index of the halo.
Unfortunately, we have too many parameters for the fitting procedure to converge successfully. As discussed by Fry et al. (1999), for three free parameters, the initial estimates need to be within 20% of the correct values for the model to converge. At the same time, the existence of many local minima make the final fit strongly dependent on the initial estimate of these parameters.
To find the true minimum and the best fit, we randomly selected 10,000 sets of 12 initial parameters spaced uniformly as to cover the reasonable range covered by these parameters (Table 5). Of these 10,000 tries, we found nearly 3,700 convergences. The for these 12 parameters from these 3,700 convergences are plotted against the value for finding for those convergences in Figure 8. The minimum is marked as symbol star in each sub-plot.
| Thin disk | Thick disk | Halo(power-law) |
|---|---|---|
| : 20 - 23 mag | : 23 - 27 mag | : 22 - 27 mag |
| : 0.6 - 1.5 kpc | : 1.2 - 2.9 kpc | : 0 - 22 kpc |
| : 5.8 - 11.6 kpc | : 7.2 - 29.0 kpc | : 2 - 5 |
| : 29 - 38 kpc | : 32 - 39 kpc | : 0.1 - 0.9 |
The distributions of , , (i.e., the thin disk component) and (the axis ratio of the halo) are well determined by our data. The axis ratio of the halo we obtain (0.44) is in good agreement with that of NJ, who show that = 0.5 is a better fit than = 1.0 for a two-disk-plus-halo model in the V-band.
The parameters of the thick disk and the power-law halo have wide distributions. The scale height of the thick disk (2.55 kpc) is about twice of that of the thin disk and agrees with the kpc () given by Burstein (1979) for S0 galaxies. The thick disk scale length is 11.03 kpc, larger than that of the thin disk. The luminosity of the thick disk is 20% of the thin disk. The core radius of the power-law halo is 14.4 kpc, indicating a flat halo. This agrees with the third component of three disk models of NJ and that of Shaw & Gilmore (1989), in which the scale lengths of their third disks are about 13.9 kpc (at a distance of 14.5 Mpc). The values of concentrate in the range of 3.2 to 4.0, which indicates that there does not exist a halo in this galaxy. The best power index is 3.88, between the 3.5 of Milky Way (Zinn (1985)) and the 4.0 of M31 (Pritchet & van den Bergh (1994)). The of the thin and the thick disks show several local minimums, owing to data sampling. The cutoffs of the thin and thick disks are about 32 kpc and 37 kpc, respectively.
Analyses of correlation between any two parameters show that some of the parameters are correlated, which means some of the parameters can not be determined independently. For example, we find correlation between and and among , and . The similar distributions of , and in Figure 8 also show such a correlation.
The error for each parameter is obtained in the following way. Random values are selected for the observed data such that they obey a normal distribution, with sigmas determined by the known errors in each sampled bin. We then obtain the best–fitted parameters for that set of data. This procedure is repeated three hundred times, giving us 300 separate determinations of the best-fitted value for each parameter. The statistical standard deviation of each parameter from this procedure is adopted as the final error for this parameter.
The best fit parameters and errors are listed in Table 6. Table 6 also lists the total magnitude in 6660-band to a surface brightness of 28 mag arcsec-2, (or broad-band R = 9.10 from the Zhou et al. transformation), which is measured by replacing masked areas around the galaxy by the corrsponding parts of the unmasked galaxy.
| Thin disk | Thick disk | Power-law halo |
|---|---|---|
| mag | mag | mag |
| kpc | kpc | kpc |
| kpc | kpc | |
| kpc | kpc | |
| mag |
a- Total photometrical magnitude of NGC 4565 at 6660 to
surface brightness of 28 mag .
b- The luminosity ratio of model thick-disk and thin disk.
c- The luminosity ratio of model power-law halo and thin disk.
Figure 5 presents the best fitting values for the three components compared to our data in both the and directions. The fits are quite good in the range of to for the -profiles and in the range of to for -profiles. As expected, the model deviates significantly from the data in the region of the bulge (not-fitted) and where the warp of the disk becomes sizeable.
Table 7 compares the dimensional parameters obtained by this study and to similar parameters determined by other studies of NGC 4565, as magnitude zero points are too dependent on the filter that was used. The thin disk parameters are consistent among the different analyses. Our value of 8.05 kpc for the thin disk exponential scale length and 1.17 kpc for its scale height are close to those obtained by R96, KS, NJ and SG, scaled to our adopted galaxy distance. The scale height and scale length of our fits to the thick disk agree best with the thick disk in SG’s two–disk + R1/4 halo model. The thick disk components of our model are somewhat larger than the thick disk in the three–disk models, likely owing to the halo being much flatter in the inner region of NGC 4565 than the models for the third disk used by these other studies.
| component | filter | thin-disk | thick-disk | third-disk(exp) | or halo | |||
|---|---|---|---|---|---|---|---|---|
| (kpc) | (kpc) | (kpc) | (kpc) | (kpc) | ||||
| KS | 8.0 | 1.15 | ||||||
| H80 | B | 8.8 | 0.46 | 3.46 | ||||
| H82 | B | 9.7 | 0.50 | 4.10 | ||||
| JT | B | 9.9 | 9.9 | 1.88 | 4.78 | 0.52 | ||
| R96 | K | 8.4 | 1.28a | |||||
| SGb | B | 10.6 | 1.10 | 6.2 | 1.62 | 3.42 | ||
| R | 6.8 | 1.07 | 7.5 | 1.90 | 4.23 | |||
| NJb | V | 8.1 | 0.87 | 8.6 | 1.88 | 5.1 | ||
| SGc | B | 8.0 | 1.20 | 12.9 | 2.28 | 0.37 | ||
| R | 7.0 | 1.13 | 9.1 | 2.29 | 0.36 | |||
| KB | V | 3.46 | ||||||
| SOSCB | 3.78 | |||||||
| This workd | 8.05 | 1.17 | 11.03 | 2.55 | 0.44 | 3.88 |
a - R96 use sech disk model give =0.44 which corresponding to
.
b - sech2+sech2+exp model
c - sech2+sech2+ halo model
d - sech2+sech2+power-law halo model
Note.- All the values in the table are transformed to the distance of
14.5 Mpc.
KS: van der Kruit & Searle (1981); H80: Hamabe et al. (1980); H82: Hamabe (1982); JT: Jensen & Thuan (1982);
R96: Rice (1996); SG: Shaw & Gilmore (1989); NJ: & (1997); KB: Kormendy & Bruzual (1978);
SOSCB: Spinrad et al. (1978)
4.6 Bright Versus Faint Parts of NGC 4565
As our data go very faint, one worry is that the very faintest parts of the PSFs of the bright stars could interfere with our measurement of the halo of this galaxy (such as we found to be the case in our analysis of NGC 5907; cf. Zheng et al.). As our final image of NGC 4565 did not permit us to fully test the faintest parts of the PSF in a reliable manner, we separately observed a set of bright stars with the same CCD parameters. From those observations we construct a new PSF that can extend to 1700 arcsec, compared to the extension of only 510 arcsec permitted by our final NGC 4565 image. (In this we note that even 510 arcsec is still farther than the radii considered by either Morrison et al.(1994) for NGC 5907 or Fry et al.(1999) for NGC 4244). The agreement between the PSF we obtain from our NGC 4565 image and that obtained from the special bright star images is excellent where they overlap (i.e., interior to 510 arcsec).
There are two effects that can, in principle, affect our halo results. One is scattered light from the nucleus and bulge. The other is the scattered light from the brighter parts of the galaxy as a whole. To test the first effect, the nucleus and bulge is separated from the other parts of galaxy by subtracting our best fitting model from the final image (cf. Figure 11). We then convolve the resulting nucleus and bulge with the extended PSF. The result is shown in Figure 9. The -profiles of our model are represented by solid lines, and the outer wings due to scattered light from the nucleus and bulge are represented by dashed lines. We find that scattered light from the central region of NGC 4565 at least 2 mag arcsec-2 fainter than the model fit everywhere, including on the minor axis.

To test the effect of scattered light from the galaxy as a whole, we convolved the model with the full PSF (dotted line in Figure 9). As is evident, the extended PSF has little effect on the model we derive for the faintest parts of NGC 4565, being at most 0.2 - 0.3 mag different at very faint surface brightness, where the errors of measurement are at least that high. We conclude that, within the errors of measurement, our parameters for the halo of NGC 4565 are not significantly affected by scattered light from the brighter parts of the galaxy.
4.7 Inclination
We estimate the inclination of the disk of NGC 4565 by assuming that the thin disk of this galaxy is round with a radius of 38 kpc, and the dust lane is flat and lies at the mid-plane of the disk. We assume that the upper-edge (cf. Figure 4) of the dust-lane could be the edge of round disk. By measuring the projected distance between the upper-edge of the dust-lane and the major axis of NGC 4565 in the plane of the sky, taking into account the radius of the disk, we obtain an inclination of 87.5∘, which is somewhat higher than that of 86∘ in KS(1981).
Given our model assumes that the galaxy is exactly edge-on (), we can test how our model changes for different values of via the following transformation:
| (6) |
The variable of integration, , is along the line-of-sight. We plot the minor axis profiles with 90∘, 87.5∘, and 86∘ for both the thin and the thick disks in Figure 10. As might be expected, the form of the thick disk is relatively insensitive to the exact inclination used for this galaxy. Even the thin disk model is only slightly more sensitive, having a central surface brightness mag arcsec-2 fainter for 87.5∘ than for .

4.8 Bulge
The bulge can be obtained, after subtraction of the disks and halo. We show the two-dimensional distribution of the bulge and the profile along the minor axis in Figure 11. The bulge extends up to 5 kpc, and it is clear that it cannot be described by R1/4–law (dashed line) from 0.7 kpc to 5 kpc. Rather, an exponential distribution (cf. Kormendy & Bruzual (1978)) (solid line) with a scale height of kpc () is the best fit to the bulge luminosity distribution, consistent with the values of 0.72 kpc determined by JT and 0.75 kpc in the K-band (Rice (1996)). We find the bulge to have an ellipticity of 0.8, based on a simple fit using elliptical isophotes.
Speculation abounds in the literature about the nature of the bulge seen in NGC 4565. Is it bar-shaped, seen with the long axis projected along our line-of-sight (much like the bar of our own galaxy; cf. Blitz & Spergel (1991))? Or is it dynamically coupled to the thin disk (which has a similar exponential scale height) so that it takes a peanut-shaped or boxy shape? In absence of clear-cut dynamical data on the motions of stars in the bulge, the photometric data alone cannot choose among these options. Even so, the nearly pure exponential nature of the bulge of NGC 4565 hints more of a bar than it does of a typical R1/4–law bulge.

4.9 Face-On Warp?
The striking image presented of the bulge in Figure 11 highlights an issue that also can be seen in sky-subtracted image of the whole galaxy in Figure 4: there seems to be far fewer faint objects in the lower SW side of the galaxy disk than in the upper NE side of the galaxy disk. As seen in Figure 4, this asymmetry in number of giant objects seems to extend to 2-3 arcmin in the SW direction. Unfortunately, we cannot appeal to HST observations of this galaxy, as such imaging (Kissler-Patig, et al. (1999)) avoided the NE side owing to the bright star there.
The only reasonable interpretation we can give to the existence of an asymmetry in the faint objects around NGC 4565 is that there is obscuring matter between NGC 4565 and the background galaxies. If this proves to be true (and we plan to investigate this issue further in another paper), then it could be evidence for a face-on warp in this galaxy. Such a warp would have to be part of the disk facing away from us, as the nucleus of this galaxy is obviously not obscured.
5 SUMMARY
We have obtained deep intermediate-band () surface photometry of the nearby, bright, edge-on galaxy NGC 4565. The combination of having a nearly 1 square degree field of view, the ability to use the dome to obtain high S/N flat fields, accurate subtraction of the PSF wings of stars, and an accurate method for two-dimensional sky subtraction combine to yield a limiting magnitude of 28.77 mag (at which the observational error reaches 0.75 mag ; or 0.25 mag at a surface brightness of 27.5 mag arcsec-2). The sky background in our image is 20.72 mag arcsec-1, about 0.5 mag arcsec-2 brighter than the sky found in our NGC 5907 observations in the same filter (cf. Zheng et al. 1999). The total magnitude of NGC 4565 in 6660-band is 8.990.02 mag (equivalent to R = 9.10) to a surface brightness of 28 mag arcsec-2.
The luminosity distribution of the galaxy is presented in a series of cuts both parallel to its minor axis (-profiles) and parallel to its major axis (-profiles). Excluding the dust lane, the -profiles are symmetric in all four quadrants out to a radius of 6 arcmin. The -profiles extend to nearly 30 kpc (at 29 mag ), farther than given by previous studies of this galaxy.
We construct a two-dimensional model of the outer parts of this galaxy comprised of three components (thin-disk + thick-disk + halo). Altogether the model includes 12 parameters, including a cut-off radius for the disk. The values of these parameters are determined by the values from a series of 3,700 initial starting values which eventually converge to distinct values. The parameters so-derived for the thin and thick disks generally agree with those derived by previous studies. As our halo observations go much deeper than those of previous studies, we obtain a more reliable measurement of the power–law behavior of the halo, with its power-law index determined to lie between 3.2 and 4.0 (best-fit value of 3.88). Our observations effectively rule out the possibility of an halo in NGC 4565. We obtain an axis ratio for the halo of this galaxy to be equal to 0.44 and core radius of 14.4 kpc, which suggest a flattened ellipsoid.
We test for two factors which could affect our results: scattered light from the galaxy itself and an incorrect value used for the inclination of the galaxy disk. We find neither significantly affects our results. However, if our data are accurate enough, the effects would be present, at most, at the 0.2–0.3 mag arcsec-2 level. We measure an inclination of NGC 4565 of from the offset of the dust lane in the inner disk from the nucleus of the galaxy.
We obtain a two-dimensional luminosity distribution for the bulge of NGC 4565 by subtracting our two-disk+halo model from the original image. The luminosity profile along the minor axis of the bulge of NGC 4565 is well fitted by exponential model with scale height similar to that of the thin disk (consistent with was has been found from previous studies).
In the coming years, our survey will obtain deep images in all of the 15 BATC passbands (cf. Zhou et al.) of NGC 4565, as well as for a number of other, nearby galaxies. With a complete sampling of the visible and near-infrared spectrum of these galaxies, we will be able to study the stellar populations in their disks, bulges and halos.
References
- Bertin and Arnouts (1996) Bertin, E., & Arnouts, S. 1996, A&AS, 117, 393
- Blitz & Spergel (1991) Blitz, L. & Spergel, D. 1991, ApJ,379, 631
- Burstein (1979) Burstein, D. 1979, ApJ, 234, 829
- de Grijs & van der Kruit (1996) de Grijs, R., & van der Kruit, P. C. 1996, A&AS, 117, 19
- Dettmar & Wielebinski (1986) Dettmar, R. J., & Wielebinski, R. 1986, A&A, 167, L21
- de Vaucouleurs et al. (1991) de Vaucouleurs, G., de Vaucouleurs, A., Corwin, H.C.G., Jr., Buta, R. J., Paturel, G. & Fouqué, P. 1991, Third Reference Catalog of Bright Galaxies (New York: Springer-Verlag)
- Fan et al. (1996) Fan, X.-H. et al. 1996, AJ, 112, 628
- Freedman et al. (2001) Freedman, W.L, 2001, ApJ, in press
- Fry et al. (1999) Fry, A. M., Morrison, H. L., Harding, P., & Boroson, T. A. 1999, AJ, 118, 1209
- Hamabe et al. (1980) Hamabe, M., Kodaira, K., Okamura, S., & Takase, B. 1980, PASJ, 32, 197 (H80)
- Hamabe (1982) Hamabe, M. 1982, PASJ, 34, 423 (H82)
- Ho et al. (1997) Ho, L. C., et al. 1997, ApJS, 112, 391
- Jensen & Thuan (1982) Jensen, E. B., & Thuan, T. X. 1982, ApJS, 50, 421 (JT)
- Kissler-Patig, et al. (1999) Kissler-Patig, M., Ashman, K.M., Zept, S.E., & Freeman, K.C. 1999, AJ, 118, 197
- Kormendy & Bruzual (1978) Kormendy, J., & Bruzual, A. G. 1978, ApJ, 223, L63 (KB)
- Liu (2001) Liu, Y., 2001, thesis for Bachelor Degree, Nanjing University
- Morrison et al. (1994) Morrison, H. L., Boroson, T. A., & Harding, P. 1994, AJ, 108, 1191 (MBH)
- & (1997) , M., & , S. 1997, A&A, 325, 915 (NJ)
- Odewahn et al. (1996) Odewahn, S.C., Windhorst, R.A., Driver, S.P., Keel, W.C. 1996, ApJ, 472, 13
- Oke and Gunn (1983) Oke, J. B., & Gunn, J. E. 1983, ApJ, 266, 713
- Press et al. (1992) Press, W. H. et al. 1992, Numerical Recipes in Fortran, Second Edition (Cambridge University Press, Cambridge)
- Pritchet & van den Bergh (1994) Pritchet, C. J., & van den Bergh, S. 1994, AJ, 107, 1730
- Rice (1996) Rice, W. 1996, AJ, 112, 114 (R96)
- Sackett et al. (1994) Sackett, P. D., Morrison, H. L., Harding, P., & Boroson, T. A. 1994, Nature, 370, 441
- Shang et al. (1998) Shang, Z. H., et al. 1998, ApJ, 504, L23
- Sancisi (1976) Sancisi, R. 1976, A&A, 53, 159
- Shaw & Gilmore (1989) Shaw, M. A., & Gilmore, G. 1989, MNRAS, 237, 903 (SG)
- Spinrad et al. (1978) Spinrad, H., Ostriker, J. P., Stone, R. P. S., Chiu, L. T. G., & Bruzual, A. G. 1978, ApJ, 225, 56 (SOSCB)
- Tonry & Schneider (1988) Tonry, J., & Schneider, D. P. 1988, AJ, 96, 807
- van der Kruit (1979) van der Kruit, P. C. 1979, A&AS, 38, 15
- van der Kruit & Searle (1981) van der Kruit, P. C., & Searle, L. 1981, A&A, 95, 105 (KS)
- Wild (1997) Wild, W. J. 1997, PASP, 109, 1269
- Willick et al. (1996) Willick, J. A., et al. 1996, ApJ, 457, 460
- Yan et al. (2000) Yan, H., et al. 2000, PASP, 112, 691
- Zheng et al. (1999) Zheng, Z. Y., et al. 1999, AJ, 117, 2757
- Zinn (1985) Zinn, R. 1985, ApJ, 293, 424
- Zhou et al. (2001) Zhou, X., et al., in preparation