Optical Surveys for Galaxy Clusters
Abstract
Optical surveys for galaxy clusters have been the major method for creating large cluster catalogs. We give a brief review of the history of optical searches of galaxy clusters, starting from that of Abell. The traditional application of this survey method suffers from contamination due to projection of galaxies along the line of sight, which becomes increasingly more severe at higher redshift. The new generation of wide-field CCD imagers has provided a renewed impetus for optical surveys for clusters. We describe a new cluster finding technique using the red sequence of early-type galaxies in galaxy groups and clusters, which eliminates the projection problem by essentially producing a 3-D distribution of red galaxies using two-filter imaging data. The Red-Sequence Cluster Survey (RCS) is a 100 square degree optical survey, carried out using 4m class telescopes, which is optimally designed to search for clusters at utilizing this technique. We present preliminary results which indicate that the RCS is extremely efficient in detecting galaxy clusters at these redshifts, including a number of clusters with multiple strong lensing arcs.
Department of Astronomy and Astrophysics, University of Toronto, Toronto, ON M5S 3H8, Canada
1. Introduction
Galaxy clusters have long played an important role in both the study of galaxy evolution and the determination of cosmological parameters. In the former, galaxy clusters offer a unique laboratory for investigating the relationship between galaxy formation and evolution and the environment; in the latter, the mass-to-light ratio and the evolution of the mass spectrum of clusters allow us to measure the mass density parameter, , and the amplitude of the perturbation spectrum, (Oukbir & Blanchard 1992). In both subjects, the leverage and advantage offered by having a sample with a large redshift coverage are clear. It is then somewhat surprising that until recently, the largest and most studied sample of galaxy clusters remains the Abell Catalog, which has few clusters at . The number of known high-redshift galaxy clusters, even just at , remains small, and very often were found either as the tail of the distribution of a systematic survey, or by serendipity.
This lack of well-defined, large, high-redshift samples is the result of the difficulties encountered at high redshift by the two major methods of cluster searches: the projection contamination problem in optical surveys, and the simple distance-induced decrease of apparent flux in X-ray searches. However, with recent advances in technology, we are poised at an era in which well-defined high-redshift galaxy cluster samples, to a redshift well above 1, will soon become available. This can be attributed to the recent launching of powerful X-ray telescopes, such as the XMM, the advent of large format CCD imagers on 4m class optical telescopes, and the building of a number of instruments in the millimeter wavelength regime which will allow for blank field searches of clusters via the Sunyaev-Zel’dovich effect.
This paper presents an abridged review of the methods and history for optical cluster surveys, including the latest development with excellent results in the detection of high-redshift clusters using optical imaging. We first present in Section 2 a brief summary of the three survey methods for finding clusters. In Section 3, we concentrate on optical survey methods and surveys from the time of the Abell cluster catalog and onward. In Sections 4 and 5 we describe a new technique of identifying clusters using two-band optical imaging data – the red-sequence method. We present in Section 6 preliminary results from a large survey we are carrying out using this method. We demonstrate that wide-field optical imaging combined with this new cluster search technique is the most efficient method of finding galaxy clusters.
2. Cluster Survey Methods
2.1. Optical
Finding galaxy clusters using optical images, naturally, was the first method utilized to create cluster catalogs. Galaxies are used as markers, and different methods of identifying over-densities on the projected sky have been applied to identify galaxy clusters. Some of these methods are summarized in Section 3. Finding clusters using optical images is generally considered to suffer from one major deficiency: the projection of galaxies along the line of sight producing contaminating signals in the search for over-dense regions in 3-D space. This projection effect becomes increasingly severe at higher and higher redshift, as the column of accumulated foreground galaxies renders the over-density produced by a galaxy cluster all but impossible to detect, except for the richest of clusters. The problem of projection contamination has caused optical searches to be considered as unreliable, and their selection functions difficult to quantify.
2.2. X-Ray
The detection of galaxy clusters in X-ray in 1966 (Boldt et al.) produced not only a new window into the study of properties and evolution of galaxy clusters, but also a new method for searching for clusters. X-ray detection provides a clean method. This is due to, firstly, that galaxy clusters are the second brightest extra-galactic X-ray sources on the sky, and can be recognized by the fact that they are resolved in moderate resolution. Secondly, their emissivity is proportional to , which reduces the detectability of poor clusters and groups of galaxies relative to the rich ones, making projection contamination a less important issue. (However, such projection contamination, while less severe than that found in the traditional optical searches, does exist; e.g., in a sample of X-ray strong Abell clusters, López-Cruz & Yee, 2001, find a projection rate of background clusters as high as 15%.) X-ray surveys with a large sky coverage, however, are expensive to carry out. Until recently, the largest and most utilized X-ray samples of clusters were created using clusters discovered serendipitously in images taken for other purposes (e.g., Gioia et al. 1990, Romer et al. 2000). However, with the new generation of X-ray telescopes, starting with ROSAT, and currently with XMM, significantly larger X-ray samples are becoming available. A recent review of these surveys can be found in Gioia (2000). Nevertheless, the current crop of surveys from ROSAT, still lack the depth to discover a significant sample of clusters.
2.3. The Sunyaev Zel’dovich Effect
The Sunyaev Zel’dovich (SZ, Sunyaev & Zel’dovich 1980) effect, produced by the scattering of the cosmic microwave background by the hot gas in clusters, can be used to search for galaxy clusters (see various papers in these proceedings). The SZ effect has the promise of being able to detect clusters at high redshifts, as the detectability for identical clusters is essentially redshift independent. However, at this point in time, most SZ work focuses on detecting known clusters, and no new cluster has been identified using this method. The technological challenge of doing large blank field surveys using the SZ effect is currently being worked out by a number of groups, such as AMiBA, using either close-spacing array telescopes or large bolometer arrays to achieve the necessarily field size.
3. A Review of Optical Cluster Surveys
3.1. Photographic Surveys
Systematic surveys for galaxy clusters began when the first major photographic survey of the sky, the Palomar Optical Sky Survey (POSS), became available. The Abell (1958) catalog of galaxy clusters, produced by visual examination of the POSS, is still the most studied catalog of galaxy clusters, more than 40 years after its compilation. Abell’s method of selecting clusters, although primitive due to the data available and the technology of the time, nevertheless, contains many important considerations that must go into selecting a fair cluster sample. These considerations also illustrate some of the difficulties that most optical cluster surveys face.
Abell used excess galaxy counts as the primary criterion for identifying galaxy clusters. These counts also form the basis for the Abell Richness Class which has been widely used as a rough indication of the richness of galaxy clusters. However, the statistics of galaxy counts are affected by the depth of sampling into the galaxy luminosity function (LF) and the counting radius around the putative cluster (see Yee & López-Cruz 1999 for a discussion of robust measurements of cluster richness). Both of these quantities require the knowledge of the redshift of the clusters. Abell attempted to circumvent these problems by counting galaxies to a depth of , where is the third brightest galaxy in the cluster, and within an angular radius inversely proportional to a redshift parameter (the “redshift class”) which he assigned to all candidates based on appearance. Clearly, this introduces a number of difficulties in that no quantitative magnitude measurements were made and that the estimate of redshift was necessarily very approximate. (We also note that counting limits based on a quantity such as in general produces a number of uncertainties: First, at higher redshift, it is subject to confusion by projection; and second, , being a random draw from a galaxy LF is a function of the richness of the cluster.) Nevertheless, Abell was able to by-and-large construct a sample of clusters that is essentially complete and well-defined out to . However, as many as 25% of the clusters may be significantly contaminated, or are simply the results of projections. Table 1 shows the rough characteristics of clusters of different Abell richness classes, with the velocity dispersion and mass estimates from clusters of similar richness from the CNOC1 cluster galaxy redshift survey (Carlberg et al. 1997).
| Abell 0 | Abell 1 | Abell 2 | Abell 3 | |
|---|---|---|---|---|
| 35–45 | 45–75 | 75–125 | 125–200 | |
| Number | 1224 | 383 | 6 | |
| (km s-1) | 600 | 750 | 950 | 1250 |
| Mass (10) | 2 | 4 | 9 | 15 |
Other cluster catalogs from photographic data are produced primarily by simple galaxy over-densities on the sky. These include the Zwicky catalog (Zwicky et al. 1968), also using the POSS, in which the clusters were identified using isopleths (contours of constant galaxy density). While projected over-density can be applied more objectively and is more suitable for computer automation, it produces catalogs whose completeness is strongly dependent on redshift, as clusters of identical richness at increasingly higher redshifts will have a lower over-density. Later surveys using photographic plates involved digitized images and computer algorithms. However, they all essentially still used projected over-density as the identification method. These include the Edinburgh-Durham survey (Lumsden et al, 1992) and the APM survey (Dalton et al. 1992), both based on UK Schmidt plates. The latter used a percolation analysis to identify clusters.
The first cluster survey amied specifically at identifying high-redshift clusters was the GHO survey (Gunn, Hoessel, & Oke 1986), which used photographic plates to identify possible high-redshift cluster candidates via large red central galaxies, and then to attempt to confirm the candidates using deep CCD images. However, it is difficult to assess the completeness of the sample, because of the unconventional method used to identify clusters.
3.2. Digital Image Surveys
Although digital imaging became available in the early 1980’s, the small field covered by the detectors then precluded their use for any substantial cluster survey. The largest survey available in the literature is the PDCS (Palomar Deep Cluster Survey, Postman et al. 1996) which used drift scan CCD images covering square degrees of sky. The data are relatively shallow, with a limit of . The PDCS also used a more modern cluster search technique: what is now termed the “matched filter” algorithm to try to reduce the effect of projection contamination.
A matched filter algorithm essentially attempts to use some known properties of clusters to assist in identifying true clusters. In the case of the PDCS, the luminosity function and the size of the clusters were used as the matching characteristics: i.e., over-densities with an angular size and distribution of galaxy brightness consistent with being a cluster at certain redshift are chosen as candidates. The survey identified 79 cluster candidates, including a number of them at . However, it appears that this method also suffers from significant projection contamination, as high as 25–30% (Oke et al. 1998; Holden et al. 2000). This is primarily due to the luminosity function of cluster galaxies not being a sharply defined function.
Dalcanton (1996) suggested a novel technique of identifying high-redshift clusters using optical data by looking for surface brightness fluctuations on the sky produced by high redshift clusters too far away to be well resolved and too faint to have individual galaxies detected. This method has the great advantage of allowing the search for high-redshift clusters using a small telescope; however, follow-up observations are required for confirmation, and the procedure is maximally subjected to projection effects. A detail description of this method, and some preliminary results can be found in Zaritsky et al. (2001) in this volume.
With the availability of wide-field mosaic CCD imager, currently there is a slew of large digital imaging surveys that can be used for cluster surveys, though none of them are specifically designed for that purpose. These include, in the 4m class, the NOAO Deep survey covering 18 square degrees, the NOAO cosmic shear weak lensing survey with a total planned coverage of 28 square degrees, the CFHT cosmic shear survey with an area of 12 square degree. The 10000 square degrees covered by the Sloan Digital Sky Survey will provide the most complete database for low-redshift clusters, with a completeness limit possibly somewhere between to 0.5. In the remainder of the paper, we will describe a new method for identifying galaxy clusters using optical data which specifically resolves the problem of projection. We will also present preliminary results from a large area survey based on this method that we are undertaking to produce a catalog of clusters up to

4. The Red-Sequence Method
We have developed a cluster finding method which uses a key signature of galaxies in clusters: the color-magnitude relation, or the red-sequence, of early-type galaxies in clusters. A detailed description of the cluster red sequence (CRS) method is given in Gladders & Yee (2000), and we present only a summary here.
The CRS method is motivated by the observation that all rich clusters have a population of early-type galaxies which follows a color-magnitude relation (CMR), an example of which is shown in Figure 1. The red sequence represents the nominal reddest galaxy population in any group of galaxies at the same redshift, producing a unique signature on the color-magnitude diagram (CMD). Furthermore, early-type galaxies dominate the bright end of the galaxy luminosity function (LF) and the core of clusters, or any region of high galaxy density (i.e., the morphology-density relation, see Dressler et al. 1997). Thus, by isolating galaxies of a specific region in the CMD (defined by the CMR of a specific redshift), one removes most of the galaxies accumulated in the redshift column. Figure 2 demonstrates the red sequence for the vs CMD.
By using successive slices of CMR on the color-magnitude plane one can effectively create a third dimension on the galaxy distribution based on the positions of the reddest galaxies at each redshift slice. Overdensities (in red galaxies) can then be identified on this three-dimensional space, selecting groups and clusters without projection contamination. Furthermore, the color slices can be translated into redshift slices via either galaxy evolution models (e.g, Kodama & Arimoto 1997) or empirically calibrated red-sequence colors, providing an accurate photometric redshift estimate using only two filters.
The exact implementation of the CRS method to data can vary; Gladders & Yee (2000) describe in detail such an implementation for testing the CRS method using the CNOC2 Field Galaxy Redshift Survey database (Yee et al. 2000). With the CNOC2 data, we are able to verify the photometrically detected galaxy groups and clusters using the redshift data. The test, using 1.5 square degrees of relatively shallow data in and (5 detection limits of 22.8 and 24.0, respectively), showed that we are able to detect galaxy groups to a mass equivalent to a velocity dispersion of 300 km/s out to (the redshift completeness limit of the CNOC2 redshift catalog). Furthermore, the photometrically estimated redshifts from the red sequence are accurate to an average of 0.028 (or 7% of the mean of the sample). We have also tested the CRS algorithm extensively using realistically simulated galaxy catalogs of field and cluster galaxies. These tests are described in Section 5 in conjunction with the presentation of the cluster survey we carried out using the red-sequence method.

5. The Red-Sequence Cluster Survey (RCS)
The efficacy of the red-sequence method, combined with the advent of large format CCD mosaic cameras, has motivated us to carry out an optical survey for high-redshift galaxy clusters. In this section we briefly describe the survey and some preliminary results.
5.1. Survey Design
The Red-Sequence Cluster Survey (RCS) is a 100 square degree imaging survey using mosaic CCD cameras on 4m-class telescopes, and is designed specifically to create a well-understood sample of galaxy clusters to a redshift well above one. To optimize sensitivity to high-redshift clusters we use as red a pair of filters as possible for optical imaging: (9200Å) and (6500Å). The filter allows the detection of galaxies at redward of the 4000Å break to redshift as high as 1.4. The survey is divided equally between the CFHT in the northern hemisphere using the CFH12k camera, and the CTIO 4m in the southern hemisphere using the MOSAIC2 camera. The former is a 12k 8k pixel camera with a scale of 0.206′′ per pixel, providing a field of view of 42′ 28′; while the latter is an 8k 8k pixel camera with a scale of 0.270′′ per pixel giving a field of view of 36 36 ′. We note that both field sizes are equivalent to approximately 1/3 square degrees in area.
The integration times are chosen to allow the detection of early-type galaxies out to a redshift of 1.4 assuming a passive evolution, and are relative short 15 and 20 minutes for and at CFHT, and 15 and 25 mins at CTIO, respectively. These integration times provide an 8 (100% completeness) level of , and a 5 limit in of 24.9.
The area covered by the survey is divided in a number of patches, each containing a mosaic of a number of pointings. The pointings are slightly overlapping (by about 20′′ to 30′′) to allow photometry and astrometry cross checks. For the northern survey at CFHT, each patch contains 35 pointings of the CFH12k camera, covering an area of approximately 2.12.3∘. For the southern CTIO patches, a mosaic of 34 pointing is used, providing a field size of approximately 1.82.4∘. A total of 10 patches are covered by the CFHT survey, while 12 patches are observed for the CTIO survey. Some of the patches are chosen to coincide with fields observed by other surveys. These include, for examples, the four patches of the CNOC2 Field Galaxy Survey (Yee et al. 2000), the Groth Strip, a field from the PDCS, and the XMM Large-Scale Structure Survey area. The remaining patches are chosen based on several criteria. They are well spaced in Right Ascension to allow flexibility in scheduling observation time. They have low Galactic extinction, and with galactic latitude between 45∘ and 65∘. The upper galactic latitude bound is applied to allow for sufficient number of reference stars for the use of star-galaxy classification. Fine adjustments are made in all patch placement to avoid bright stars using the USNO-2 catalog.
The observations are carried out without obtaining multiply dithered images. There are two reasons for this strategy. The first is simply due to the relatively short exposures, making dithering inefficient. Second, undithered images are inherently much easier to reduce, as a mosaic image can be simply treated as a series of individual 2k 4k images, without any need to combine the different chips into a single image. The small gaps between the chips will remain unfilled, but should have no effect on the detection of clusters, which should be many times the size of the gaps.
Currently (as of September 2001), the northern CFHT survey is completed, while the southern component at CTIO is about 75% complete. Additional and data from the CFH12k are being obtained to augment the photometric information for the northern survey.
5.2. Reduction and Analysis Pipelines
Efficient pipelines are set up to automatically (with visual check when necessary) process the images and carry out object finding, photometry and star-galaxy classification. The survey has an equivalent of a total of approximately 3000 2k 4k CCD images in two colors, with about 16 million detected objects.
Calibrated catalogs for each chip in and are produced using a modified version of the photometry package PPP (Yee 1991). The details for the algorithms and processes for object finding, photometry and classification can be found in Yee et al. (2000)
The individual catalogs are then astrometrically calibrated (using M67 for internal positional calibration, and the USNO-2 catalog for external calibration), and placed on the celestial co-ordinate system, creating catalogs of contiguous patches. The red-sequence cluster finding algorithm (see Gladders & Yee 2000) is then applied to these catalogs, locating over-density in the three dimensional space of x-y and redshift as determined by the red sequence color slices, creating lists of cluster candidates with estimated red sequence photometric redshifts.
5.3. Detectability and Completeness
We create realistic simulated galaxy catalogs of the sky mimicking the RCS survey to test the efficiency and selection characteristics of the cluster finding method. The simulations consist of realistic clusters embedded in field galaxy catalogs which fit currently-known observed photometric properties (magnitudes and colors) of galaxies down to and reproduce the known galaxy correlation function. A wide range of cluster properties are simulated, with the primary ones being redshift, richness, and blue galaxy fraction (). Figure 3 shows the detection probability of clusters of richness of Abell classes 1 and 2 with of 0.45 (typical of clusters). Similar results are obtained for simulated clusters with up to 0.8. This shows that the RCS is essentially complete for Abell class 1 out to a redshift of slightly greater than 1. Furthermore, the simulations indicate that the false-positive rate is low, about several per square degree, or given the expected number density, %, considerably smaller than conventional optical surveys, and likely to be superior or comparable to X-ray surveys.

5.4. Some Preliminary Results from the RCS
Currently we are in the process of refining the cluster-finding algorithm and the photometric calibration for the RCS. Preliminary catalogs show that many rich clusters at have been detected. In the following subsections, we show some of these results which demonstrate the great richness of investigations that can be carried out using this database.
Cluster Sample:
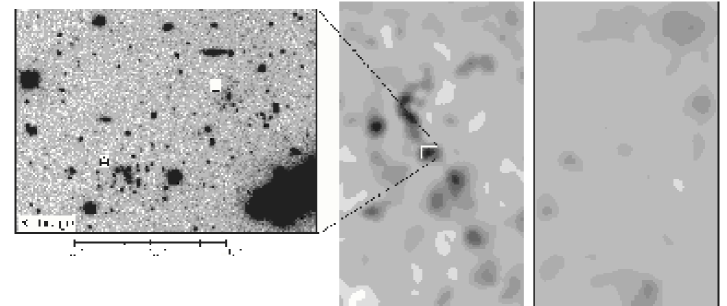
The RCS has been extremely efficient in detecting galaxy clusters. In the preliminary analysis, we have discovered a significant number of high-redshift clusters. Figure 4 demonstrates the effectiveness of the method. The right panel shows the smoothed surface density of total galaxy counts in an area of 1020′ in the patch RCS1620. The middle panel illustrates the galaxy density in a color slice equivalent to a red sequence at , where a significant amount of structure is detected. The left panel shows the gray scale image of the region of the density enhancement peak, revealing a rich, compact cluster at . Furthermore, the color-sliced galaxy density map shows a structure of enhanced red galaxy density covering a linear dimension of Mpc, possibly tracing out a large-scale filamentary structure.
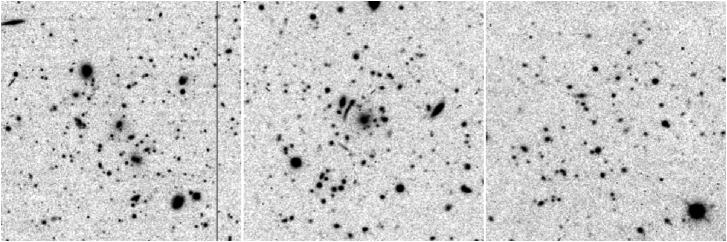
Preliminary statistics from two completely calibrated and analysed patches from the CFHT survey indicate that as many as 8000 galaxy groups and clusters between redshifts of 0.2 and 1.4 will be generated by the full RCS, with approximately 100 to 150 at . Figure 5 shows the number distribution of detected clusters as a function of redshift from the two patches. Figure 6 illustrates a small number of high-redshift rich clusters as examples of RCS detections.

The photometric data alone allow us to determine a number of physical properties of the cluster sample. Both the luminosity function of the cluster galaxies and the blue galaxy fraction of the clusters can be estimated using statistical methods by correcting for background counts. The mass can be estimated using the correlation between the richness parameter (Yee & López-Cruz, 1999) and velocity dispersion found in the CNOC1 cluster sample (Yee & Ellingson 2002). Using properly calibrated correlations and estimated selection functions of the survey via simulations, mass spectra of galaxy clusters can be derived over a range between 1014 (Abell 0) to 1015 solar masses from redshifts between 0.3 to 1.0, providing powerful constraints on the (,) parameter pair. Preliminary mass functions from two patches is reported in Gladders & Yee (2002).
Gravitational Arcs:
The RCS is designed to examine an unprecedented large volume of space at with sufficient depth to detect galaxy clusters. As a result, a number of interesting strong lensing arc systems have been discovered. These lensing systems in general have the lens redshift at to 0.8; and, due to the relatively shallow integration, very high surface brightness lensed arcs. A particularly interesting system at (spectroscopic redshift) is shown in Figure 7. This system has at least two large strong arcs at different redshifts (the first such system known). We have obtained VLT FORS spectra of the Arc C, finding a strong Ly emission line at . Careful analysis of the structure of the emission line along a curved slit indicates that the source has a velocity structure less than 50 km s-1 (Gladders, Yee, & Ellingson, 2002). Recent HST images show that Arc C is unresolved radially, with preliminary models indicating a large magnification of over 30. These data suggest that the source of Arc C is likely a single giant star forming region or a forming spheroid. The discovery of a large number of strong lensing clusters at can potentially provide powerful means of studying high-redshift forming galaxies.
Weak Gravitational Lensing:
Although the RCS was not designed for weak lensing analysis, the very large field coverage and the routine excellent image quality of the data (especially those from CFHT) allow us to perform a number of important investigations in this subject. Early results are summarized in Hoekstra, Yee, & Gladders (2001a, 2001b); these include a measurement of the cosmic shear, the bias parameter combined or decoupled from the stochasticity parameter, and the properties of galaxy halos.
6. Summary
Optical searches have been the primary and traditional method for creating large galaxy cluster catalogs. The problems encounted by early searches, which were based primarily on galaxy count over-densities on the projected sky, can be overcome by the use of color information, specifically in the form of using the red-sequence of early-type galaxies as a marker. This method essentially allows one to search for enhanced galaxy density in 3-D space, removing the projection contamination problem. The RCS has shown that such a method can produce a robust catalog of galaxy clusters down to a mass of using a relatively small amount of observational resources – relatively shallow two-filter imaging with ground-based 4m class telescopes. Recently, Donahue et al. (2001) demonstrated using a small area in the PDCS that optical search finds no evidence that optical selection misses any X-ray luminous clusters. Considering that to find clusters at requires the order of 104 second of integration and overhead time using the most powerful X-ray telescope (XMM), wide-field optical cluster search is an extremely efficient and effective method for creating well-defined and well-understood high-redshift galaxy cluster catalogs.
References
Abell, G. 1958, ApJS, 3, 211
Boldt, E., McDonald, F.B., Riegler, G., & Serlernitsos, P. 1966, Phys. Rev. Let. 21, 301
Dalcanton, J.J. 1996, ApJ, 466, 92
Dalton, G.B., Efstathiou, G., Maddox, S.J., & Southerland, W.J. 1992, ApJ, 390, L1
Donahue, M., et al. 2001, ApJ, 552, L93
Dressler, A., et al. 1997, ApJ, 490, 577
Gioia, I.M. et al. 1990, ApJS, 72, 567
Gioia, I.M. 2000, astro-ph/0010059
Gladders, M.D., López-Cruz, O., Yee, H.K.C., & Kodama, T. 1998, ApJ, 501, 571
Gladders, M.D. & Yee, H.K.C. 2000, AJ, 120, 2148
Gladders, M.D., Yee, H.K.C., & Ellingson, E. 2002, AJ, in press
Gladders, M.D. & Yee, H.K.C. 2002, in preparation
Gunn, J.E., Hoessel, J.G., & Oke, J.B. 1986, ApJ, 306, 30
Hoekstra, H., Yee, H.K.C., & Gladders, M.G. 2000a, in the STScI 2001 Spring Symposium Dark Universe, astro-ph/0106388
Hoekstra, H., Yee, H.K.C., & Gladders, M.G. 2001b, ApJ, 558, L11
Holden, B.P., et al. 2000, AJ, 120, 23
Kodama, T. & Arimoto, N. 1997, A&A, 320, 41
Lumsden, S.L., Nichol, R.C., Collins, C.A., & Guzzo, L. 1992, MNRAS, 258, 1
Oke, J.B., Postman, M., & Lubin, L.M. 1998, AJ, 116, 549
Oukbir, J. & Blanchard, A. 1992, A&A, 262, L21
Postman, M., et al. 1996, AJ, 111, 615
Romer, A.K. et al. 2000, ApJS, 126, 209
Sunyaev, R.A. & Zel’dovich, I.B. 1980, ARAA, 18, 537
Yee, H.K.C. 1991, PASA, 103, 396
Yee, H.K.C. & López-Cruz, O. 1999, AJ, 117, 1985
Yee, H.K.C. et al. 2000, ApJS, 129, 475
Yee, H.K.C. & Ellingson, E. 2002, in preparation
Zaritsky, D., Gonzalez, A.H., Nelson, A., & Dalcanton, J.J. 2001, in these proceedings, astro-ph/0107542
Zwicky, F., Herzog, E., & Wild, P. 1968, Catalogue of galaxies and of clusters of galaxies, Pasadena, California Inst. of Technology (1961-1968)