SIGMA Observations of the Bursting Pulsar GRO J1744-28
Abstract
We present the results of the GRANAT/SIGMA hard X-/soft -ray long-term monitoring of the Galactic Center (GC) region concerning the source GRO J1744-28, discovered on 1995 Dec. 2 by CGRO/BATSE. SIGMA observed the region containing the source in 14 opportunities between 1990 and 1997. In two of these observing sessions, corresponding to March 1996 and March 1997, GRO J1744-28 was detected with a confidence level greater than 5 in the 35-75 keV energy band without detection in the 75-150 keV energy band. For the other sessions, upper limits of the flux are indicated. The particular imaging capabilities of the SIGMA telescope allow us to identify, specifically, the source position in the very crowded GC region, giving us a mean flux of (73.15.5)10-11 and (44.76.4)10-11 ergs cm-2 s-1 in the 35-75 keV energy band, for the March 1996 and March 1997 observing sessions, respectively. Combining the March 1997 SIGMA and BATSE observations, we found evidence pointing to the type-II nature of the source bursts for this period. For the same observing campaigns, spectra were obtained in the 35 to 150 keV energy band. The best fit corresponds to an optically thin thermal Bremsstrahlung with F50keV=3.6(0.6)10-4 phot cm-2 s-1 keV-1 and kTBremss=287 keV, for the first campaign, and F50keV=2.3(0.7)10-4 phot cm-2 s-1 keV-1 and kTBremss=18 keV, for the second. This kind of soft spectrum is typical of binary sources containing a neutron star as the compact object, in contrast to the harder spectra typical of systems containing a black hole candidate.
1 INTRODUCTION
GRO J1744-28, the bursting pulsar, was discovered on 1995 December 2 by CGRO/ BATSE (Fishman et al., 1995; Kouveliotou et al., 1996). Timing studies revealed a period of 0.467 s in the persistent flux and an 11.8-day orbital period (Finger, Wilson, and van Paradijs, 1996). This source presented two strong outbursts: at the end of 1995 and early 1996, and then almost a year later. At that time, this was the only source known to show, simultaneously, periodic X-ray pulsations and frequent X-ray bursts. The presence of pulsations indicates that the compact object is a neutron star. The X-ray mass function, determined by Finger, Wilson, and van Paradijs (1996) as being f(Mx)=1.3110-4 M⊙, together with a mass canonical value for the compact object of 1.4 M⊙, suggest that the neutron star in GRO J1744-28 is being fed by Roche lobe overflow from a low-mass red giant (Daumerie et al., 1996; Miller, 1996; Sturner and Dermer, 1996; Bildsten and Brown, 1997).
The best position coordinates for the source are those obtained from triangulation of the Ulysses and BATSE observations of the region. With this method, Hurley et al. (2000) determined the coordinates RA=17h44m32s, decl.=-28∘44317 (J2000.0). A possible infrared counterpart was reported by Augusteijn et al. (1996) while a posterior optical/IR observation of the same region by Cole et al. (1997) neither confirmed nor discarded this IR counterpart. Based on the ASCA data, the absorption column, NH, for the position of GRO J1744-28 was determined as being (5-6)1022 cm-2, independent of the emission date and phase and, therefore, corresponding to interstellar absorption (Dotani et al., 1996; Nishiuchi et al., 1999). This suggests that the source is located near the Galactic Center (GC), at a distance of 8.0 kpc. The source was also observed with GRANAT/WATCH from January 13 to March 12, 1996 (Sazonov, Sunyaev, and Lund, 1997) showing, at the maximum between bursts, a daily average flux of 3.7 Crab, in the 8-20 keV energy band.
Between 1990 and 1997, the SIGMA telescope was pointed in the direction of the GC region two times per year, in the March-April and September-October periods. In 14 opportunities, the region containing GRO J1744-28 was observed, for a total of 2993 hours. In two of these sessions, corresponding to March 1996 and March 1997, the source was clearly visible, with a confidence level higher than 5. In this paper, the analysis of these observations is presented. Also, upper limits are reported for the remaining observing sessions. Finally, for the March 1997 observing session, a combination of the SIGMA value for the integrated flux of the source with the BATSE value for the burst mean flux allows us to obtain evidence favouring the type-II nature of the bursts, due to spasmodic accretion rather than thermonuclear burning of matter.
2 THE SIGMA TELESCOPE
The French coded-mask telescope SIGMA (Paul et al., 1991) onboard the Russian GRANAT orbital observatory provides high resolution images in the hard X-/soft -ray band from 35 keV to 1300 keV, divided in 95 energy channels. The nominal angular resolution of the instrument is 15 arcmin. The position determination accuracy of the instrument is 3-5 arcmin for a 6 source and 1 arcmin for a 30 one. The fully coded field of view of the instrument is a 4∘.7 x 4∘.3 rectangle while the half sensitivity boundary of the field of view corresponds to an 11∘.5 x 10∘.9 rectangle. The energy resolution of the instrument at 511 keV is 8. The typical duration of individual observing sessions is 20 hours, that provides a 1 sensitivity of 20 mCrab in the 35-150 keV energy domain. For details on the SIGMA in-orbit performances, see Bouchet et al. (2001).
3 THE OBSERVATIONS
The region containing the source GRO J1744-28 was observed by SIGMA in 14 different opportunities, from 1990 to 1997. In two of these observing campaigns, the source was clearly detected in the 35-75 keV energy band, with a confidence level higher than 5, as shown in Figure 1. In contrast, the source was not detected in the 75-150 keV energy band. The first campaign began on 1996, March 15 (MJD 50157.63), 103 days after the discovery of the source by BATSE, and lasted until March 30, corresponding to 267 hours of effective observing time (see Table 1). In this period, GRO J1744-28 appears as a 13.5 source with a mean detected flux in the 35-75 keV energy band of 856.4 mCrab (7.3(0.6)10-10 ergs cm-2 s-1), showing a soft spectrum that can be approximated by an optically thin thermal Bremsstrahlung model (=-1.4) with a flux at 50 keV of F50keV= 3.6(0.6)10-4 phot cm-2 s-1 keV-1 and kTBremss=287 keV ((d.o.f.)=13.0(8)).
The second campaign began on 1997, March 14 (MJD 50521.31) and last until March 28, corresponding to an effective observational time of 148.5 hours. In this opportunity, the mean flux of the source in the 35-75 keV energy band was of 527.4 mCrab (4.5(0.6)10-10 ergs cm-2 s-1), corresponding to a confidence level of 8. The source showed a very steep spectrum fitting with an optically thin thermal Bremsstrahlung model with a F50keV=2.3(0.7)10-4 phot cm-2 s-1 keV-1 and kTBremss=18 keV ((d.o.f.) = 8.04(8)). In Table 1, the values of the fluxes corresponding to each one of the sessions of these two campaigns in the 35-75 keV and 75-150 keV energy bands are indicated.
4 THE LIGHT CURVE AND SPECTRA OF GRO J1744-28
In Figure 2, the light curves of the source GRO J1744-28 for the campaigns corresponding to March 1996 and March 1997 are presented. In the first campaign, the source flux in the 35-75 keV energy band was almost constant with an average flux of 85 mCrab or 7.310-10 ergs cm-2 s-1. The second campaign does not show significant flux variations; the average flux being 52 mCrab or 4.510-10 ergs cm-2 s-1 (see also Trudolyubov et al. (1999). This last value is a factor 7 lower than that reported by Woods et al. (1999) of 310-9 ergs cm-2 s-1, as taken from the BATSE observations of the source using the Earth-occultation technique in the 30 to 100 keV energy band.
Since GRO J1744-28 is located near the GC, it was within the SIGMA field of view during all the observations constituting the GC survey conducted by SIGMA between 1990 and 1997, which allows us to estimate upper limits for the hard X-ray flux from the source position before and after the 1996 and 1997 outbursts. An analysis of these SIGMA observations was done in order to verify the possibility of source appearances in other epochs than that corresponding to the two outbursts on 1996 and 1997. In Figure 3, the light curve of the source is shown, corresponding to all the pointed SIGMA observations of the GC region containing the source, in the 35-75 keV energy band. The resulting 3 upper limit for the average source flux during each campaign is 17 mCrab (1.510-10 ergs cm-2 s-1) varying between 9 and 24 mCrab, with an integrated upper limit of 5 mCrab (4.310-11 ergs cm-2 s-1).
As said previously, for the two observing sessions in which GRO J1744-28 was detected, this source presented a very steep spectrum, reasonably well fitted with an optically thin thermal Bremsstrahlung model, as given by the expression
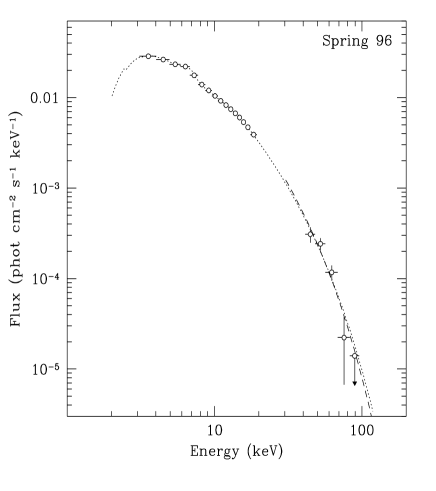
In order to have a better coverage of the spectral behaviour of the source, we also analyzed the RXTE archival data obtained on 1996 March 22 and 1997 March 18. The source was very bright during RXTE/PCA observations, therefore any possible contamination by the other sources in the PCA’s field of view is negligible. The PCA data reduction was performed with the help of standard tools from LHEASOFT/FTOOLS 5.0.4 package. Both RXTE/PCA and GRANAT/SIGMA spectra were approximated by a model which is typical for pulsars: power law with high-energy cutoff, Gaussian line and photoabsorption. The pure statistical significance of SIGMA data is much less than that of RXTE/PCA. Because of this, the SIGMA spectral points almost do not influence on the parameters of the combined PCA+SIGMA spectral approximation. In order to make the spectral fit more sensitive to the SIGMA data, we artificially increased the uncertainties of the PCA spectral points to the value 5%. The best fit parameters of the combined PCA+SIGMA spectral fits are (for 1996/1997): photon index of the power law =1.440.12/1.410.07; EHcutoff=14.70.7/16.40.9. In Figure 4 we plot the 1 to 100 keV PCA/SIGMA spectrum corresponding to the March 1996 and March 1997 SIGMA observing periods, along with the SIGMA spectral fit.
Our result for the second outburst is compatible with the analysis of the same event of the source made on the BATSE data and presented by Woods et al. (1999). For the epoch of the SIGMA observation, they report a temperature kT 14.51.8 keV for the persistent emission (see Figure 4, therein). However, as it will be shown later, there exists the possibility of a contamination of the BATSE data because of the presence of a transient source in the neighbourhood of GRO J1744-28, namely GRS 1737-31.
5 CONCLUSION
In the period going from 1990 to 1997, observations of the GC region containing the coordinates of GRO J1744-28 were made with the SIGMA telescope in 14 opportunities, in March-April and September-October each year. In two of these opportunities, corresponding to March 1996 and March 1997, GRO J1744-28 was clearly detected well above the 5 flux limit, corresponding to the two outbursts detected by several other instruments.
The mean fluxes for these two observations, as seen by SIGMA in the 35-75 keV energy band, were 85 and 52 mCrab. In the 75-150 keV energy band, the source was not detected. The spectra were reasonably well fitted by optically thin thermal Bremsstrahlung with kTBremss=28 and 18 keV respectively. These values are compatible with that presented by Woods et al. (1999) for the second burst. However, the flux seen by SIGMA during this second observation campaign is almost a factor 7 smaller than that based on the BATSE observations of the region using the Earth-occultation technique. In this epoch, the transient source GRS 1737-31 was discovered with SIGMA (Sunyaev et al., 1997) and observed by RXTE and BeppoSAX/WFC (Marshall and Smith, 1997; Cui et al., 1997; Heise, 1997). This source was active for a period of at least 1 month beginning on middle February, 1997, in the 35-150 keV energy band, as reported by Trudolyubov et al. (1999). We argue that the presence of this source may explain, at least partially, the different flux values obtained with BATSE and SIGMA for the bursting pulsar. For GRS 1737-31, Trudolyubov et al. (1999) have found a flux of 100 mCrab (1.610-9 ergs cm-2 s-1) in the 35-150 keV which, added to the GRO J1744-28 flux (4.510-10 ergs cm-2 s-1), accounts for a representative part of the flux reported from BATSE. It is important to note that the use of coded mask imaging techniques, like that used by SIGMA and other instruments of this kind, allows us to obtain in an unambiguous way the integrated flux and spectrum of the sources even in very crowded fields as in the case of the GC region.
With regard to the nature of the bursts, several authors have proposed that they are type-II bursts (see, for instance, Lewin, Rutledge and Kommers 1996 for the first outburst). In their Figure 6, Woods et al. (1999) have shown that the parameter alpha, the ratio between the persistent flux and the average burst flux taken over the time interval since the previous burst, displayed for almost all the BATSE observations of the second outburst a value greater than 20, which suggests that they are due to thermonuclear burning rather than spasmodic accretion (type-I bursts rather than type-II). However, if we consider the value of the flux obtained from the SIGMA observations as the sum of the persistent and the burst flux, and the value of the burst flux from the BATSE data, the value of alpha for the period of the observation is of the order of the 10, more consistent with the type-II nature of the bursts, as indicated by Lewin, van Paradijs, and Taam (1995). Once again, the difference could be due to a possible contamination of the BATSE data by GRS 1737-31.
References
- Augusteijn et al. (1996) Augusteijn, T. et al. 1996, IAU Circ. 6369
- Bildsten and Brown (1997) Bildsten, L., and Brown, E. F. 1997, ApJ, 477, 897
- Bouchet et al. (2001) Bouchet, L. et al. 2001, ApJ, 548, 990
- Cole et al. (1997) Cole, D.M. et al. 1997, ApJ, 480, 377
- Cui et al. (1997) Cui, W. et al. 1997, IAU Circ. 6604
- Daumerie et al. (1996) Daumerie, P.R. et al. 1996, Nature, 382, 141
- Dotani et al. (1996) Dotani, T. et al. 1996, IAU Circ. 6337
- Fishman et al. (1995) Fishman, G.J. et al. 1995, IAU Circ. 6272
- Finger, Wilson, and van Paradijs (1996) Finger, G.J., Wilson, R.B., and van Paradijs, J. 1996, IAU Circ. 6286
- Heise (1997) Heise, J. 1997, IAU Circ. 6606
- Kouveliotou et al. (1996) Kouveliotou, C. et al. 1996, IAU Circ 6369
- Hurley et al. (2000) Hurley, K. et al. 2000, ApJ, 537, 953
- Lewin, Rutledge, and Kommers (1996) Lewin, W., Rutledge, R., and Kommers, J. 1996, ApJ, 462, L39
- Lewin, van Paradijs, and Taam (1995) Lewin, W., van Paradijs, J., and Taam, R. 1995, X-Ray Binaries, W. Lewin, J. van Paradijs, and E. van de Heuvel, Cambridge: Cambridge Univ., 196
- Marshall and Smith (1997) Marshall, F.E., and Smith, D.M. 1997, IAU Circ. 6603
- Miller (1996) Miller, G.S. 1996, ApJ, 468, L29
- Nishiuchi et al. (1999) Nishiuchi, M. et al. 1999, ApJ, 517, 436
- Paul et al. (1991) Paul, J. et al. 1991, Adv. Space Res., 11, 289
- Sazonov, Sunyaev, and Lund (1997) Sazonov, S.Y., Sunyaev, R.A., and Lund, N. 1997, Astron. Lett., 23, 286
- Sturner and Dermer (1996) Sturner, S.J., Dermer, C.D. 1996, ApJ, 465, L31
- Sunyaev et al. (1997) Sunyaev, R. et al. 1997, IAU Circ. 6599
- Trudolyubov et al. (1999) Trudolyubov, S. et al. 1999, AA, 342, 496
- Woods et al. (1999) Woods, P.M. et al. 1999, ApJ, 517, 431


1 mCrab corresponds to 1.0810-4 and 4.410-5 photons cm-2 s-1 (8.610-12 and 7.310-12 ergs cm-2 s-1) for the 35-75 keV and 75-150 keV bands respectively.