On the detectability of distant Compton-thick obscured quasars
Abstract
Chandra and XMM–Newton have resolved the 2–8 keV X-ray Background (XRB) into point sources. Many of the fainter sources are obscured active galactic nuclei (AGN) with column densities in the range of some of which have quasar-like luminosities. According to obscuration models, the XRB above 8 keV is dominated by emission from Compton-thick AGN, with column densities exceeding . Here, we consider whether Compton-thick quasars are detectable by Chandra and XMM–Newton by their direct (i.e. not scattered) X-ray emission. Detectability is optimized if the objects individually have a high luminosity and high redshift, so that the direct emission has a significant flux in the observed band. Using a simple galaxy formation model incorporating accreting black holes, in which quasars build most of their mass in a Compton-thick manner before expelling the obscuring matter, we predict that moderately deep 100 ks Chandra and XMM–Newton exposures may contain a handful of detectable Compton-thick quasars. Deep Ms or more Chandra images should contain 50–100 distant, optically-faint, Compton-thick sources. In passing we show that radiation pressure can be as effective in expelling the obscuring gas as quasars winds, and yields a black hole mass proportional to the velocity dispersion of the host bulge to the fourth power.
keywords:
galaxies:active – quasars:general –galaxies:Seyfert – infrared:galaxies – X-rays:general1 Introduction
Most of the 0.5–2 keV soft X-ray Background (XRB) has been resolved by ROSAT (Hasinger et al 1999; Lehmann et al 2001) and recently most of the harder 2–7 keV XRB has been resolved by Chandra (Mushotzky et al 2000; Giacconi et al 2001; Barger et al 2001; Brandt et al 2001) and XMM (Hasinger et al 2001). The source identifications are incomplete at the present time but indicate that about one third of the sources are associated with normal quasars, another third with optically-bright galaxies and the last third with optically-faint galaxies (Mushotzky et al 2000; Barger et al 2000; Alexander et al 2001). X-ray hardness ratios indicate that the fainter sources are generally harder and consistent with absorbed sources. This confirms obscuration models for the XRB (Setti & Woltjer 1989; Madau, Ghisellini & Fabian 1994; Comastri et al 1995; Gilli, Salvati & Hasinger 2001).
Detailed studies, including X-ray spectroscopy of the brighter sources (e.g. Crawford et al 2001) have however shown that the column densities of absorbing material lie in the range of to a few times . Such columns are insufficient to produce the peak in the XRB at about 30 keV (Marshall et al 1982). In order to match this peak, sources with columns exceeding are required, i.e. sources which are Compton thick.
Here we address this issue and ask whether such sources should have been observed in Chandra and XMM images, and whether their apparent absence indicates a problem for the obscuration model of the XRB. Compton-thick sources are certainly found in the local Universe, with two of the nearest active galactic nuclei (AGN), the Circinus galaxy and NGC4945 (Matt et al 2000, and references therein) being in this class. Good examples of powerful Compton-thick AGN are NGC6240 (Vignati et al 1999) which is at low redshift and IRAS 09104+4109 which is at redshift (Franceschini et al 2000; Iwasawa et al 2001). The main issue is whether Compton-thick quasars are common.
Sources which are mildly Compton-thick () show direct emission peaking above 10 keV. When they are heavily Compton thick (, this emission peak is down-scattered by Compton recoil and is therefore highly degraded. How much is seen in the 2–8 keV band from low redshift Compton-thick objects depends almost completely on how much emission is scattered into our line of sight. For example, the direct line of sight to the well-known obscured AGN NGC 1068 has a column density exceeding (Matt et al 1997), the X-ray emission seen is all scattered flux. The hyperluminous IRAS galaxy F15307, known to host a quasar from observed scattered (polarised) optical broad lines, shows no X-ray flux detectable by ASCA and ROSAT (Ogasaka et al 1997; Fabian et al 1996). The difference between these sources is probably determined by the geometry of the obscuring medium, which may be torus-like in the case of NGC 1068 and more spherical for F15307. Since synthesis models for the XRB spectrum indicate that most (85 per cent) of the AGN power is absorbed (Fabian & Iwasawa 1999), a spherical geometry is more likely to be relevant to the sources dominating the hard XRB than a torus one. The scattered flux fraction is likely to be small. It is the absorbed direct flux which we are interested in here.
Redshift does help to shift so render mildly Compton-thick quasars detectable, leading to an inverse K-correction effect (Wilman & Fabian 1999). However the sources still need to be luminous to be detectable. For the spectrum of the XRB, it is the mildly Compton-thick objects which dominate at the XRB peak. The lowest redshift members of the Compton-thick class contribute most to the highest energy part of that peak.
To assess whether Compton-thick quasars ought to be detected, we have taken one simple obscured AGN model for the XRB (from Wilman, Fabian & Nulsen 2000; WFN), and predicted the number of Compton-thick sources expected per square degree. We have then passed the predicted spectra through the response curves of Chandra and XMM to predict the number expected to be detected. Our results indicate that some Compton-thick sources should be detectable, particularly in the Chandra 1 Ms images (Alexander et al 2001; Rosati et al 2001). Chandra does not have the collecting area above 8 keV to detect such hard sources readily; XMM has too much internal background (relevant because of its much larger PSF) at those energies. There may yet be renewed claims to resolve the XRB when distant Compton-thick sources are finally found in reasonable numbers. We argue that our results are not strongly dependent on the model adopted.
2 The WFN model
For the sake of completeness, we provide here an outline of the WFN model. At its heart is the semi-analytic galaxy formation code developed by Nulsen & Fabian (1995), in which the Cole & Kaiser (1988) block model is used to simulate the hierachical growth of clustering, and the scheme of Nulsen & Fabian (1995) is used to treat the behaviour of the gas within a collapsed halo. In short, gas within a radius , where the free-fall time is less than the cooling time, rapidly forms stars, producing supernovae which can then expel some (for normal galaxies) or all (in the case of dwarf galaxies) of the remaining gas from the system. Any gas at participates in a cooling flow (CF). Newly formed normal galaxies are ellipticals unless all the hot gas is able to cool before the present or the next hierarchical collapse, in which case they are spirals. Any collapse with at most one infalling normal galaxy forms a normal galaxy, with the stars of dwarf galaxies contributing to the spheroid of the new system. Collapses with more than one normal galaxy form a group or a cluster, as mergers between normal galaxies are ignored.
Each of the smallest block model units contains a seed black hole of mass , and when a block collapses all the black holes associated with its merging subblocks are assumed to merge into a single black hole at the centre of the new galaxy. Such nuclear black holes are then fed by Bondi accretion of hot gas from the cooling flow atmospheres which surround them, in accordance with the model of Nulsen & Fabian (2000). Whilst thus accreting, the black hole is assumed to radiate with an efficiency of 10 per cent, with a 2-10 keV luminosity equal to 3 per cent of the bolometric one, with a power law plus reflection spectrum. This intrinsic spectrum is then absorbed by the isothermal distribution of cold dusty clouds deposited by the cooling flow, as suggested by Fabian (1999). The accretion is terminated by wind-driven gas expulsion when the mass of the black hole reaches a critical fraction of that in the surrounding spheroid, thereby accounting for the observed correlation between the mass of the remnant black hole and its host spheroid. Thereafter the object shines as an optical quasar for yr. For full details of the model, see WFN.
2.1 Wind or radiation pressure?
The critical mass of the black hole was determined by invoking a wind from the central engine (Fabian 1999; see also Silk & Rees 1998 who use an energy argument rather than the force one used here). We note here that the radiation pressure of the absorbed radiation alone yields a similar limit (i.e. if the force due to the radiation , where the absorbed power ).
To pursue this in detail, we adopt the scenario of Fabian (1999), where a fraction of the mass in the core of an isothermal galaxy is in cold, X-ray absorbing gas. The gas within radius has been accreted into a black hole of mass leaving a column density beyond. Rearranging these formulae means that
Much of the radiation from the black hole is absorbed by the gas beyond giving rise to a force on the column of where accounts for how much the matter traps and reradiates the energy. for an isolated cloud but may be several for the envisaged optically-thick cloud surrounding the nucleus. Then at the limit where the outward force due to radiation balances the inward gravitational force on the column,
(The formula assumes that the column is all at one radius; if it extends to then a factor of enters into the inward force expression.)
Let where is the Thomson cross section. Then
Substituting this into the above black hole mass formula then gives
or
This is the mass of the black hole when the gas (which fuels it) is blown away. The normalization changes slightly, by losing a factor of if is redefined as the Bondi accretion radius (as in WFN) for gas at the galaxy virial temperature.
It compares well with the results of Ferrarese & Merritt (2000) and Gebhardt et al (2000) for reasonable values of and :
The above result demonstrates that a wind is not essential for expelling the gas surrounding a growing black hole.
In the present model it appears more as if the galaxy potential determines the black hole mass, rather than the other way round. Note however that the gravitational binding energy of a galactic bulge, where the velocity dispersion of the bulge is is . The energy from the central black hole . So only one per cent of that energy can have a major effect on the formation of that bulge and that effect may have occurred when both the black hole and galaxy were young.
3 The yield of Compton-thick sources
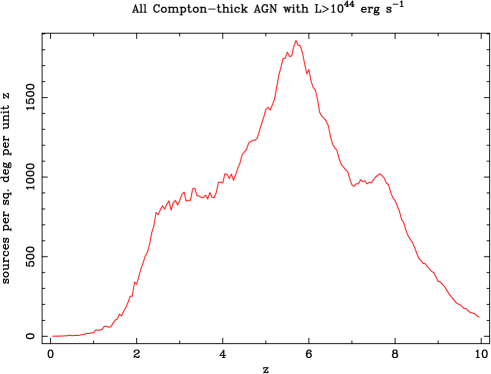
For the above model with the free parameters set to the values given in section 3 of WFN, we present in Figs. 1–4 results on the yield of Compton-thick quasars in deep exposures with Chandra and XMM. Firstly, Fig. 1 shows as a function of redshift the total areal density of Compton-thick AGN in the model with intrinsic 2–10 keV luminosities in excess of . As discussed by WFN, however, such sources are obscured by when the obscured phase begins (where , the column density above which a source becomes Compton-thick), and by at its end. Since there is no scattered flux included in the model spectra and the direct emission is almost completely suppressed for (especially below 10 keV), the vast majority of the sources contributing to Fig. 1 will not be visible to Chandra or XMM. This is borne out by Figs. 2, 3 and 4, described below, which were produced by convolving the object spectra in the observed frame with ‘response functions’ giving the effective area of the telescope and detector combination under consideration.
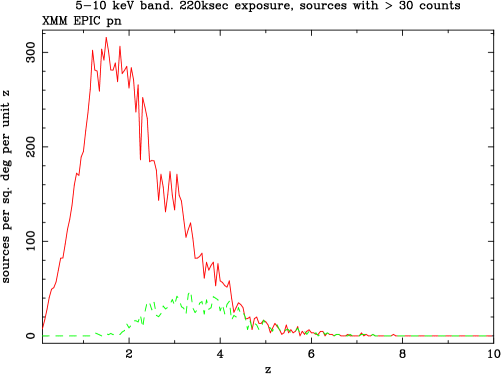
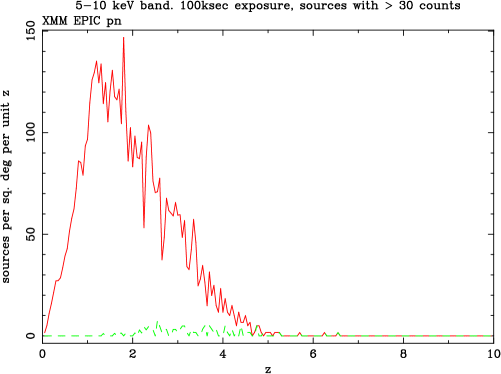
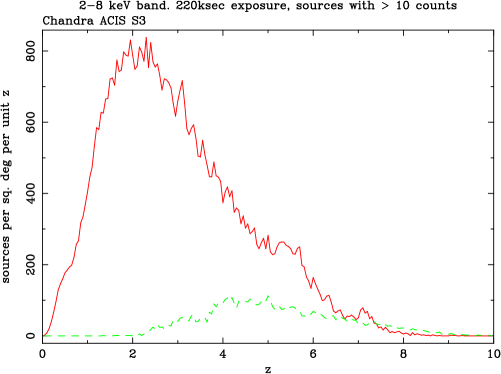
In Fig. 2 we show the areal density as a function of redshift of both the Compton-thick and Compton-thin AGN (the latter also includes the unobscured quasars), which would produce more than 30 counts in the 5–10 keV band in a 220 ks exposure with XMM on the EPIC pn chip. This is repeated in Fig. 3 for a 100 ks exposure. Fig. 4 shows the analogous plot for the 2–8 keV band with the Chandra ACIS S3 chip, with the count threshold reduced to 10 counts owing to the smaller PSF (and thus lower internal background) compared to XMM. The majority of the detected objects contributing to the yields are quite close to the count thresholds. For example, if the XMM threshold is increased to 40 counts, the yield of Compton-thick (Compton-thin plus unobscured) AGN falls over all redshift by a factor 2–3 (1.5–2). Similarly, increasing the Chandra detection threshold to 15 counts, results in a fall by a factor of 2.5 in the yield of Compton-thick objects, whilst the number of Compton-thin and unobscured objects are relatively unchanged.
Most of the predicted Compton-thick sources should become detectable in exposures of 1Ms (Fig. 5), such as are now being done with Chandra (e.g. Alexander et al 2001; Rosati et al 2001). In an arcmin2 region and 1 Ms exposure we predict 182 sources (Compton thick and thin) in the 2–8 keV band whereas Alexander et al (2001) find 102. We do not consider that this discrepancy in numbers is serious, since most of the sources would be close to the detection threshold. That many of the sources are seen in both soft and hard energy bands (Alexander et al 2001) is also not a major problem since a few per cent of the primary soft radiation may be scattered into our line of sight.
The important issue of the redshift distribution of the sources is considered in the next Section. where we also discuss the implications of these results for the interpretation of deep Chandra and XMM surveys.

4 Discussion
We see that the surface density of Compton-thick sources expected in a 220 ks exposure (equal in length to the initial Chandra observation of the HDF-N and its vicinity by Hornschemeier et al. 2001) with Chandra ACIS chip is about 200. A chip is arcmin or 0.0178 sq deg which means that 3–4 faint hard sources are expected in such an exposure. If the ACIS-I array is use, with 4 times the area, then the number rises to about 10 (given the degradation of sensitivity off axis: most of the photons detected are above 6 keV). The sources have redshifts of 3–7 and are basically detectable because of the inverse K-correction. Most of the Compton-thick above become detectable in deeper exposures of 1 Ms.
In an XMM pn chip exposure of similar duration, concentrating on the 5–10 keV band, we have about 40 sources detected per square degree, mostly in the redshift range of 2–5. The field of view is about 0.2 sq deg (30 arcmin diameter) leading to about 8 sources detected per 220 ks exposure, similar to the yield from Chandra. Source confusion should not be a problem at such high photon energies.
The adopted WFN model thus predicts that the direct absorbed emission from some Compton-thick quasars is detectable by Chandra and XMM with similar yields. The absorbed primary emission from these sources will be very hard and most will be detected close to the threshold for detection (10 counts for Chandra, 30 for XMM), as discussed in section 2.1. Scattered emission may however allow the sources to be detected also in softer energy bands. The appearance of such objects in the optical and near infrared bands depends on the rate of star formation. If this rate is low then they should appear as redshifted early-type bulges, without strong emission lines, and if high they will be brighter and of much later spectral type, probably with emission lines.
So far only one source with a spectrum consistent with being Compton thick has been reported (Norman et al 2001); its redshift . The observed X-ray emission in this case is not the absorbed direct radiation but a reflected component. Only a guess can be made as to the power of the direct component. It is this direct absorbed component of such sources which is important for the spectral peak of the XRB.
Our model predicts that more than half the sources detected in a Ms exposure with Chandra will have redshifts ranging from 2–8. Most of them would have band magnitudes exceeding 24, i.e. are optically faint according to the definition of Alexander et al (2001). The precise magnitudes would depend upon the star formation rate in the host galaxy. If we assume that the obscured black hole growth phase coincides with the major star formation phase in the galaxy, then the star formation rate must be tens . Then the (and approximately ) magnitude of the hosts will be about 24 for objects at (e.g. Pettini et al 2001). Objects at will be about 1.5 mag fainter. Alexander et al (2001) have 47 objects fainter than (15 with ), which is about half the number we predict.
At this stage we consider that our model remains viable, with a factor of two in number densities arrangeable by a small alteration of some of the parameters (e.g. the gas fraction and/or the gas metallicity: note that most of the sources are predicted to be close to the detection threshold, even in 1Ms). Further work on the optically-faint population in the Ms Chandra fields will resolve this issue by comparison with the redshift distribution in Fig. 5.
We now ask how robust our conclusions might be, since they depend on a specific model. First we note that they should be a reasonable (factor of two) approximation to any model which has the obscured phase before the ’normal’, unobscured, quasar phase, since the model has that emission peaking between as observed. It also produces a mean local black hole density in agreement with that inferred from observation (Merritt & Ferrarese 2001). The higher redshift () Compton-thick sources contribute 10–20 per cent of the intensity of the XRB spectrum in the 5-12 keV band, and so are not of great importance to the spectrum; the lower redshift sources with contribute far more and dominate the spectrum in the 20–30 keV band. These last objects are completely undetectable with Chandra or XMM, unless they have scattered soft emission. The lowest redshift Compton-thick sources contribute most at the highest energies.
We conclude that distant Compton-thick quasars, which may dominate the XRB intensity over the 5–20 keV band and represent the growth phase of massive black holes, are just detectable with present instruments. A handful may be found in 100 ks exposures at flux levels close to the detection threshold. 50–100 distant Compton-thick sources are predicted to be detectable in Chandra deep fields of 1 Ms or more. The sources should be optically faint and probably appear as high redshift starburst galaxies.
5 Acknowledgements
ACF and CSC thank the Royal Society for support.
References
- [] Alexander D.M., Brandt W.N., Hornschemeier A.E., Garmire G.P., Schneider D.P., Bauer F.E., Griffiths R.E., 2001, AJ, 122,2156
- [] Barger A., Cowie L.L., Mushotzky R.F., Richards E.A., 2000, AJ, 121, 662
- [] Brandt W.N., et al 2001, AJ, 122, 1
- [] Cole S., Kaiser N., 1988, MNRAS,233, 637
- [] Comastri A., Setti G., Zamorani G., Hasinger G., 1995, A&A, 296, 1
- [] Crawford C.S., Fabian A.C., Gandhi P., Wilman R.J., Johnstone R.M., 2001, MNRAS, 324, 427
- [] Fabian A.C., Cutri R.M., Snith H.E., Crawford C.S., Brandt W.N., 1996, MNRAS¡ 283, L95
- [] Fabian A.C., Iwasawa K., 1999, MNRAS, 303 L4
- [] Fabian A.C., 1999, MNRAS, 308, L39
- [] Ferrarese L., Merritt D., 2000, ApJ, 539, L9
- [] Gebhardt K. et al, 2000, ApJ, 539, L13
- [] Giacconi R., et al, 2001, ApJ, 551, 624
- [] Gilli R., Salvati M., Hasinger G., 2001, A&A, 366, 407
- [] Hasinger G., Burg R., Giacconi R., Schmidt M., Trumper J., Zamorani G., 1998, A&A, 329, 482
- [] Hasinger G., et al, 2001, A&A, 365, L45
- [] Hornschemeier A., et al 2001, ApJ, 554, 742
- [] Lehmann I., 2001, ApJ, 371, 833
- [] Madau P., Ghisellini G., Fabian A.C., 1994, MNRAS, 270, L17
- [] Marshall F.E., et al 1980, ApJ, 253, 377
- [] Matt G., et al 1997, A&A, 325, L13
- [] Matt G., Fabian A.C., Guainazzi M., Iwasawa K., Bassani L., Malaguti G., 2000, MNRAS, 318, 173
- [] Merritt D., Ferrarese L., 2001, MNRAS, 320, L30
- [] Mushotzky R.F., Cowie L.L., Barger A.J., Arnuad K.A., 2000, Nature, 404, 459
- [] Norman C., et al 2001, ApJ submitted, (astro-ph/0103198)
- [] Nulsen P.E.J., Fabian A.C., 1995, MNRAS, 277, 561
- [] Ogasaka Y. et al 1997, PASJ, 49, 179
- [] Pettini M. et al 2001, ApJ, 554, 981
- [] Rosati P. et al 2001, ApJ in press (astro-ph/0110452)
- [] Setti G., Woltjer L., 1989, A&A, 224, L21
- [] Silk J., Rees M.J., 1998, A&A, 331, L1
- [] Vignati P., et al 1999, A&A, 349, L57
- [] Wilman R.J., Fabian A.C., 2000, MNRAS, 309, 862
- [] Wilman R.J., Fabian A.C., Nulsen P.E.J., 2000, MNRAS, 319, 583