Subtleties in Measuring Iron K Lines in AGN
Abstract
Chandra and XMM-Newton observations are showing that the emission lines in type 1 AGN are composite, in general consisting of a narrow and a broad component. We review the latest Chandra HETG results and compare the line profiles with those measured by ASCA. The narrow line components necessitate re-modeling of the line profiles measured previously and revision of the parameters of the relativistic broad components, as well re-interpretation of variability studies of the lines. There has been concern in the literature that changes in the ASCA calibration have made the lines narrower and weaker than originally thought. We explicitly demonstrate the effect of changes in the ASCA calibration since launch on the measurements of the lines in AGN. We find that the differences in measured parameters (centroid energy, width and equivalent width) are insignificant. In particular both the intrinsic width and equivalent width change by or less. The reason for the recent claims that the changes in the ASCA calibration have made the lines systematically narrower is due to the fact that in some cases the lines are complex and cannot be described by a single Gaussian. In such cases the current calibration models the narrow core only, when in fact the overall profile may be very broad. Thus the width of the line can be seriously underestimated if it is not modeled correctly. We point out that it is incorrect to compare different calibrations using models which do not describe the data. We present some new results for the highest S/N broad Fe K line profile in the entire ASCA archive, from NGC 4151. We show that the broadness of the iron line and its shape is not very sensitive to the precise form of the complex continuum, contrary to popular belief.
1 The Complex Iron Lines in AGN
ASCA found that the fluorescent emission line in Seyfert 1 galaxies is often very broad, and this is generally interpreted as the result of an origin in matter in an accretion disk rotating around a central black hole (see [1] and references therein). The line profile is thought to be sculpted by characteristic gravitational and Doppler energy shifts. Currently, study of the emission line is the only way to probe matter within a few to tens of gravitational radii in supermassive black holes. Indeed, the broad lines provide some of the strongest evidence to date for the existence of black holes.
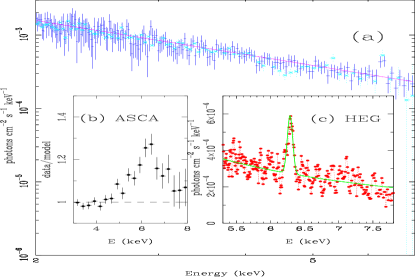
It has been known since the early days of ASCA that the line in AGN is not always tremendously broad (e.g. [2]) and that the profile comes in a variety of shapes (e.g. [3, 4]). It has also been known that Seyfert type 1.9–2.0 galaxies have a predominantly narrow line, with FWHM less than km/s, probably originating in cold matter far from the black hole (e.g. NGC 2992; [5]). It was apparent that many Seyfert 1.5–1.9 galaxies likely have composite narrow and broad line components (e.g. [6, 7, 8, 9]). Chandra and XMM-Newton have now shown that composite narrow and broad lines are common even in Seyfert 1 galaxies and quasars [10, 11, 12, 13]. Fig. 1 (from [10]) shows the narrow line in the Chandra HETG data for NGC 5548, compared to non-contemporaneous ASCA data showing the overall, broad line profile. Fig. 2 shows a montage of more measurements of the narrow-line component in type 1 AGN, again compared with non-contemporaneous ASCA measurements. Note that Chandra doesn’t always clearly detect the broad component of the line. This is not surprising since the effective area of HETG in the Fe-K band is so small. The HETG data do not in any case reject the corresponding broad line measured by ASCA . Also note that Chandra does detect a broad feature in NGC 4051, F9, and NGC 4151 (for the latter see Weaver & Yaqoob, these proceedings). Of course we do need simultaneous measurements with instruments that can measure both the narrow and broad components and we have a program to do this with Chandra and RXTE (some with XMM-Newton ).
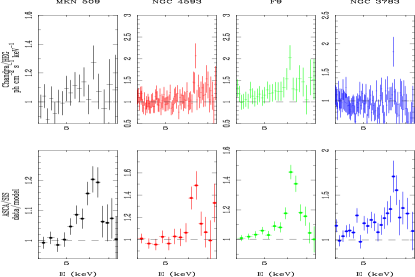
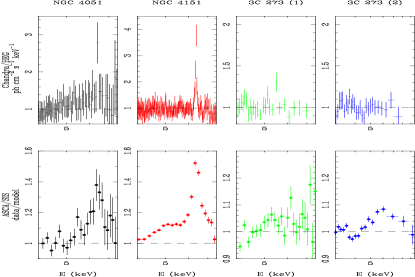
The equivalent widths of the narrow lines (NL) range from tens of eV to over a 100 eV in some cases. In all type 1 AGN studied by HETG so far (excluding NLS1), the narrow line appears to originate in cold matter, with its center energy around 6.4 keV. Only in one case (NGC 3783; [11]) is the narrow line resolved (in NGC 5548 it was marginally resolved [10]). In that case its location is somewhere in between the BLR and NLR. In all the other cases, upper limits on the FWHM are km/s. Its location could be any one or more of: BLR, NLR, obscuring torus, or even the outer regions of the accretion disk. The latter is possible because we do not actually know the distribution of line emissivity over the disk. The distribution may be flatter than and need not even be a power-law. For example, if the disk is illuminated by a distribution of magnetic flares all over the surface then the line emissivity could be very flat with radius. It may then appear that there is a separate NL, when in fact the disk is producing both the NL and the broad line (BL). If the spatial distribution of flares varies with time, the NL will appear to vary. Indeed, Fig. 2 shows that a narrow line is detected in one observation of 3C 273 but not in another observation which has the same continuum luminosity. This strongly argues for a disk origin of the narrow line in 3C 273. A program is under-way to retroactively re-interpret previous measurements of the line profiles and variability for as many AGN as possible, in the light of new Chandra and XMM-Newton results.
2 Lines and ASCA Calibration
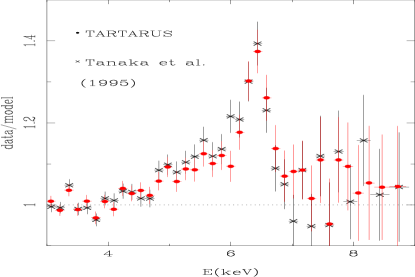
Recently Lubiński and Zdziarski ([14] hereafter LZ01) have claimed that the lines in AGN are systematically narrower and weaker (smaller equivalent width, or EW) than had previously been thought. They speculated that this result can be attributed to changes in the calibration of the ASCA instruments. Specifically, LZ01 refer to the calibration used by Tanaka et al. 1995 [15] (hereafter T95) and Nandra et al. 1997 [4] (hereafter N97) and that used in the tartarus AGN database111http://tartarus.gsfc.nasa.gov/. We call the T95 and N97 calibration ‘OLD’ and the tartarus calibration ‘CURRENT’. Fig. 3 compares the line profiles for MCG 63015 using the actual data and calibration files used by T95 [15] and tartarus. A similar comparison is shown for 3C 120 in Fig. 4 but this time calibration effects are isolated by using the same spectral files but constructing OLD and CURRENT calibration for them. Detailed spectral fit results and technical details on the different calibrations can be found in [16]. Now these observations of MCG 63015 and 3C 120 have much higher signal-to-noise than typical day ASCA observations (which constitute the LZ01 sample), yet the calibration effects on the line are small. In fact simulations show that the CURRENT calibration reduces the EW and intrinsic width by only . Moreover, all of the observations considered by LZ01 were made before radiation damage made a significant impact on the CCDs. Therefore the principal differences between the OLD and CURRENT calibration for these early data are, (1) improvements in the SIS response matrix, (2) multiplicative, energy-dependent corrections for the effective area (the so-called ‘arf filter’), and (3) changes in the X-ray Telescope (XRT) ray-tracing (see [16] for details). The latter is the only change that can make the OLD and CURRENT calibration have different effects on different observations since the first two are independent of position on the detector and independent of time of the observation (as long as that time is early enough in the mission). Even the change in XRT response is a smooth function of source off-axis angle, and its variation is small given the limited range of off-axis angles in observations. Changes in calibration cannot therefore produce wild differences in the lines in some sources and small differences in others as LZ01 claim. If one examines the line profiles for the type 1 AGN in LZ01 which do give wildly different line widths compared to N97, one finds that the lines claimed to be narrowest by LZ01 are in fact some of the broadest. However, the lines are can be complex and cannot always be modeled by single Gaussians, so the LZ01 spectral fits could model the narrow line core only, grossly underestimating the width and EW.
3 The Broad Line in NGC 4151
NGC 4151 has been observed by ASCA several times. An unprecedented AO8 day observation in May 2000 (exposure ks) yielded an line profile with the highest signal-to-noise for any AGN in the entire ASCA archive. The 5–7 keV band in the ASCA SIS0 AO8 NGC 4151 data contains times more photons (in total) than MCG 63015.
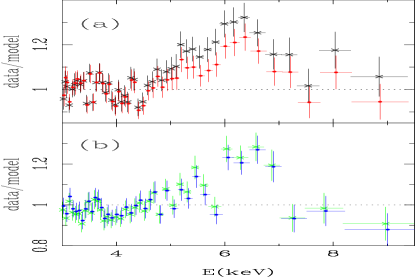
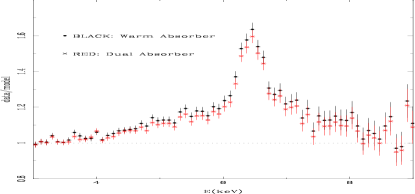
In Fig. 5 we show the result of fitting the 0.6–10 keV ASCA AO8 (SIS0) data for NGC 4151 with two different complex continuum models (power law plus a dual cold absorber and a warm absorber, as well as a thermal emission component) and double Gaussians for the line. It can be seen that the resulting line profile is hardly sensitive to the precise form of the continuum. In fact even if we fit the 3–10 keV band only with a simple single absorber (plus power-law), the line profile is not substantially affected. It is also important to note that the relative strength of the red wing is variable in general: this has been known for MCG 63015 for some time. The AO8 data clearly show this for NGC 4151 but that work will be presented elsewhere. In any case, we should not be surprised, if during a particular observation of NGC 4151 the red wing appears to be weak.


The statistical quality of the ASCA AO8 data is good enough to reject claims that the broad line in NGC 4151 is really the result of a thick absorber mimicking the broad line. Considering a spectral fit to the SIS0 data in the 0.6–10 keV range with a power law plus warm absorber, thin thermal continuum, narrow line, plus a very thick, partially covering, absorber, to model the apparent broad red wing of the line, we obtain a poor fit. Compared to a similar model with the thick absorber replaced by a broad Gaussian the difference in for the thick absorber model compared to the broad line model is 43, rejecting the former model at an extremely high level of confidence. The d.o.f. for the two models are equal because the thick absorber model has free covering factor and photon index.
References
- [1] Fabian, A. C., et al. 2000, PASP, 112, 1145
- [2] Ptak, A., Yaqoob, T., Serlemitsos, P. J., et al. 1994, ApJ, 436, L31
- [3] Yaqoob, T., Serlemitsos, P. J., Turner, T. J., et al. 1996, ApJ, 470, L27
- [4] Nandra, K., George, I. M., Mushotzky, R. F., et al. 1997, ApJ, 476, 70 (N97)
- [5] Weaver, K. A., Nousek., J., Yaqoob, T., et al. 1996, ApJ, 458, 160
- [6] Weaver, K. A., et al. 1993, ApJ, 423, 621
- [7] Yaqoob, T., Edelson, R., Weaver, K. A., et al. 1995, ApJ, 453, L81
- [8] Weaver, K. A., Yaqoob, T., Mushotzky, R. F., et al. 1997, ApJ, 474, 675.
- [9] Weaver, K. A., & Reynolds, C. S. 1998, ApJ, 503, L39
- [10] Yaqoob, T. et al. 2001, ApJ, 546, 759
- [11] Kaspi, S. 2001, these proceedings
- [12] Reeves, J., et al. 2000, A&A, 365, L134
- [13] Pounds, K. A., et al. 2001, ApJ, 559, 181
- [14] Lubiński, P., & Zdziarski, A. A. 2001, 323, L37
- [15] Tanaka, Y., et al. 1995, Nature, 375, 659
-
[16]
Yaqoob, T. et al. 2001,
http://heasarc.gsfc.nasa.gov/docs/
asca/calibration/oldvscurrent.html
ACKNOWLEDGMENTS
We acknowledge support from the following grants: NCC5-447 (TY, UP), NAG5-10769, NAS8-39073 (TY), NAG5-7067, NAG5-7385 (KN,TJT).