Faint Source Counts from Off-source Fluctuation Analysis on Chandra Observations of the Hubble Deep Field-North
Abstract
We report the results of fluctuation analysis of the off-source field from the 1 Million second Chandra Observation of the Hubble Deep Field-North (HDF-N). The distribution of the counts in cells has been compared with the expectations from the model to constrain the behavior of the source number density down to a factor of several lower than the source-detection limit. Our results show that the number counts in the soft band (0.5-2 [keV]) continue to grow down to , possibly suggesting the emergence of a new population and agree well with a prediction of star forming galaxies by Ptak et al. (2001). For the hard (2-10 keV) band, the fluctuation analysis can loosely constrain the source counts fainter than the detection limit and we found an upper limit of at .
1 Introduction
The number count of X-ray sources as a function of flux (the so called the relation) is one of the key constraints for models of the X-ray source population. Most of the “Cosmic X-ray Background” (CXRB) intensity has now been resolved with “Chandra” (Mushotzky et al., 2000; Tozzi et al., 2001; Brandt et al., 2001b) to the extent that major uncertainties in the fraction of the CXRB which have been resolved into individual sources, i.e, how much of it remains to be explained, lie in the absolute intensity of the CXRB and field-to-field fluctuations due to cosmic variance. In terms of the origin of the CXRB, the faintest sources in the Chandra Deep Fields are becoming less interesting. However, constraints on number counts at the faintest possible fluxes provide a new view on the nature and evolution of the X-ray emitting sources.
Fluctuation analysis is a strong tool for constraining the source counts below the source detection limit. This technique has been successfully applied to data from previous missions (Hasinger et al., 1993; Georgantopoulos et al., 1993; Gendreau et al., 1998; Yamashita et al., 2000; Perri & Giommi., 2000) and the source counts inferred from these analyses have turned out to be consistent with those from resolved sources in deeper observations. The Chandra observations of the Hubble Deep Field North (HDF-N) and Chandra Deep Field-South (CDF-S), with an exposure of about 1 Ms each, are the deepest X-ray imaging data obtained so far. Fluctuation analyses on these fields are an essential step in pushing the limit of the source counts to even fainter fluxes.
In this letter, we report our initial results of the fluctuation analysis of the 1 Ms of the Chandra observation of HDF-N. In this first analysis, we have assumed that the sky fluctuation solely comes from unresolved point sources (AGNs and galaxies). An analysis including the CDF-S, further HDF-N exposures, and possible effects of extended X-ray emission will be reported in a future paper (paper II, in preparation). In this letter, we use , , and unless otherwise noted.
2 Data Preparation
The Chandra X-ray Observatory (CXO) was used to observe the HDF-N field with its ACIS-I detectors. The total exposure time attained as of Spring 2001 has been 975 [ks] over 12 observations and the data, which have been aligned to an astrometric accuracy of , have been fully archived111http://asc.harvard.edu/udocs/ao2-cdf-download.html. We have made use of the Level 1 merged event list from the archive to create images for our analysis. The charge transfer inefficiency (CTI), has been corrected according to procedures in Townsley, Broos, Garmire, & Nousek (2000). After this correction, we have filtered events to remove hot pixels, columns and flaring events flagged in the archived eventlist.
In order to reduce the particle background as much as possible, we have used the restricted grades (Brandt et al., 2001b), i.e., fltgrade=0,64 for the soft (0.5-2 keV) band and fltgrade=0,2,8,16,64 for the hard (2-8 keV) band respectively. Using these restricted grade sets, we removed 46% and 25% of the off-source events (non X-ray background dominated), while removing only 15% and 13% of source events for the soft and hard bands respectively compared with the standard selection (grade=0,2,3,4,6). There are two locations where CXO pointings are concentrated in the 1 Ms of the HDF-N data, one near and the other near . For the fluctuation analysis, we have chosen a region which is an intersection of two 52-radius circles centered at these two locations. We have also excluded the locations corresponding to the gaps between CCDs by imposing a total exposure value of at least 800 [ks]. The cell size used for making histograms of the detected counts was , which was chosen to match the largest point-spread function (PSF) in this area. The region contains neither of the two extended sources discussed by Brandt et al. (2001b). The flux (before Galactic absorption)-to-countrate conversion factors have been calculated using PIMMS 222http://heasarc.gsfc.nasa.gov/Tools/w3pimms.html assuming a power-law with a Galactic absorption of corrected for the loss of events for using the restricted grade set.
2.1 Point Source Detection and Removal
We have used the wavdetect utility distributed as a part of the Ciao 2.1 package333http://asc.harvard.edu/ciao/ to find sources to be masked out from the image to be analyzed. We have used a false detection probability threshold of and wavelet scales of pixels on -pixel images. The detection completeness has been extensively investigated using running the same source detection procedures on simulated images (Sect.3.2). The sources with wavelet-detected counts larger than 12(18) counts, corresponding to (6.) in 0,5-2 (2-10) [keV] (here and hereafter, represents an X-ray flux measured in ) have been masked out from the field for the soft (hard) band. The simulation shows that less than one source per field fails to be detected above these thresholds. We take conservatively large radii for the source exclusion region, ranging from 6 to , depending on the wavelet-detected source size and counts. After the source removal, the remaining area for the fluctuation analysis was 7848(8043) pixels or 34.9(35.7) arcmin2 for the soft(hard) band.
3 Off-source Fluctuation Analysis
3.1 Overall Procedure
Using the off-source map generated above, we have searched for the behavior of below the source detection limit which is consistent with the off-source fluctuation. For the model, a broken power-law form for the cumulative source count has been assumed:
| (3) |
, where and are the minimum and maximum fluxes between which we would like to constrain the behavior. We set as the limiting flux of the complete source detection and as the flux corrsponding to count in the image. Confidence level searches in the parameter space have been made for two cases, each with two free parameters:(1) Single power-law with free parameters (,), and (2) Broken power-law with free parameters ( ), where the and values fixed to the best-fit of the single power-law case. The second power-law component helps determine the practical sensitivity limit of this analysis, following the approach by Hasinger et al. (1993). For each point in the parameter space, we have run Monte-Carlo simulations and compared simulated and observed histograms of the number of pixels as a function of the number of detected counts (the so-called diagram) as detailed in the following subsections. By running the simulations over the parameter space, we have determined the subspace where the model was accepted at a 90% confidence level. For the accepted subspace, we have calculated the minimum and maximum values at each flux between and to find final constraints on the behavior. The resuling constraints are shown and discussed in Sect. 4
3.2 The Image Simulation
The image simulation has been made using simulation software developed by one of the authors (TM). It has been designed to meet the needs of massive Monte-Carlo simulations of a summed image from multiple observations with offset pointings. For each observation, it uses a separate exposure map and a different pointing position, from which the off-axis angle is calculated.
An image simulation runs as follows. Firstly, random point sources are generated based on an input model. For a given input source (with a sky position and a physical flux), the simulator generates Poisson-deviated number of events based on the maximum exposure value of each observation. The off-axis angle is calculated from the pointing direction of the observation and the simulator spatially spreads the generated events based on the off-axis angle dependent PSF. For each of the PSF-deviated event, a random number between 0 and 1 is generated. The event is rejected if this random number is larger than the ratio of the exposure value at the point and the maximum exposure. This two-step procedure assures the correct treatment near the CCD edges and bad columns. The above steps are repeated for all the observations and all the generated sources. Background events are then added to the image in such a way that the total count of the sources and the background is the same as that of the real data. The background events have been distributed assuming that they are dominated by the particle background and it is uniform over the active pixels of the CCDs and not affected by the vignetting of the CXO telescope.
We have forced the total count of the simulated image to be equal to the real data, instead of also considering the Poisson deviation of the residual background count. This is because the underlying background rate is not an interesting parameter here and in order to assess the confidence range of interesting parameters (the parameters in this case) for given data, uninteresting parameters should be adjusted to give the best fit. In our case, forcing the total counts to be equal automatically makes this adjustment.
3.3 Statistics
The probability distribution of the histogram is more complicated than the simple Poissonian or Gaussian, involving source and photon fluctuations with correlated errors. Thus using analytical formulae of the probability distributions of common statistical measures (e.g. the distribution), gives inaccurate results. Thus we use Monte-Carlo simulations to calculate the probability distributions. With Monte-Carlo simulations, the probability that a model is correct can be estimated using any reasonable estimator which indicates the deviation between the model and the data. In this work, we have used a modification of the Cash (1979) estimator by Caster, as used in the XSPEC 11.1 (Arnaud & Dorman, 2001), the change of which usually follows the probability distribution:
| (4) |
where and are the observed and model-predicted numbers of pixels having counts () or the number of resolved sources (, observed or predicted; see below) respectively. The sum is over . We have excluded from the sum because these two bins are not independent from the others (the total numbers of pixels and events are fixed). As an additional constraint, a term () where the number of resolved sources above the defined flux limit is and its model-predicted value has been included in Eq. 4. This term constrains the at the brighter end of the fluctuation analysis.
For a given model, 1000 simulations have been made and the mean of the simulated results has been taken as as Hasinger et al. (1993) did. However, instead of using the distribution, we have used the distribution of 1000 values between this and the 1000 simulated histograms. If % of the simulated values are greater than that between the model and the real data, the model has been accepted at a 90% confidence level.
4 Results and Discussion
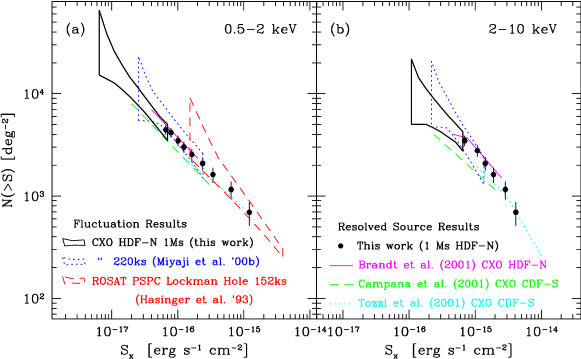
The resulting constraints (90% confidence range) on the behavior in the 0.5-2 [keV] and 2-10 [keV] bands (the latter have been scaled from 2-8 [keV] assuming a power-law spectrum) obtained from our analysis are shown in Fig. 1 along with a number of recent results from the literature in the flux regime of interest. The resolved source counts (Sect.2.1) have also been plotted with 1 error bars. 444ASCII tables of the results can be found in the src distribution of this preprint and at http://astrophysics.phys.cmu.edu/deepxray/tables These are consistent with those from Brandt et al. (2001b), who used sources from a smaller part of the same general area to avoid incompleteness. Our resolved source counts are from a larger area and are plotted down to fluxes which were not affected by incompleteness as determined from the simulations. The fluctuation results have been plotted down to a flux where the number counts have been reasonably constrained. We have set the faintest sensitivity limit at the flux where the difference between the upper and lower bounds is a factor of three. We note that we could determine the sensitivity limit in this way by exploring the parameter space in a broken power-law form (Eq. 3), and not just the single power-law model.
For verification, we have also overplotted the results of our previous analysis, which utilized essentially the same procedure, when only 220 [ks] of CXO data were available on this field (Miyaji et al., 2000b). As 1 Ms of data have been obtained, fainter sources have now been resolved. The resolved source counts in the 1 Ms of observation agree well with the 220 ks fluctuation results.
Fig. 1 shows that the deep resolved-source counts in CDF-S by Campana et al. (2001), whose faint limit was attained by full corrections for incompleteness and the Eddington bias, are somewhat below the lower limit of our fluctuation results in both energy bands. Comparing a number of results from the literature (Tozzi et al., 2001; Campana et al., 2001; Brandt et al., 2001b; Mushotzky et al., 2000), the X-ray source counts from CDF-S, as well as those of the Lockman Hole observed with XMM-Newton(Hasinger et al., 2001), are in general lower than those of the HDF-N region by , depending on the work cited and flux range. This probably reflects actual cosmic variance in the sky with some minor contribution from different calibrations and source detection techniques.
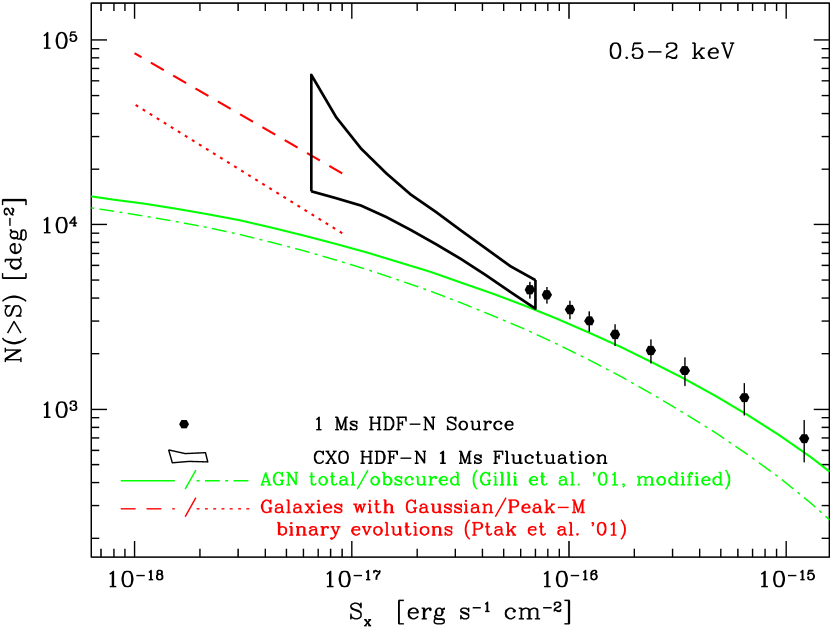
The most significant result from our analysis is that the 0.5-2 [keV] continues to grow down to . The 2-10 [keV] fluctuation results are consistent with both starting to saturate and continuing to grow below , while some loose constraints can be made (e.g. at ). Here we focus our discussion on the implication of our results in the soft band. From the deepest ROSAT surveys (Lehmann et al., 2001), the X-ray sources at turns out to be dominated by AGNs, while at fainter fluxes, difficulties in complete optical identifications of the faint sources detected in CXO/XMM-Newton () leave us with tantalizing situations in the nature and redshifts of these sources. There still exist large uncertainties in the behavior of the soft X-ray luminosity function (SXLF) of AGNs at moderately low luminosities ( ) at . Miyaji, Hasinger, & Schmidt (2000a, 2001) constructed an SXLF of AGNs () using ROSAT surveys with a very high degree of completeness in spectroscopic identifications down to . They discussed two extremes of possible extrapolations of the SXLF behavior in the framework of the luminosity-dependent density evolution (LDDE) picture. One of them has rapidly dropping density-evolution rates as luminosities become lower ( ) (LDDE1) and the other has only a moderate drop in evolution rate in such a way that AGNs alone can make of the soft X-ray background (LDDE2). The LDDE2 model overpredicts the number count by a factor of two at and thus can be considered to be rejected by the new data. We have overplotted the 0.5-2 keV prediction from the AGN population synthesis model composed of unabsorbed and absorbed AGNs based on the LDDE1 model by Gilli, Salvati, & Hasinger (2001) (model B). The plotted model have been slightly modified from the original as described in Rosati et al. (2001). The curves for the total and absorbed ( ) AGN populations are plotted. Fig.2 shows that the AGN counts drop below even if the emergence of the obscured AGN population is taken into account, while the source counts from the fluctuation analysis continue to grow. If their model B closely represents the true behavior of the SXLF of the AGN population, we are probably seeing the emergence of a new population of faint X-ray sources. This excess may be contributed by AGNs with low intrinsic luminosities (at ) and/or X-rays from star-formation activities through supernova remnants and low-/high- mass X-ray binaries. In view of this, we have also overplotted a model prediction of X-ray number counts based on the cosmic star-formation rate (Ptak et al., 2001) for the two models of binary evolution (Gaussian and Peak-M) from Ghosh & White (2001). Within the uncertainties in the AGN source counts and model construction, these predictions gave approximately the number counts from our fluctuation analysis. This is also consistent with the results of stacking analysis of bright galaxies by Brandt et al. (2001a).
Finally we describe a number of caveats to be considered in interpreting our analysis. The possisble inhomogeneities in the CCD quantum efficiencies and particle backgrounds, and the existence of low-surface brightness diffuse sources (unresolved galaxy groups and possible intergalactic medium) would all work in the directions of increasing the apparent number counts inferred from the fluctuation analysis. The excellent agreement between the 220 ks fluctuation results and 1 Ms source counts shows that at least the first effect is negligible. Furthermore, summing data from 12 observations have further smoothed out the first two effects. However, actual diffuse structure in the sky may come into effect at this very faint level. This aspect will be discussed in paper II.
References
- Arnaud & Dorman (2001) Arnaud, K., & Dorman, B. 2001, XSPEC Users Guide for version 11.1.x
- Brandt et al. (2001a) Brandt, W. N. et al. 2001a, AJ, 122, 1
- Brandt et al. (2001b) Brandt, W.N., et al. 2001b, AJin press, (astro-ph/0108404)
- Cash (1979) Cash, W. 1979, ApJ, 228, 939
- Campana et al. (2001) Campana, S., Moretti, A., Lazzatti, & D.,Tagliaferri, G. 2001, ApJL in press (astro-ph/0108445)
- Gendreau et al. (1998) Gendreau, K.C., Barcons, X., & Fabian, A.C. 1998, MNRAS, 297, 41
- Ghosh & White (2001) Ghosh, P. & White, N.E. 2001, ApJ, 559, L97
- Georgantopoulos et al. (1993) Georgantopoulos, I., Stewart, G. C., Shanks, T., Griffiths, R. E., & Boyle, B. J. 1993, MNRAS, 262, 619
- Gilli, Salvati, & Hasinger (2001) Gilli, R., Salvati, M., & Hasinger, G. 2001, A&A, 366, 407
- Hasinger et al. (1993) Hasinger, G., Burg, R., Giacconi, R., Hartner, G., Schmidt, M., Trumper, J., & Zamorani, G. 1993, A&A, 275, 1
- Hasinger et al. (2001) Hasinger, G., et al. 2001, A&A, 365, 45
- Lehmann et al. (2001) Lehmann, I. et al. 2001, A&A, 371, 833
- Miyaji, Hasinger, & Schmidt (2000a) Miyaji, T., Hasinger, G. & Schmodt, M. 2000a, A&A, 353, 25
- Miyaji, Hasinger, & Schmidt (2001) Miyaji, T., Hasinger, G., Schmodt, M. 2001, A&A, 369, 49
- Miyaji et al. (2000b) Miyaji, T. et al. 2000, AAS Meeting, 197, 136.02
- Mushotzky et al. (2000) Mushotzky, R.F., Cowie, L.L., Barger, A.J.& Arnaud, K. A. 2000, Nature, 404, 459
- Perri & Giommi. (2000) Perri, M. & Giommi, P. 2000, A&A362, L57
- Ptak et al. (2001) Ptak, A., Griffiths, R.E., White, N.E., & Ghosh ,P. 2001, ApJ, 559, L91
- Rosati et al. (2001) Rosati, P. et al. 2001, ApJ in press (astro-ph/0110452)
- Townsley, Broos, Garmire, & Nousek (2000) Townsley, L. K., Broos, P. S., Garmire, G. P., & Nousek, J. A. 2000, ApJ, 534, L139
- Tozzi et al. (2001) Tozzi, P., et al. 20001, ApJ, 562,42
- Yamashita et al. (2000) Yamashita, A. 1999, Doctoral Thesis, University of Tokyo