Properties of a spectroscopically selected CV sample
Abstract
We have initiated a dedicated search for new CVs, selecting candidates on the base of their spectroscopic properties in the Hamburg Quasar Survey (HQS), which lead up to now to the identification of 50 new CVs and a dozen good candidates. Using the HQS data of the previously known CVs for extensive tests of our selection scheme, we demonstrate that our survey should be very efficient in finding short period systems as long as they have emission lines with equivalent widths Å. So far, orbital periods have been measured for 15 of the new CVs, with the surprising result that only two systems lie at or below the lower boundary of the period gap. This – somewhat preliminary – result is in uncomfortable disagreement with the predictions of the standard scenario of CV evolution.
Universitäts-Sternwarte, Geismarlandstr. 11, 37083 Göttingen, Germany
Hamburger Sternwarte, Gojenbergsweg 112, 21029 Hamburg, Germany
1. The standard CV evolution scenario
For almost two decades, the general approach to the theory of CV evolution and the observational picture co-existed quite peacefully despite some disagreements (Patterson 1984), and the progress on both fronts was steady, but slow. The best-known binary parameter of a CV is typically its orbital period, and much of the theoretical effort has been devoted to a quantitative description of the observed orbital period distribution (Fig. 1). The pronounced features of this distribution are (1) a dwindling number of CVs at long orbital periods, (2) a dearth of systems in the h orbital period range, and (3) a sharp cut-off at min. The standard CV evolution scenario (e.g., King 1988), which qualitatively explains all three features, is based on the assumption that two different angular momentum loss (AML) mechanisms are dominating above (magnetic braking) and below (gravitational radiation) the gap. While this standard model has recently been challenged on various grounds (see in this volume: Collier-Cameron, p. LABEL:paper_colliercameron; Kolb, p. LABEL:paper_kolb_bouncing; King & Schenker, p. LABEL:paper_king; Schenker & King, p. LABEL:paper_schenker), we will focus here only on one aspect in which the predictions of the theory disagree with the observations: the space density of CVs.
Population syntheses based on the standard CV evolution scenario predict rather large space densities of CVs, ranging from a few (de Kool 1992) to a few (Politano 1996)111To illustrate these numbers: a space density of corresponds to 42 CV within a distance of 100 pc.. Because the assumption of enhanced AML above the gap implies a much shorter evolutionary time scale for the long period CVs, the vast majority ( %) of the present day CV population should be short period systems below the gap (Kolb 1993; Howell, Rappaport, & Politano 1997).
On the observational side, most space densities derived from different CV samples are significantly lower than the theoretical values. Only the value of Hertz et al. (1990) is marginally in the predicted range. However, their result is based on the identification of four optically faint CVs in a rather small () area of the Einstein Galactic Plane Survey, and for none of these CVs a reliable distance or orbital period measurement is available so far.
The number of Thomas & Beuermann (1998) deserves an interesting note: A space density of is derived for the AM Herculis stars alone, CVs containing a strongly magnetic white dwarf, on the base of the ROSAT All Sky Survey (RASS). If the ratio magnetic/non-magnetic white dwarfs in CVs is the same as it is for field white dwarfs ( %, Jordan 1997; Wickramasinghe & Ferrario 2000), the result for the AM Her stars predicts a total CV space density of , which implies independently of the standard scenario that we are missing a large fraction of the non-magnetic CVs.
While Fig. 1 gives only the period distribution of the well-studied CVs which are, somewhat generalized, the brightest ones, it suggests that we are predominantly missing short period CVs. An exact assessment of the actual space densities above and below the gap requires (a) good measurements of the distances, which are available only for a limited number of systems, and (b) a detailed model for the discovery probability. Especially the second point is a challenge (e.g. Ritter 1986), as the selection effects depend on a large number of parameters.
2. How to find CVs
CVs are discovered by various means. As suggested by their name, variability is one of their main features, this is especially true for classical nova and dwarf novae with sudden brightness variations of up to 10 magnitudes. Consequently, the bulk of the known CVs has been discovered by legions of amateur observers relentlessly scanning the skies for new stars, or by large-scale photographic sky patrols. Because the mass transfer from the secondary star onto the white dwarf releases a large amount of potential energy, CVs can be detected as X-ray emitters, in particular magnetic CVs, in which the bulk of the energy release is confined to a rather small volume near the magnetic pole caps of the white dwarf (polars, intermediate polars). The various X-ray satellite missions have discovered somewhat more than 100 CVs, the majority during the RASS (e.g. Thomas et al. 1998; Beuermann et al. 1999). As CVs typically contain a hot component (accretion disc/column, white dwarf), they show up as blue/ultraviolet excess objects in colour surveys, such as the Palomar-Green (Green et al. 1982; Ringwald 1996) survey. However, the colour space confusion of CVs with other blue objects (white dwarfs, subdwarfs, QSOs) makes the definite classification of CV candidates very telescope time consuming. To date, less than 100 CVs have been discovered in pure colour surveys. Finally, CVs may be discovered thanks to their particular spectroscopic appearance: most CVs show relatively strong Balmer and helium emission lines. However, so far this selection criterion has been used only to a very limited extent, most of the 2–3 dozen spectroscopically discovered CVs stem from the first and second Byurakan surveys.

Table 1. CV space densities derived from the observations
| Warner 1974 | |
| Patterson 1984 | |
| Downes 1986 | |
| Hertz et al. 1990 | |
| Ringwald 1996 | |
| Thomas & | |
| Beuermann 1998∗ |
∗ Only AM Herculis stars!
3. The Hamburg Quasar Survey
The Hamburg Quasar Survey (HQS, Hagen et al. 1995) is a wide-angle objective-prism survey to search for bright () quasars in the northern sky. The survey was carried out from 1980 to 1997 with the 80 cm Schmidt telescope on Calar Alto, covering of the northern sky () at high galactic latitudes (). The dynamic range of the survey is and the spectral coverage is Å with a resolution of Å at . The plates were scanned with a PDS 1010 G microdensitometer in low-resolution mode with pixel per spectrum. Blue objects were selected among the low-resolution spectra and subsequently rescanned with full resolution. The full-resolution density spectra were classified after a visual inspection into a small number of categories, primarily candidates for quasars, hot stars, and narrow emission line objects (Hagen et al. 1999). These spectra () form our archive of high-resolution scan (HRS) spectra from which the candidates for our ongoing search for new CVs are selected.


4. A large-scale search for new CVs
A handful of CVs were serendipitously discovered in the HQS, the first ones being the eclipsing dwarf nova EX Dra = HS 1804+6753 (Billington, Marsh, & Dhillon 1996) and the possibly magnetic sytem HS 0551+7241 (Dobrzycka et al. 1998). Other examples of rather unusual CVs found among QSO candidates are two polars with extremely low accretion rates, HS 0922+1333 and WX LMi = HS 1023+3900 (Reimers, Hagen, & Hopp 1999; Reimers & Hagen 2000, see also Schwope et al., this volume). 11 new CVs were identified using the HQS plate material for the identification of the optical counterparts of ROSAT All Sky Survey sources (Bade et al. 1998; Jiang et al. 2000), including the deeply eclipsing h dwarf nova GY Cnc = HS 0907+1902 (Gänsicke et al. 2000) and the new SU UMa dwarf nova KV Dra = HS 1449+6415 (Nogami et al. 2000).
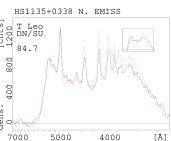
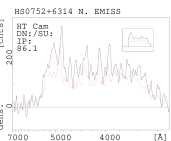
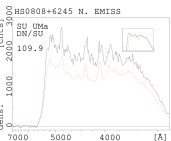
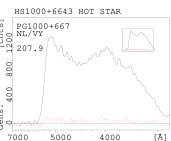
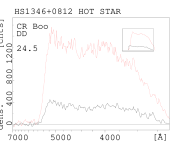
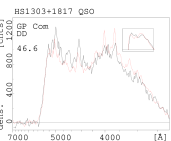
We have initiated in 2000 a systematic search for new CVs in order to fully exploit the potential of the HQS for providing a magnitude limited sample of CVs selected primarily because of their spectroscopic properties. Figure 2 shows the HQS HRS spectra of 9 previously known CVs, including short and long orbital period dwarf novae, novalike variables, and double degenerate systems. Balmer emission, the hallmark of most CVs, can easily be detected in the HRS spectra for equivalent widths (EW) Å. At the HRS resolution, novalike variables or dwarf novae in outburst which are characterised by optically thick disc spectra cannot be distinguished from hot stars222Ironically, despite their large absolute magnitudes, novalike variables are indeed the most difficult-to-find subtype of CVs, as they are usually neither strongly variable, nor bright X-ray sources. The recent discovery of a bright (!) novalike variable (Mickaelian et al. 2001) underlines the possible incompleteness of this class of objects.. However, at least two objective-prism plates have been obtained for each HQS field at different epochs, so that additional information is available on the variability of the objects.
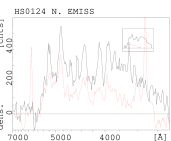
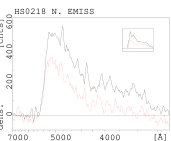
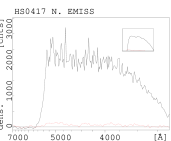
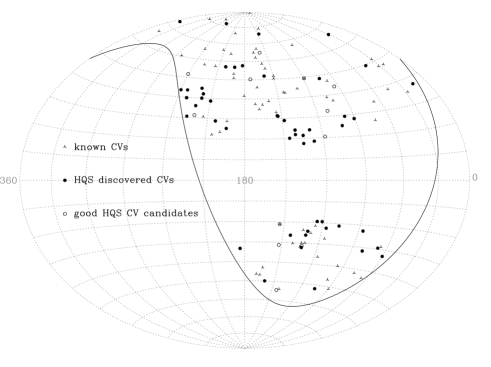
Our criterion to select CV candidates from the HQS is, hence, (1) detection of Balmer emission333Note that the same applies of course for He emission lines in double degenerate CVs, see GP Com in Fig. 2. A dedicated search for helium cataclysmics is in preparation. in the HRS spectrum, or (2) hot star appearance plus significant variability ( mag). Follow-up spectroscopy of the CV candidates was obtained during two runs in September 2000 and April 2001 at the Calar Alto 2.2m telescope using CAFOS. At the time of writing, 50 CVs have been discovered in the HQS and 12 very promising CV candidates await spectroscopic confirmation (e.g., Fig. 3).
5. Selection effects in the HQS CV sample
The characteristics of the HQS (large area, moderately bright cut-off magnitude) allows a careful examination of the CV detection efficiency based on the sample of previously known CVs. The Downes et al. (2001) catalogue and the TPP database (Kube, Gänsicke, & Hoffman, this volume, p. LABEL:paper_kube_tpp) list 288 CVs or CV candidates within the area covered by the HQS. This sample can be broken up into two groups.
![[Uncaptioned image]](/html/astro-ph/0111375/assets/x14.png)
![[Uncaptioned image]](/html/astro-ph/0111375/assets/x15.png)
![[Uncaptioned image]](/html/astro-ph/0111375/assets/x16.png) Figure 4.:
(a) Period distribution of the previously known CVs with a HQS
HRS spectrum (shaded) and those correctly recognised as being a CV
(gray). (b) Period distribution of the new CVs discovered in the
HQS. The tickmarks indicate the individual periods. (c) Period
distribution of the previously known CVs with no HRS spectrum.
Figure 4.:
(a) Period distribution of the previously known CVs with a HQS
HRS spectrum (shaded) and those correctly recognised as being a CV
(gray). (b) Period distribution of the new CVs discovered in the
HQS. The tickmarks indicate the individual periods. (c) Period
distribution of the previously known CVs with no HRS spectrum.
Known CVs with a HRS spectrum: For 84 out of the 288 CVs in the HQS area at least one density spectrum is contained in our HRS database. Our selection criterion, Balmer emission lines or blue continuum plus variability, correctly recognises 52 of these systems, or 62 %, as CV candidates. The majority of the CVs that were not recovered are novalike variables with inconspicuous hot star-like HRS spectra and insignificant variability information. The orbital period has been measured for 57 out of the 84 known CVs, which allows us to test for a possible selection bias towards short or long orbital periods. Figure 4 shows the orbital period distribution of CVs with a HRS spectrum, and, shaded in gray, the fraction of the CVs correctly recognised by our selection criterion. Apparently, our detection efficiency is maximal below the orbital period gap, but we lose a significant fraction of systems above the gap: the novalike variables with thick disc emission. Figure 5 shows the magnitude distribution of the known CVs with a HRS spectrum, and, again shaded in gray, the fraction of the CVs recovered by our selection. These magnitudes are derived from the HQS plate material in a homogenous manner. Interestingly, the fraction of recovered CVs is lowest at the bright end of the magnitude distribution (), which is due to the relatively bright long period novalike variables that could not be identified as CVs on the base of their HRS spectra.
Known CVs with no HRS spectrum: A significant fraction (204, corresponding to %) of the previously known CVs and CV candidates in the HQS area are not included in the HRS database. Figure 5 shows the magnitude distribution of these systems, assembled from Downes et al. (2001) and TPP (Kube et al., this volume). We caution that this diagram has to be interpreted with some care: the magnitudes are a mix of , , , , and measurements, and, more importantly, for a significant fraction of the systems (85, corresponding to %), the published magnitudes are “fainter than” limits. With this caveat in mind, Fig. 5 suggests that CVs are too bright and should be saturated on the HQS plates, have magnitudes within the HQS dynamic range, and are too faint.
![[Uncaptioned image]](/html/astro-ph/0111375/assets/x17.png)
![[Uncaptioned image]](/html/astro-ph/0111375/assets/x18.png)
![[Uncaptioned image]](/html/astro-ph/0111375/assets/x19.png) Figure 5.:
(a): magnitude distribution of the
known CVs with a HQS HRS spectrum (shaded) and those re-identified as
being a CV (gray). (b): magnitude distribution of the CVs discovered
in the HQS. (c): magnitude distribution of the known CVs
with no HRS spectrum. The dynamic range covered by the HQS is
indicated by the two vertical lines.
Figure 5.:
(a): magnitude distribution of the
known CVs with a HQS HRS spectrum (shaded) and those re-identified as
being a CV (gray). (b): magnitude distribution of the CVs discovered
in the HQS. (c): magnitude distribution of the known CVs
with no HRS spectrum. The dynamic range covered by the HQS is
indicated by the two vertical lines.
The relatively large number of known CVs and CV candidates with published magnitudes in the HQS dynamic range that are not included in the HRS database could suggest that the selection criterion of Hagen et al. (1999), optimized for QSOs, “missed” a significant number of CVs. In order to assess the possibility of a systematic loss, we carefully inspected the nature of the 80 objects with no HRS spectrum, as well as the original plate material at the corresponding coordinates. It turns out that: (a) The majority of the objects with published magnitudes are either very faint or not detected at all on the HQS plates. This is not too surprising, as the quiescent magnitudes of these poorly studied systems are often uncertain and the plate limits vary from field to field in the range mag. (b) About a dozen objects with uncertain identifications/coordinates have no counterpart on the HQS plates, which suggests wrong coordinates or spurious CV candidates. (c) A handful of objects in dense fields were lost due to overlap of the prism spectra. (d) CVs were observed during an outburst or a high state (e.g. ER UMa, Z Cam, AT Cnc), and, hence, their spectra are saturated on the Schmidt plate. (e) Two objects were scanned in the high resolution mode, but later on classified as horizontal branch stars and consequently removed from the HRS database (BK Lyn, X Leo)
We conclude from our analysis of the known CV/CV candidate sample that: (1) % of the known CVs with a secure identification and a quiescent magnitude are included in the HRS database. For fainter quiescent magnitudes (), the fraction of systems with a HRS density spectrum drops rapidly. (2) Our selection scheme correctly identifies practically all CVs with emission line Å on the base of their HRS density spectra. Novalike variables and dwarf novae caught in outburst have density spectra very similar to hot stars, but may be selected as CV candidates because of their variability.
6. Discussion
At present, 50 CVs have been identified in the course of follow-up observations of HQS objects, another 12 systems are very good candidates but need additional spectroscopic confirmation (Fig. 6). Compared to the 84 previously known CVs contained in the HRS database, the new discoveries represent a growth by % of this sample (location in the HQS area, magnitude in the range ). While we are currently refining the process of selecting CV candidates from the HRS database (including the search for double degenerate CVs and low mass transfer polars), we are confident that we missed very few bright CVs () with noticeable Balmer emission lines (EW Å). For 15 of the new CVs, orbital period measurements are available (Fig. 4). Even though a final discussion has to await the knowledge of the period distribution of the entire HQS CV sample, we draw the following – somewhat preliminary – conclusions from the currently available data.
Somewhat surprisingly, only one of the new HQS CVs has an orbital period below the gap, namely the SU UMa type dwarf nova KV Dra = HS 1449+6415 ( min, Nogami et al. 2000), with one additional system lying at the lower edge of the gap ( min, Thorstensen, private communication). Two more systems have orbital periods within the gap, and the remaining 11 systems have orbital periods above 3 h. This result exacerbates the problem of the “missing short period CVs” (Sect. 1), as our survey is especially sensitive to the short period systems because of their characteristic Balmer emission (Sect. 5, see Fig. 4). Considering a conservative faint limit, , our search probes for “typical” short period CVs out to a distance of pc, and, so far, our results exclude the presence of a large population of nearby infrequently outbursting X-ray faint short period CVs unless they have significantly weaker emission lines than, e.g., WZ Sge.
Deeper surveys (e.g. the 2dF survey [see Marsh this volume, p. LABEL:paper_marsh_2df] or the Sloan Digital Sky Survey [see Szkody, this volume, p. LABEL:paper_szkody_sdss]) do find a larger fraction of short-period systems. However, these high galactic latitudes surveys with cut-off limits of reach out to very large heights above the Galactic disc, many hundred pc for long period but low luminosity systems like U Gem, and a few kpc for bright novalike variables like TT Ari. Considering that these systems have a scale height of pc (Patterson 1984), it is clear that the nearby, but intrinsically faint short period CVs overtake the more luminous long period systems in these deep surveys.
While a secure classification of the CVs from the HQS requires additional follow-up observations, our identification spectroscopy suggests that we find rather few new polars. This is consistent with the hypothesis that most bright and nearby polars have been found in the ROSAT All Sky Survey thanks to their intense soft X-ray emission (Thomas & Beuermann 1998).
7. Conclusions
We have initiated a large scale search for new CVs, selecting candidates on the base of their spectroscopic properties in the HQS HRS database. This selection scheme proved to be very efficient in recognizing CVs with emission line spectra, while systems with pure continuum emission can be selected only if sufficient information on their variability is available. Our search has already significantly increased the number of moderately bright high galactic latitude CVs in the northern hemisphere, and produced a number of peculiar CVs that merit additional detailed observational campaigns, e.g. the eclipsing systems HS 0907+1902 ( = GY Cnc) and HS 0455+8315 (Gänsicke et al. 2000 and this volume, p. LABEL:paper_gaensicke_hs0455), or the low mass transfer polars HS 0922+1333 and HS 1023+3900 (Reimers, Hagen, & Hopp 1999; Reimers & Hagen 2000; Schwope et al., this volume, p. LABEL:paper_schwope)
The ultimate aim of our project, a detailed confrontation of the period distribution and the space density of the HQS CV sample with the predictions of the CV evolution theories and population syntheses has to be postponed until the system parameters for the entire set of new CVs have been measured. However, the data collected so far do not support the high space density of short period CVs predicted by the standard scenario.
While our survey, along with several other CV searches (see in this volume: Lott et al., p.LABEL:paper_lott; Marsh et al. p.LABEL:paper_marsh_2df; Szkody et al. p.LABEL:paper_szkody_sdss; Tappert et al. p.LABEL:paper_tappert), will significantly improve our knowledge on the actual space densities of CVs, a number of hypotheses that can avoid too numerous short period CVs have already been proposed (e.g. Shara et al. 1986; Patterson 1998; King & Schenker and Schenker & King, this volume, p. LABEL:paper_king, LABEL:paper_schenker). After a long period of an almost dogmatic standstill, the topic of CV evolution has become a very lively field again.
Acknowledgments.
We would like to thank all the people who contributed observations to this project: H. Barwig. R. Fried, M. Kuduz, D. Nogami, R. Schwarz, A. Staude, P. Szkody. J. Thorstensen is acknowledged for sharing his orbital periods for a number of HQS CVs prior to publication. BTG was supported by DLR/BMBF grant 50 OR 9903 6. The HQS was supported by the Deutsche Forschungsgemeinschaft through grants Re 353/11 and Re 353/22.
References
Bade, N., Engels, D., Voges, W., et al. 1998, A&AS 127, 145
Beuermann, K., Thomas, H.C., Reinsch, K., et al. 1999, A&A 347, 47
Billington, I., Marsh, T.R., & Dhillon, V.S. 1996, MNRAS 278, 673
de Kool, M. 1992, A&A 261, 188
Dobrzycka, D., Dobrzycki, A., Engels, D., & Hagen, H.-J. 1998, AJ 115, 1634
Downes, R.A. 1986, ApJ 307, 170
Downes, R.A., Webbink, R.F., Shara, M.M., et al. 2001, PASP 113, 764
Gänsicke, B.T., Fried, R.E., Hagen, H.J., et al. 2000, A&A 356, L79
Green, R.F., Ferguson, D.H., Liebert, J., & Schmidt, M. 1982, PASP 94, 560
Hagen, H.J., Groote, D., Engels, D., & Reimers, D. 1995, A&AS 111 195
Hagen, H.J., Engels, D., & Reimers, D. 1999, A&AS 134, 483
Hertz, P., Bailyn, C.D., Grindlay, J.E., et al. 1990, ApJ 364, 251
Howell, S.B., Rappaport, S., & Politano, M. 1997, MNRAS 287, 929
Jiang, X.J., Engels, D., Wei, J.Y., Tesch, F., & Hu, J.Y. 2000, A&A 362, 263
Jordan, S. 1997, in White Dwarfs, eds. J. Isern, M. Hernanz, & E. García-Berro (Dordrecht: Kluwer), 397
King, A.R. 1988, QJRAS 29, 1
Kolb, U. 1993, A&A 271, 149
Mickaelian, A.M., Balayan, S.K., Ilovaisky, S.A., et al. 2001, A&A in press
Nogami, D., Engels, D., Gänsicke, B.T., et al. 2000, A&A 364, 701
Patterson, J. 1984, ApJS 54, 443
Patterson, J. 1998, PASP 110, 1132
Politano, M. 1996, ApJ 465, 338
Reimers, D. & Hagen, H.J. 2000, A&A 358, L45
Reimers, D., Hagen, H.J., & Hopp, U. 1999, A&A 343, 157
Ritter, H. 1986, A&A 168, 105
Ringwald, F.A. 1996, in Cataclysmic Variables and Related Objects, eds. A. Evans & J.H. Wood (Dordrecht: Kluwer), 89
Shara, M.M., Livio, M., Moffat, A.F.J., & Orio, M. 1986, ApJ 311, 163
Thomas, H.C., Beuermann, K., Reinsch, K., et al. 1998, A&A 335, 467
Thomas, H.C. & Beuermann, K. 1998, Lecture Notes in Physics 506, 247
Warner, B. 1974, MNAS 33, 21
Wickramasinghe, D.T. & Ferrario, L., 2000, PASP 112, 873