Losing Weight: A KECK Spectroscopic Survey of the Massive Cluster of Galaxies RX J1347114511affiliation: Based in large part on observations obtained at the W.M. Keck Observatory, which is operated jointly by the California Institute of Technology, the University of California and NASA,
Abstract
We present a sample of 47 spectroscopically confirmed members of RX J13471145, the most luminous X-ray cluster of galaxies discovered to date. With two exceptions, all the galaxies in this sample have red colors and red spectral indices, with spectra similar to old local ellipticals. Using all 47 cluster members, we derive a mean redshift of , and a velocity dispersion of km s-1, which corresponds to a virial mass of ⊙ with an harmonic radius of kpc. The derived total dynamical mass is marginally consistent with that deduced from the cluster’s X-ray emission based on the analysis of ROSAT/ASCA images (Schindler et al. 1997), but not consistent with the more recent X-ray analyses of Allen (2000), Ettori, Allen & Fabian (2001) and Allen, Schmidt & Fabian (2002). Furthermore, the dynamical mass is significantly smaller than that derived from weak lensing (Fischer & Tyson 1997) and from strong lensing (Sahu et al. 1998). We propose that these various discrepant mass estimates may be understood if RX J13471145 is the product of two clusters caught in the act of merging in a direction perpendicular to the line of sight, although there is no evidence from the galaxy redshift distribution supporting this hypothesis. Even with this hypothesis, a significant part of the extremely high X-ray luminosity must still arise from non-virialized, presumably shocked, gas. Finally, we report the serendipitous discovery of a lensed background galaxy at which will put strong constraints on the lensing mass determination once its counter-image is securely identified.
keywords:
galaxy: clusters: general — galaxy: clusters: individual (RX J13471145) — galaxies: fundamental parameters — intergalactic medium1 Introduction
As the most massive gravitationally bound objects in the Universe, galaxy clusters are prime targets for studies of structure formation and evolution. In order to use these massive objects as cosmological tools, a good understanding of their mass distribution is required to relate the numerical simulation predictions to the observations. Because of their generic rarity, the most massive clusters constitute in principle the most sensitive cosmological probes, with the the most distant ones providing the tightest constraints, specifically on the value of (e.g., Bahcall & Fan 1998; Ebeling et al. 2001). X-ray selection is currently the most favored technique for finding these massive systems in the Universe because of the very well defined selection criteria. However the most extreme clusters may also be the most unusual cases that may not be present in the current generation of numerical simulations of the Universe. Hence, precise understanding of the most massive clusters is very important in order to derive any useful cosmological constraint.
As an example, MS1054–0321, the highest redshift cluster in the Einstein Medium Sensitivity Survey, is a very massive cluster. Donahue et al. (1998) ascribed a virial mass of M⊙ (for ) to MS1054–0321 based on both its X-ray temperature and a velocity dispersion from a sample of twelve spectroscopic members of km s-1. However, even in this initial study of MS1054–0321, the presence of considerable substructure was noted. More recently, a careful weak lensing analysis using HST images by Hoekstra, Franx & Kuijken (200), a velocity dispersion analysis with a larger sample of spectroscopically confirmed cluster members (78 cluster members, giving km s-1) by van Dokkum et al. (2000), and new observations (Jeltema et al. 2001) all seem to support a value for the virial mass of MS1054–0321 about a factor of two lower.
We focus in this paper on the cluster of galaxies RX J13471145 (=0.451), discovered by ROSAT. This cluster is the most luminous X-ray cluster discovered to date (Schindler et al. 1995) with an intrinsic bolometric X-ray luminosity 111All published values have been adjusted to the common value of km s-1 Mpc-1, and the explicit dependence on is given. of ergs s-1 and a gas temperature of keV from ASCA observations (Schindler et al. 1997). The presumption that this is a high mass object is enhanced by the discovery of two reasonably bright long arcs with lengths of 6 arcsec (see Sahu et al. 1998 for the lensing analysis) and by a clear detection of weak lensing (Fischer & Tyson 1997). More recently, Komatsu et al. (1999) and Pointecouteau et al. (2001) have respectively tried to estimate the cluster mass by the measure of the Sunyaev-Zeldovich (SZ) increment (resp. decrement) at submm (resp. mm) wavelengths.
We present here Keck spectroscopy of galaxies in RX J13471145 which allow us to probe the dynamics of this massive cluster. Section 2 describes the observations and the spectral characteristics of the 47 cluster members. We also report the discovery of a lensed galaxy at . A detailed analysis of the spectra of the cluster members is carried out using spectroscopic indices in §3. In §4, we discuss the results in terms of the dynamical estimate of the mass of this cluster, and compare the derived mass to other mass estimates in §5. We derive a possible model for the mass and dynamics of RX J13471145 in §6. A brief summary and discussion of the prospects for improving our understanding of the mass distribution of this cluster are included in the last section.
For consistency with earlier work, we adopt the cosmology , and km/s/Mpc so that the angular scale at the distance of RX J13471145 is 3.67 kpc/arcsec. Were we to adopt a flat Universe with , the angular scale would increase by % to 4.04 kpc/arcsec.
2 Keck Spectroscopy
Candidate member galaxies in the cluster RX J13471145 were first selected in 1998, as extended objects of appropriate brightness from a stacked -band image (4200 sec) taken with Low Resolution Imaging Spectrograph (LRIS) (Oke et al. 1995). Objects are identified using their J2000 coordinates, so that G47345_4632 has coordinates RA = 13 47 34.5 and Dec = 11 46 32. Absolute astrometric calibration of the field was carried out using the USNO-A V2.0 (Monet et al. 1998).
Beginning in early 2000, we used a color image (made of a and -band image) to select candidates with suitably red color for spectroscopic observations. This significantly enhanced the efficiency of detecting cluster members rather than foreground or background galaxies. However, it has probably introduced a bias favoring the inclusion of elliptical galaxies in our sample. Three slitmasks were used with LRIS, one in 1998 (s), one in 2000 (s), and one in May 2001 (s). The 300 g/mm grating yielding a dispersion of 2.5 Å/pixel with a 1.0 arcsec wide slit (projected width of 4.7 pixels) was used for all masks. The spectra were reduced in a standard way using Figaro (Shortridge 1993) scripts.
Redshifts were determined by centroiding the CaII H and the K lines [JC], as well as using a cross correlation technique (IRAF/RVSAO2.0 package) [JPK]. The results were indistinguishable within the errors. From this analysis, a sample of secure 46 members was isolated, with one additional probable cluster member (C47314_4511) whose spectrum was too noisy to yield an accurate redshift. However, the presence of a detectable 4000 Å break strongly suggests that it belongs to the cluster. Five of the cluster galaxies have two independent spectra taken in different runs; these show no systematic redshift offsets.
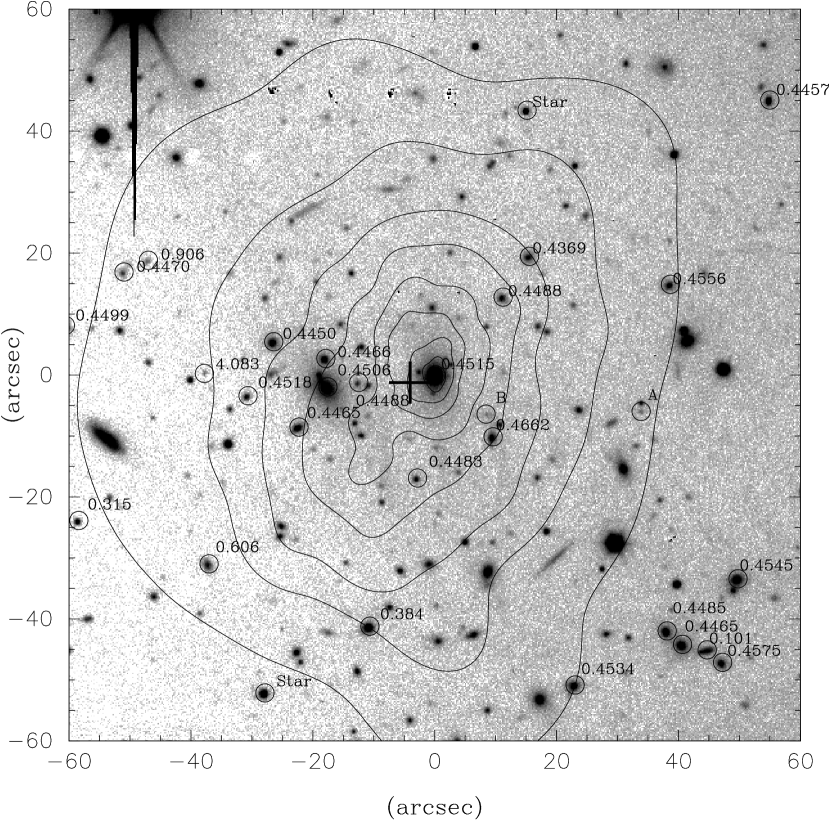
Table 1 gives the location and redshifts for the cluster members, with total magnitudes from the best fit large aperture results from the FOCAS package described in Valdes (1989). Table 2 lists the non-members observed, consisting of 22 field galaxies and their galaxy spectral classification according to the system of Cohen et al. (1999), as well as stars, some of which were used to align the slitmasks. Figure 1 shows the -band image of the central part of RX J13471145, where we have indicated the galaxies in our sample with their redshifts.
The two central cDs have approximately equal -band luminosity, but display very different spectra. The Western cD galaxy, located at the X-ray peak, is an AGN and has been detected as a radio point source by the NVSS (Condon et al. 1998, Bauer et al. 2000). Its spectrum shows extremely strong [OII] 3727 Å emission as well as emission at H. Weaker emission at [OII] at 4959 and 5007 Å as well as H and perhaps H is detected. These emission lines have been observed in the spectra of many giant elliptical galaxies sitting at the center of cooling flow clusters (e.g. Crawford et al. 1995).
The galaxy C47229_4519 has a spectrum very different from any other cluster member. It is, excluding the Western cD, the only cluster galaxy showing even weak [OII] 3727 Å emission, and its redshift () is slightly lower than all but one other cluster member. It is located in the outer part of RX J13471145 and has a blue color. We include it as a cluster member.
Four galaxies (C47229_4519 included) are slightly offset in redshift compared to the main cluster redshift distribution. Perhaps they are either linked to the cluster infall region or are part of the large scale structure surrounding the cluster.
Altogether, the total number of spectroscopically confirmed galaxies in the close vicinity of RX J13471145 is 47. Figure 2 shows the velocity distribution centered on the cluster redshift. Note that there are no other galaxies in the spectroscopically observed sample with .
2.1 Detection of a Lensed Object at
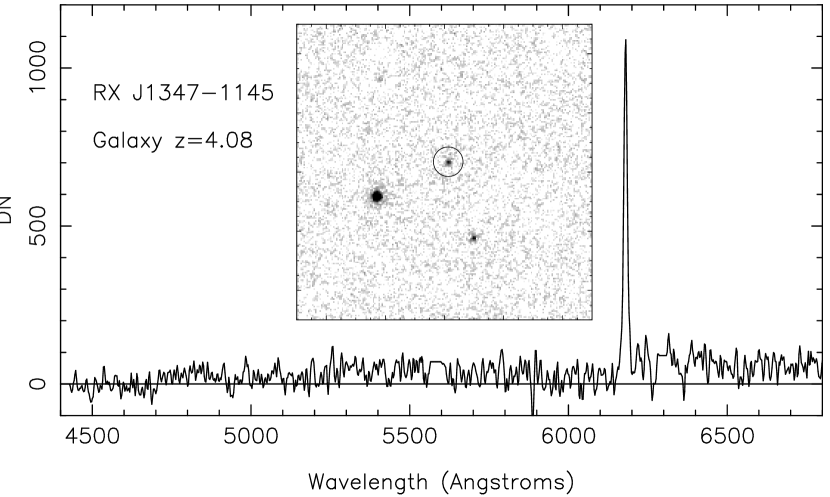
During the spectroscopic survey to locate members of the cluster of galaxies RX J13471145, we serendipitously found an object (O47332_4511) with a strong emission line at 6177 Å and essentially no continuum blue-ward of this line. Identifying the line with Lyman- and the lack of blue continuum as the Lyman limit gives a redshift of (Figure 3), and the equivalent width of Lyman- is 45 Å. This object, with (although the very strong emission falls within the bandpass, it should not contribute to the -band flux by more than 10%) is 38 arcsec East of the Western cD. Its image is a point source on the STIS image from the HST Archive (Figure 3).
3 Spectral Indices
To illustrate that the members of the cluster of galaxies RX J13471145 are typical early type galaxies, we have measured the strengths of various spectral features, the strength of emission in the 3727 Å line of [OII], and the absorption in the 3968 Å line of CaII as well as an index for the strength of the 4000 Å break. Table 3 lists the specific bandpasses used to define each of these indices. The results as a function of total mag are shown in Figures 4, 5 and 6. The possible non-member galaxy C47229_4519 is included in each of these figures.
Aside from the AGN and the possible non-member galaxy, the remaining 45 members of RX J13471145 show no evidence for emission in the 3727 Å line of [OII] (see Figure 4). Repeat measurements suggest an accuracy of Å for the fainter galaxies in our sample. The same two galaxies stand out from the rest of the sample in Figure 5, where they display Balmer jumps considerably smaller than the majority of the cluster galaxies, and in Figure 6, where they have less absorption in the 3933 Å line of Ca II. All of this is to be expected given that one of these galaxies in an AGN and the second appears to be very blue, presumably from ongoing star formation.
4 Velocity Dispersion and Virial Mass
The velocity dispersion was computed using the bi-weight algorithm of Beers, Flynn & Gebhardt (1990), as it is very robust to the presence of outliers. An instrumental uncertainty of km s-1 in the rest frame is assumed for all measurements. The bi-weight estimator gives km s-1 using the 47 known members of the cluster RX J13471145. A slightly smaller value ( km s-1) is obtained using a classical 3-sigma clipping algorithm (which has the effect of removing the four outlier galaxies discussed in §2, which are slightly offset from the main distribution). Hereafter, we adopt a velocity dispersion of 910 km s-1 for this cluster. Assuming that the cluster follows the – relation (e.g. Girardi et al. 1996), we predict an X-ray temperature of keV.
The central redshift for the velocity distribution is . The redshift of the Eastern and Western cDs are respectively and , both of which correspond to rest frame radial velocities that are within 100 km s-1 of the central value. Therefore, taking into account the measured uncertainties, they are both consistent with being at rest at the dynamical center (in the line of sight direction); however we can not speculate on any transverse velocities.
The centroid of the galaxy distribution appears to be closer to the Western cD, rather than to the point half way between the two cDs, which are 18 arcsec apart. Thus, we adopt the position of the AGN as the dynamical center of the cluster, as it is also corresponds to the X-ray peak.
As Figure 2 shows, the velocity distribution appears to be that of a Gaussian. A K-S test shows that the probability that the observed velocity distribution for the members of the cluster RX J13471145 and the fit Gaussian are the same exceeds 98%. There is no evidence in our sample of any deviation of the distribution of the radial velocities from a single Gaussian.
We computed the harmonic radius (e.g., Saslow 1985, Nolthenius & White 1987) for our spectroscopic cluster members as
| (1) |
where is the angular distance between galaxies and , is the number of cluster members, and is the angular diameter distance at the mean cluster redshift . The cluster virial mass can then be estimated as
| (2) |
We found an harmonic radius of kpc and a mass M⊙. This value is somewhat larger than that derived from the measured alone using the fits of Arnaud & Evrard (1999) to the simulations of Evrard et al. (1996) for the mass within a region whose density is 200 times the critical density, ⊙.
The fact that most members of our sample of galaxies in RX J13471145 are red ellipticals argues that the dynamical estimate is a secure estimate of the cluster’s mass.
5 Comparison of the Virial Mass With Other Mass Estimators
Measurements of cluster masses deduced from X-ray emission are based on the assumption that the X-ray emitting gas is in hydrostatic equilibrium with the gravitational potential of the cluster. The constant keV temperature measured from ASCA data by Schindler et al. (1997) corresponds, using the relation of Girardi et al. (1996) (as we do throughout), to a velocity dispersion of km s-1. With this , Schindler et al. (1997) deduced from the ROSAT images of RX J13471145 a gas mass of h⊙ and a total binding mass of h⊙ within a radius of 500 kpc.
X-ray mass determinations are usually given as a mass enclosed within a specified radius. We adopt a power law for the spatial distribution of galaxies within a cluster to determine the conversion between the harmonic radius and the outer radius, . Kent & Gunn (1982) found is the appropriate power law to characterize the distribution of galaxies in the Coma Cluster, and we adopt that value. Ignoring a central core extending to , the harmonic radius is then 0.49, and this fraction decreases for an even steeper density drop-off or as more of the core is included. Thus the area surveyed by our optical sample, with kpc, is roughly comparable to an X-ray mass specified within 1 Mpc.
RX J13471145 has a large cooling flow ( M⊙/year). Its high luminosity and mass are confirmed by the recent analysis of BeppoSAX observations of this cluster by Ettori et al. (2001), who focus on the cluster gas temperature and the impact of the large cooling flow in its central region. They find, confirming Allen (2000), a gas temperature of keV, but not as large as the very high value of 26.4 keV of Allen (1998).
The recent /ACIS RX J13471145 image (a 20 ksec exposure we extracted from the archive) shows an extended source whose center coincides with the AGN (the Western of the two central cDs) to within 0.8 arcsec (the relative astrometry was checked using the only X-ray point source overlapping with our LRIS image, which was identified with a faint field galaxy). Taking into account all the astrometric uncertainties, the Western cD and the X-ray peak are consistent with both being at exactly the same position. The contribution of the AGN itself to the total X-ray flux is likely to be small. A more detailed analysis of these data by Allen, Schmidt & Fabian (2002) leads again to a very high X-ray temperature, keV, which corresponds to km s-1.
The SZ results of Pointecouteau et al. (2001) lead to projected gas mass of h-5/2 M⊙ within an angular radius of 74 arcsec (272 kpc) assuming a spherical distribution for the gas. This value is in reasonable agreement with the X-ray determination for the gas mass in this cluster.
The virial mass of RX J13471145 can be compared to the mass derived from weak lensing of Fischer & Tyson (1997) of ⊙ within the same 1 Mpc radius for this cluster. Assuming an isotropic velocity distribution, the weak lensing results translate into a predicted velocity dispersion of km s-1 (Fischer & Tyson 1997).
The strong lensing analysis for one of the central arcs by Sahu et al. (1998) also suggests a very high mass.222We have confirmed their redshift for the brightest arc, but failed to obtain any credible redshifts for the fainter arcs in RX J13471145. They derive the projected mass within the radius of the arcs, 38 arcsec (140 kpc), and obtain ⊙, which corresponds to roughly 1300 km s-1 for a singular isothermal sphere. This mass estimate assumes that the arc seen in RX J13471145 is located at the Einstein radius, but no multiple images were identified in this analysis. Thus the derived strong lensing mass estimate should be considered as an upper limit.
We thus see that our measured velocity dispersion for the X-ray luminious and massive cluster of galaxies RX J13471145 is significantly smaller than that inferred from the X-ray or SZ measurements or from both weak and strong lensing studies. Table 4 summarizes the current discrepant situation, in terms of the velocity dispersion, X-ray temperature or total projected mass within some specified radius. The various measurements have been converted assuming the relation of Girardi et al. (1996); the values so derived are given in brackets in columns 3 and 4 of this table.
5.1 The Lensed Object at
We attempt to use the lensed high redshift galaxy we have discovered in this cluster to constrain its mass. With the aid of simple lensing mass models (following the precepts of Kneib et al. 1996), we have identified two faint objects with the appropriate morphology that might be counterparts of this object: O47283_4517 and O47300_4517 (objects A and B respectively, marked in Fig. 1). These models assume that the object is multiply imaged by the cluster, but this needs to be confirmed in the future; at present we lack the necessary color and spectroscopic information for objects A and B. If we accept either of these two objects marked in Figure 1 as a possible counter-image of the object, a strong lensing analysis suggests a much smaller total projected mass within a 38 arcsec (140 kpc) radius centered on the Western cD compared to the previous lensing analysis. We find a mass of M⊙ for O47300_4517 (which would correspond to 850 km s-1 for a singular isothermal sphere) and M⊙ for O47283_4517 ( 1000 km s-1 for a similar model). Both mass models are made of two massive cluster scale components centered respectively on each of the two central cDs. The latter case (object A) is more likely to be correct, as in the former, the observed flux ratio between the two images is different than the one predicted by the lens model. Both of these mass estimates are much smaller than the previous weak or strong lensing estimates and both are consistent with our dynamical estimate.
6 RX J13471145 Viewed As A Merger
We are quite confident of our measured velocity dispersion for the galaxies in RX J13471145. However, as discussed in §5, it is considerably smaller than would be expected from the X-ray, SZ, or lensing analyses of this cluster of galaxies. If we accept all published measurements of , SZ decrements and lensing shears as valid, the only way we see to reconcile all the data is for RX J13471145 to be involved in a major merger in the plane of the sky (hence barely affecting the dynamical mass estimate). The probability that such a collision might occur is proportional to the solid angle subtended by a collision “primarily in the plane of the sky”, which, for relative velocity vectors from the plane of the sky, is 50%.
A merger with this geometry could explain the origin of the various discrepant temperature measurements for this cluster. For multiple merging clumps along a line of sight, the weak lensing signal adds linearly. Hence, irrespective of whether RX J13471145 is in the process of a merger, the weak lensing mass estimate should yield the correct total mass for the cluster. The dynamical mass estimate, however, will be biased toward the mass of the larger clump, at least until the merger is complete and the galaxy orbits have virialized to the new total cluster mass. Given the substantial uncertainties on the weak lensing mass measurement of Fischer & Tyson (1997), it is just possible to reconcile the values given in Table 4 for the dynamical and weak lensing mass if the masses of the two hypothetical clumps ( and , with ) are comparable, with .
Turning to the X-ray measurements, the observed values of are very high compared to our dynamical galaxy velocity dispersion. It is likely that the X-ray emitting gas virializes more rapidly in the course of a merger than do the galaxies, and hence might reflect the new total mass of the cluster before the galaxy velocity dispersion would do so. To reproduce the observations with a merger hypothesis, we require equal mass clumps333We assume that the probability of a merger involving three or more equal mass clumps is so low that we can ignore such events., a merger primarily in the plane of the sky, and also a time chosen so that the X-ray gas has virialized to the new cluster total mass but the galaxies have not. Even with this somewhat contrived scenario, it is still not possible to reconcile our dynamical mass with the most recent X-ray analysis (Allen et al. 2002) unless the optical velocity dispersion has been underesimated by at least 2, while has been overestimated by 2. Many of the other recent X-ray analyses of RX J13471145 yield even higher values of .
Continuing under the assumption that all published measurements are correct, we see that substantial X-ray emission from gas that has not yet virialized, presumably from shocks associated with the hypothesized merger, is still required to reproduce the X-ray emission of RX J13471145. Theoretical support for such is given by the hydrodynamic simulations of Ritchie & Thomas (2001), who demonstrate that X-ray luminosity and/or temperature may be strongly enhanced in merging clusters.
Another clue often used to detect mergers in clusters of galaxies is the presence of substructure. Among local clusters, for example, Schuecker et al. (2001) find that 50% of a sample of the nearest clusters of galaxies show evidence for substructure, presumably arising from recent mergers, based on their ROSAT images. Turning to dynamical studies, the Coma cluster (Colless & Dunn 1996) and the Cl0024+1654 cluster, studied in detail by Czoske et al. (2001), among many others, both show evidence of substructure. However, in the above two cases, structure is detected within the velocity (redshift) distribution which is several times larger than the upper limit we assign to that of the galaxies in RX J13471145. The lack of velocity structure in the velocity histogram of RX J13471145 strongly suggests that there is no substructure in the line of sight direction.
There is, however, some evidence for substructure in RX J13471145. The most recent X-ray map (from ACIS/, shown as an overlay in Figure 1) is to first order circularly symmetric with a probable extension to the SE and extends to a radius 240 arcsec, a region comparable in size to that of the optical spectroscopic sample presented here. (See Allen et al. 2002 for a more detailed discussion.) A similar SE extension is seen in the SZ decrement map of Pointecouteau et al. (2001); it is in fact the most prominent peak of the SZ map, arguing for a very high temperature for this clump as well as in the map of Komatsu et al. (2001).
7 Summary
Based on 47 spectroscopically confirmed cluster members, we have determined the virial mass of RX J13471145, the most luminous X-ray cluster known. This mass estimate is much lower than the most recent X-ray, SZ and lensing mass estimates. Note that the case of RX J13471145 is not unique and that a number of massive clusters are poorly understood. All methods of determining the mass of a cluster of galaxies suffer some bias, which if understood should allow us to understand cluster physics.
In order to reconcile all the published data on RX J13471145, we suggest that this cluster is undergoing a major merger primarily in the plane of the sky. We further suggest that the extremely high X-ray luminosity of this cluster does not denote an extremely high mass.
This merger assumption, although attractive, needs to be confirmed. As indicated above, in our present sample of 47 spectroscopically confirmed cluster members, there is no evidence for a merger. A detailed 3D analysis of the cluster dynamics would require a significantly larger sample of spectroscopically confirmed members of the cluster, quite difficult to obtain. If deep HST/ACS images are obtained, we will be able verify candidate counter-images and to model accurately the lensing distortion and multiple images to provide additional constraints on the mass distribution within RX J13471145.
Large scale programs to search for distant clusters of galaxies are underway using both X-ray and optical techniques to find distant clusters. We need to understand how to measure the mass of clusters accurately before the comparison of cluster samples at low and high redshift can be used to constrain cosmology with any degree of precision. The massive, X-ray luminous cluster RX J13471145 is a perfect case to try to understand how to do this.
Acknowledgements.
The entire Keck/LRIS user community owes a huge debt to Jerry Nelson, Gerry Smith, Bev Oke, and many other people who have worked to make the Keck Telescope and LRIS a reality. We are grateful to the W. M. Keck Foundation for the vision to fund the construction of the W. M. Keck Observatory. The authors wish to extend special thanks to those of Hawaiian ancestry on whose sacred mountain we are privileged to be guests. Without their generous hospitality, none of the observations presented herein would have been possible. The archival STIS data was retrieved from the STScI archive and was taken with the NASA/ESA Hubble Space Telescope, which is operated by STScI for the Association of Universities for Research in Astronomy, Inc., under NASA contract NAS5-26555. The archival ACIS/ data was retrieved from the Data Archive, which is part of the X-Ray Science Center, operated for NASA by the Smithsonian Astrophysical Observatory. We are grateful to Oliver Czoske, Phil Fisher and Piet van Dokkum for useful discussions and suggestions. JPK thanks the CNRS for support.References
- (1)
- (2) Allen, S. W., 1998, MNRAS, 296, 392
- (3)
- (4) Allen, S. W., 2000, MNRAS, 315, 269
- (5)
- (6) Allen, S.W., Schmidt, R.W. & Fabian, A.C., 2002, MNRAS (in press) (Astro-ph/0111368)
- (7)
- (8) Arnaud, M. & Evrard, G., 1999, MNRAS, 305, 631
- (9)
- (10) Bahcall, N. A. & Fan, X. H., 1998, ApJ, 504, 1
- (11)
- (12) Bauer, F.E., Condon, J.J., Thuan, T.X. & Broderick, J.J., 2000, ApJS, 129, 547
- (13)
- (14) Beers, T. C., Flynt, K. & Gebhardt, K., 1990, AJ, 100, 32
- (15)
- (16) Cohen, J. G., Hogg, D. W., Pahre, M. A., Blandford, R., Shopbell, P. L. & Richberg, K., 1999, ApJS, 120, 171
- (17)
- (18) Colless, M.M. & Dunn, A.M., 1996, ApJ, 458, 435
- (19)
- (20) Crawford, C. S., Edge, A. C., Fabian, A. C., Allen, S. W., Bohringer, H., Ebeling, H., McMahon, R. G., & Voges, W. 1995, MNRAS, 274, 75
- (21)
- (22) Condon, J.J., Cotton, W.D., Greisen, E.W., Yin, Q.F., Perley, R.A., Taylor, G.B. & Broderick, J.J., 1998, AJ, 115, 1693
- (23)
- (24) Czoske, O., Moore, B., Kneib, J. P., Soucail, G., 2001, A&A, submitted, (astro-ph/0111118)
- (25)
- (26) Donahue, M., Voit, G.M., Gioia, I., Luppino, G., Hughes, J.P. & Stocke, J.T., 1998, ApJ, 502, 550
- (27)
- (28) Ebeling, H., Edge, A.C. & Henry, J.P., 2001, ApJ, 553, 668
- (29)
- (30) Ettori, S., Allen, S.W. & Fabian, A.C., 2001, MNRAS, 322, 187
- (31)
- (32) Evrard, G., Metzler, C.A. & Navarro, J.F., 1996, ApJ, 469, 494
- (33)
- (34) Fischer, P. & Tyson, J.A., 1997, AJ, 114, 14
- (35)
- (36) Girardi, M., Fadda, D., Giuricin, G., Mardirossian, F. & Mezzetti, M., 1996, ApJ, 457, 61
- (37)
- (38) Hoekstra, H., Franx, M. & Kuijken, K., 2000, ApJ, 532, 88
- (39)
- (40) Irwin, J. A. & Bregman, J. N., 2000,ApJ, 538, 543
- (41)
- (42) Jeltema, T.E., Canizares, C.R., Bautz, M.W., Malm, M.R., Donahue, M. & Garmire, G.P., 2001, ApJ, 562, 124
- (43)
- (44) Kent, S. M. & Gunn, J. E., 1982, AJ, 87, 945
- (45)
- (46) Kneib, J. P., Ellis, E. S., Smail, I., Couch, W. J. & Sharples, R. M., 1996, ApJ, 471, 643
- (47)
- (48) Komatsu, E. et al., 1999, ApJ, 516, L1
- (49)
- (50) Komatsu, E. et al., 2001, PASJ, 53, 57
- (51)
- (52) Monet, D.G. et al., 1998, USNO-A2.0 Catalog (on CD-ROM) (Flagstaff:USNO)
- (53)
- (54) Nolthenius, R. & White, S.D.M., 1987, MNRAS, 235, 505
- (55)
- (56) Oke, J. B., Cohen, J. G., Carr, M., Cromer, J., Dingizian, A., Harris, F. H., Labrecque, S., Lucinio, R., Schaal, W., Epps, H., & Miller, J. 1995, PASP, 107, 307
- (57)
- (58) Pointecouteau, E., Giard, M., Benoi, A., Desert, F.X., Bernard, J.P., Coron, N. & Lamarre, J.M., 2001, ApJ, 552, 42
- (59)
- (60) Ritchie, B.W. & Thomas, P.A., 2001, MNRAS, in press (Astro-ph/0107374)
- (61)
- (62) Sahu, K. et al., 1998, ApJ, 492, L125
- (63)
- (64) Saslow, W.C., 1985, Gravitational Physics of Stellar and Galactic Systems, Cambridge University Press
- (65)
- (66) Schuecker, P., Böhringer, H., Reiprich, T.H. & Feretti, L., 2001, A&A, 378, 408
- (67)
- (68) Schindler, S., Guzzo, L., Ebeling, H., Böhringer, H, Chincarini, G., Collins, C.A., DeGrandi, S., Neumann, D.M., Briel, U.G., Shaver, P. & Vettolani, P., 1995, A&A, 299, L9
- (69)
- (70) Schindler, S., Hattori, M., Neumann, D.M. & Böhringer, H., 1997, A&A, 317, 646
- (71)
- (72) Shortridge, K., 1993, The Figaro 2.4 Manual
- (73)
- (74) Valdes, F., 1989, in First ESO/ST-EF Data Analysis Workshop , ed. P.J.Grosbol, F.Murtagh & R.W. Warmels
- (75)
- (76) van Dokkum, P.G., Franx, M., Fabricant, D., Illingworth, G.D. & Kelson, D.D., 2000, ApJ, 541, 95
- (77)
| Galaxy IDaaGalaxy names are based on their coordinates, Cxxyyy_wwzz has the position 13 xx yy.y 11 ww zz, epoch J2000. | Galaxy IDaaGalaxy names are based on their coordinates, Cxxyyy_wwzz has the position 13 xx yy.y 11 ww zz, epoch J2000. | ||||
|---|---|---|---|---|---|
| (Mag) | (Mag) | ||||
| C47223_4714 | 0.4494 | 21.98 | C47230_4432 | 0.4575 | 21.82 |
| C47236_4646 | 0.4560 | 21.34 | C7238_4437 | 0.4503 | 22.16 |
| C47243_4419 | 0.4410 | 22.16 | C47251_4429 | 0.4532 | 21.61 |
| C47251_4556 | 0.4460 | 21.32 | C47254_4530 | 0.4490 | 21.29 |
| C47261_4521 | 0.4502 | 21.25 | C47265_4528 | 0.4604 | 21.10 |
| C47268_4342 | 0.4480 | 21.82 | C47269_4424 | 0.4457bbThere are two independent spectra for this galaxy. | 21.34 |
| C47272_4543 | 0.4545 | 20.28 | C47274_4556 | 0.4575 | 21.08 |
| C47278_4553 | 0.4465 | 20.31 | C47280_4551 | 0.4485 | 20.68 |
| C47280_4454 | 0.4556bbThere are two independent spectra for this galaxy. | 21.18 | C47290_4600 | 0.4534 | 20.90 |
| C47296_4450 | 0.4369bbThere are two independent spectra for this galaxy. | 21.32 | C47299_4456 | 0.4488 | 21.63 |
| C47300_4519 | 0.4662 | 21.42 | C47306_4509ccThis is the Western of the two central cDs. | 0.4515 | 18.52 |
| C47307_4319 | 0.4526 | 21.26 | C47308_4526 | 0.4483 | 22.11 |
| C47314_4511 | …eeGalaxy on extreme edge of slitlet. Spectrum shows this is a cluster member, but redshift not sufficiently accurate to use for vel. dispersion. | 21.64 | C47315_4510 | 0.4488 | 21.86 |
| C47318_4511ddThis is the Eastern of the two central cDs. | 0.4506 | 18.57 | C47319_4507 | 0.4466 | 20.74 |
| C47319_4616 | 0.4533 | 22.01 | C47321_4352 | 0.4510 | 20.80 |
| C47322_4518 | 0.4465 | 21.33 | C47323_4709 | 0.4550 | 21.53 |
| C47324_4350 | 0.4646 | 20.30 | C47324_4504 | 0.4450 | 20.77 |
| C47327_4513 | 0.4518bbThere are two independent spectra for this galaxy. | 22.01 | C47328_4614 | 0.4460 | 21.00 |
| C47341_4452 | 0.4470bbThere are two independent spectra for this galaxy. | 22.08 | C47348_4501 | 0.4499 | 20.97 |
| C47357_4502 | 0.4474 | 21.48 | C47369_4434 | 0.4481 | 21.12 |
| C47375_4447 | 0.4512 | 21.33 | C47382_4444 | 0.4495 | 19.72 |
| C47384_4435 | 0.4523 | 21.41 | C47395_4428 | 0.4579 | 21.84 |
| C47400_4533 | 0.4443 | 22.08 | C47408_4523 | 0.4528 | 21.87 |
| C47417_4449 | 0.4557 | 20.02 | C47232_4518ffProbable member. | 0.4392 | 21.81 |
| Galaxy IDaaObject names are based on their coordinates, Cxxyyy_wwzz has the position 13 xx yy.y 11 ww zz, epoch J2000. | Spec. TypebbThe system of galaxy spectral types used is described in Cohen et al. (1999). | Galaxy IDeefootnotemark: | Spec.TypebbThe system of galaxy spectral types used is described in Cohen et al. (1999). | ||||
|---|---|---|---|---|---|---|---|
| (Mag) | (Mag) | ||||||
| O47234_4513 | 20.10 | 0.253 | , | O47240_4633 | 20.99 | 0.614 | |
| O47244_4604 | 0.607 | O47259_4441 | 20.38 | 0.695 | |||
| O47265_4528 | 20.92 | 0.299 | O47274_4351 | 20.88 | star | ||
| O47276_4555 | 21.34 | 0.101 | O47291_4329 | 21.49 | star | ||
| O47296_4426 | 21.28 | star | O47314_4551 | 20.53 | 0.384 | ||
| O47326_4602 | 20.90 | star | ccThis object has the spectrum of a M subdwarf. | O47332_4511 | 23.7 | 4.083 | |
| O47332_4540 | 21.52 | 0.606 | O47335_4623 | 20.68 | star | ||
| O47335_4713 | 21.30 | star | O47339_4451 | 23.24 | 0.906 | ||
| O47346_4533 | 21.78 | 0.315 | O47346_4643 | 21.52 | star | ||
| O47354_4645 | 22.11 | 0.399 | , | O47376_4706 | 23.03 | 0.400 | |
| O47380_4821 | 22.05 | 0.721 | O47390_4552 | 21.42 | 0.183 | , | |
| O47390_4603 | 21.42 | 0.578 | O47393_4351 | 21.25 | 0.348 | ||
| O47410_4253 | 20.87 | 0.348 | O47411_4340 | 19.70 | 0.348 | ||
| O47419_4449 | 21.12 | 0.539 | , | O47455_4853 | 22.18 | 0.543 | , |
| O47480_4514 | 21.55 | 0.361 | , |
| Feature Name | Feature | Blue Continuum | Red Continuum |
|---|---|---|---|
| (Å) | (Å) | (Å) | |
| 3727 Å [OII] Emission | 3712 – 3742 | 0.5(3713 – 3741) | 0.5(3742 – 3801) |
| 3933 Å Ca II Absorption | 3918 – 3948 | 0.4(3500 – 3670) | 0.6(4030 – 4090) |
| D4000 (Break)aaThis index is the ratio of the average flux in the shorter wavelength bandpass to that in the longer. | … | 3850 – 3950 | 4000 – 4100 |
| Reference | Method | Mass | Radius | ||
|---|---|---|---|---|---|
| (km s-1) | (keV) | (1014 M⊙) | ( kpc) | ||
| X-ray | |||||
| Schindler et al. (1997) | (ROSAT/ASCA) | [1320] | 9.3 | 2.9 / 8.5 | 500 / 1500 |
| Allen (1998) | (ROSAT/ASCA) | [2500] | 26.4 | 36 | 1000 |
| Allen (2000) | (ROSAT/ASCA) | 1850 | 10.4 – 26.4 | … | 880 |
| Ettori et al. (2001) | (BeppoSax) | [1635 – 2250] | 13.2 – 22.3 | … | 1300aaThis is the radius of the aperture used, but the instrumental PSF is very broad. |
| Allen et al. (2002) | (Chandra) | [1545] | 12.0 | … | 1000 |
| Lensing | |||||
| Fischer & Tyson (1997) | weak lensing | 1500 | [11.5] | 11 | 1000 |
| Sahu et al. (1998) | strong lensing | 1300 | [9.1] | 3.4 | 140 |
| This Paper | strong lensing | 850 / 1000 | [4.5 / 5.9] | 1.4 / 1.9 | 140 |
| Galaxy | |||||
| This Paper | galaxy | 910 | [5.1] | 4.4 | 380 |