[
Cross-Correlation of the Cosmic Microwave Background with Radio Sources: Constraints on an Accelerating Universe
Abstract
We present a new limit on the cosmological constant based on the absence of correlations between the cosmic microwave background (CMB) and the distribution of distant radio sources. In the cosmological constant-cold dark matter (CDM) models currently favored, such correlations should have been produced via the integrated Sachs-Wolfe effect, assuming that radio sources trace the local () matter density. We find no evidence of correlations between the COBE 53Hz microwave map and the NVSS 1.4 GHz radio survey, and obtain an upper limit for the normalized cross-correlation of at the 95% CL. This corresponds to an upper limit on the cosmological constant of which is in marginal agreement with the values suggested by recent measurements of the CMB anisotropy and type-IA supernovae observations, If the cosmological model does lie in this range, then the integrated Sachs-Wolfe effect should be detectable with upcoming CMB maps and radio surveys.
pacs:
PACS numbers: 98.80.Es, 95.85.Nv, 98.70.Vc, 98.65.-r]
Recent observations of supernovae light curves [1] suggest that the expansion of the universe is accelerating rather than decelerating. Combined with evidence from the cosmic microwave background (CMB) [2, 3, 4] and a number of other observations [5], this suggests the universe is spatially flat and dominated by a cosmological constant, , where is the Hubble expansion parameter. Such a low value of is difficult to explain from fundamental grounds, so it is vital that we try to confirm this result by other means.
CMB anisotropies can arise via the integrated Sachs-Wolfe effect (ISW)[6] as the photons travel through the time-dependent gravitational potentials of collapsing structures. One consequence of a large cosmological constant is that such time-dependent potentials exist even on very large scales where the collapse is linear, which is not the case for a flat, matter dominated universe. These fluctuations are likely to be small compared to those imprinted at the surface of last scattering (redshifts ) and are difficult to detect directly, however, they can be observed by looking for spatial correlations between the CMB and the nearby matter density[7, 8]. This requires a probe of the matter density out to redshifts of and suggested candidates include radio galaxies, quasars and the x-ray background.
Other processes can also lead to correlations between the CMB and the local matter density. These include gravitational lensing, scattering from hot electrons (the Sunyaev-Zeldovich effect) and photons passing through the time-dependent potentials of non-linear collapsing structures (the Rees-Sciama effect). While the study of these effects can also benefit from cross correlation analyses [9], the ISW effect is unique in that it occurs on very large scales () where the fluctuations are simple and linear.
In the first attempt to detect this effect, Boughn, Crittenden, and Turok [10] cross-correlated the CMB with the hard (2 keV) x-ray background, which is thought to arise primarily from active galactic nuclei out to a redshift of [11]. A COBE-DMR CMB map [12] was cross-correlated with the HEAO1 x-ray map [13] and no significant correlation between the two maps was found. The interpretation of this result is difficult since there has been no unambiguous measurement of correlations in the x-ray background, so the x-ray bias factor, the extent to which x-rays trace matter, is largely unknown. For a large x-ray bias, , the implication is that , in conflict with the currently favored cold dark matter (CDM) cosmological model; for no biasing, , the limit is much weaker: [10]. The true bias may well be time dependent and will not be known until the structure in the x-ray background is definitively detected.
Here we attempt to detect the ISW effect by cross-correlating the CMB with a deep radio source survey. While the Poisson noise due to the finite number density of radio sources is relatively large, this analysis has the advantage that the clustering properties of the radio sources have been measured and so the bias factor for these sources can be deduced within the context of a particular cosmological model.
The small correlations introduced by the ISW effect can be contaminated by accidental correlations of the locations of radio sources with the relatively large CMB fluctuations that originate at higher redshift. To minimize these accidental correlations, it is necessary to average over many statistically independent regions of the sky. Since the ISW correlations are on angular scales of several degrees, this means using surveys that cover as much of the sky as possible, even if they have more noise than smaller area surveys. Thus, in the radio we use the NVSS radio source survey (82% sky coverage) and for the CMB we use the 4-year COBE 53GHz map (full sky coverage.) The 31 GHz and 90 GHz companion maps both have significantly higher noise, as do the combination maps constructed by the COBE team to minimize Galactic emission. Above a Galactic latitude of , the NVSS source counts are essentially all extra-Galactic. Prior to cross-correlating the two data sets, a secant law Galaxy model and a dipole (the largest structure in the 53 GHz map) were fit and removed. The effect of these corrections was minimal.
The NRAO VLA Sky Survey (NVSS) is a Jansky () flux limited survey at a frequency of 1.4 GHz [14]. It is complete for declinations and contains sources, with a mean source number density of 51.8 per square degree. While the distances of individual sources are largely unknown, typical luminosity function models (e.g.,[15, 16]) indicate they are distributed in the redshift range with a peak in the distribution at . This distribution, combined with the nearly full-sky coverage, renders the NVSS survey an ideal matter density probe with which to investigate the ISW effect.
The NVSS survey was converted into a map using an equatorial quadrilaterized spherical cube projection [17], the standard format for the COBE data. Those pixels that were only partially contained in the survey region were omitted. In making these maps, we discovered that the surface density of sources varied by within several declinations bands. The more prominent of these bands coincide with discontinuous changes in the rms noise levels in the NVSS survey [14]. To correct for this, random sources were added to or subtracted from each pixel to eliminate the band structure. The resulting map shows no declination dependent structure at level of . For comparison, the Poisson noise per pixel is .
In order to exclude Galactic sources as well as nearby clusters of galaxies, the region within of the Galactic plane was removed as were 29 regions that contained pixels with source counts greater than () above the average. This procedure cleaned the map of 10 “objects” located more than from the Galactic plane. Among these are the Orion Nebula and the nearby Virgo, Perseus, and Fornax clusters. That the moderately nearby, rich Coma cluster of galaxies was not one of the regions cut indicates to us that this windowing removed only Galactic and nearby extra-galactic sources.
After the cleaning and correction operations, the map was repixelized by combining groups of four pixels into larger pixels. The angular resolution of the COBE map is and this coarser pixelization is the standard format provided for the COBE DMR data sets. Each of the larger pixels was assigned a weight corresponding to the number of subpixels contributing to it and its value was multiplied by to achieve the proper normalization. The radio source auto-correlation function (ACF) was computed according to
| (1) |
where the sums are over all pairs of pixels with angular separation , is the mean number of sources and is the pixel weighting factor. The measured ACF is displayed in Figure 1 with error bars that were deduced from Monte Carlo simulations.
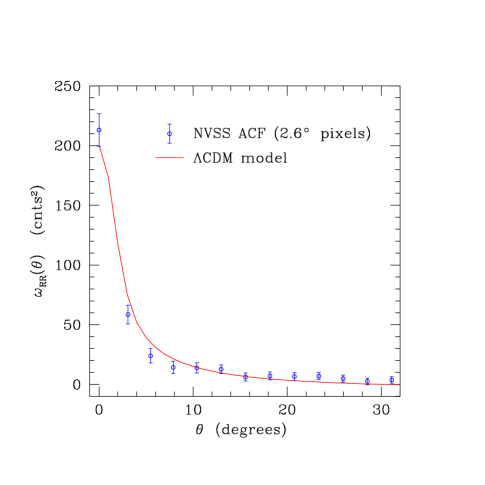
The effect of the above mentioned declination band corrections on the ACF was considerable. For the ACF of the corrected map is 2–3 times smaller than that of the uncorrected map. This is not unexpected given the prominent band structure in the uncorrected map. To test the sensitivity of the ACF to our corrections, more aggressive band removal was effected by adding (and subtracting) sources at random from even more narrow declinations bands (, , and ) in order to force the mean number densities in these bands to be equal. In all such cases, the ACF’s were not significantly different from that of Figure 1. We conclude that our ACF is reasonably robust.
One can determine the radio source bias factor by comparing the measured ACF to the mass density correlation predicted theoretically assuming the COBE normalization and a given cosmological model. The curve in Figure 1 is the prediction of a sample CDM cosmology convolved with window functions for the quad-cubed pixelization. The inferred radio bias parameter depends on the exact cosmology, as is shown in Figure 3, but we find typical values in the range Since we compare on very large angular scales where the fluctuations are linear, the inferred biases are independent of the vagaries of non-linear structure formation.
An essential ingredient in interpreting the auto- and cross-correlations is the source number-redshift distribution, . The distribution used in Figure 1 was derived from a radio source luminosity function (LF) of Dunlop and Peacock (mean- model 1) [16]. This LF is consistent with flux limited number counts of the present NVSS survey as well as with recent, deep redshift surveys [18]. The mean- model 3 of Dunlop and Peacock and the model of Condon [15] are also reasonably consistent with the data and were also considered. The bias factors deduced from these latter two LFs are within of that deduced above, which indicate that the results are not overly sensitive to the details of or the LF.
We can compare our results to the ACF of the FIRST radio survey, which was determined by Cress et al. [19] and Magliocchetti et al. [20] to be for where is in degrees. While the FIRST survey is somewhat deeper () than the NVSS survey, the luminosity function is such that the redshift distribution of these sources is nearly identical to that of the NVSS sources [14]. Therefore, one expects the ACFs for these two surveys to be nearly the same. When converted to the the pixelization used in this paper, these results are consistent with that in Figure 1.
The cross-correlation function (CCF) of the radio and CMB maps was computed using
| (2) |
where and are the temperature and the noise variance of the pixel in the CMB map, is the mean CMB temperature, and the radio variables are defined as before. The COBE instrument noise is significant and the pixels were weighted accordingly in Eq. 2. However, if the pixels are weighted uniformly, the resulting CCF does not change significantly.
While there may be unaccounted for systematics, it seems unlikely that these will be correlated in two such disparate maps. This is born out by the insignificant differences in the cross-correlation functions computed both with and without correcting the NVSS map for the declination band structure and with and without correcting the CMB map for both a secant law Galaxy and a quadrupole moment.
The CCF is plotted in Figure 2 and is consistent with the data sets being uncorrelated. The effect of removing the dipole and secant law Galaxy model from the CMB map was investigated by cross-correlating a set of Monte Carlo simulations in which a small correlated component having the same profile as the CDM CCF was added to larger components that match the ACFs of the two maps. The results indicate that the dipole/secant law corrections significantly attenuate the CCF but only for separations, . Therefore, these data were ignored in the subsequent analysis. The error bars in Figure 2 were computed from the Monte Carlo trials and are highly correlated.
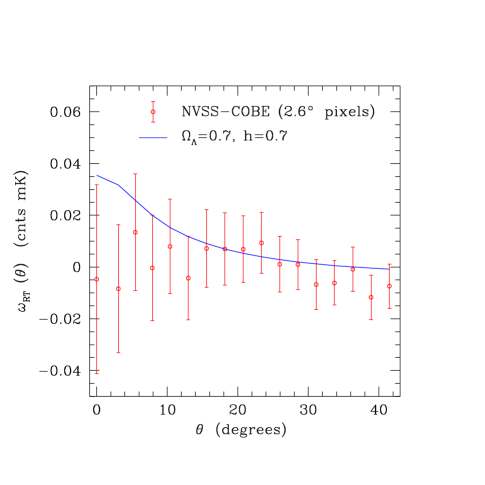
The theoretical predictions for the cross correlations are calculated following the formalism of Refs. [7, 10]. In order to simplify comparison to the data, we consider a single family of possible correlation functions having the shape of that in Figure 2 but with variable amplitude. This family closely matches the correlations predicted for the range of CDM cosmological models we consider. The 95% CL (1.65 ) upper limit for the zero lag correlation is while at 98% CL (2.05 .)
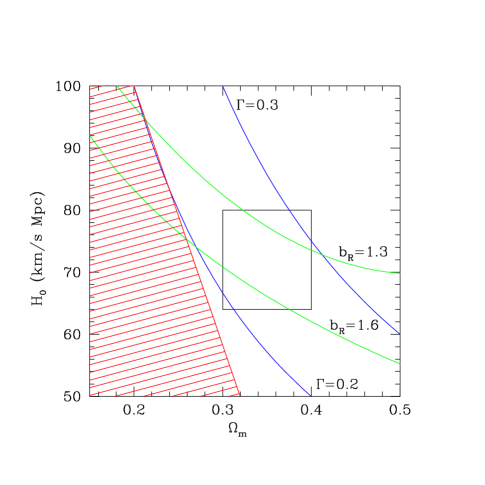
The cosmological implications of this bound are summarized in Figure 3, where we plot the allowed region in the plane, where is the fraction of the critical density in both baryons and dark matter. Also shown on the plot are contours of constant radio bias and contours of constant (), which determines the shape of the matter power spectrum. To first order, the predicted cross-correlation depends only on the value of the cosmological constant, and models with are excluded. However, there is some dependence on the Hubble parameter because the radio auto-correlation includes contributions from smaller scales than generally contribute to the cross-correlation. Thus, models with more small scale power (large , ) tend to have smaller biases and predict less cross-correlation than models with lower and .
Our results have thus far assumed a constant linear bias factor, but in principle bias could be time and even scale dependent. Simple models of linear bias evolution [21] indicate that it is tied to the evolution of the linear growth factor (normalized to be unity today): Thus, models that are presently positively biased were even more biased in the past. We do not expect this time evolution to change our results significantly, however. First, it is the levelling off of the growth factor at that results in the ISW effect. Thus the bias is also relatively constant during this epoch. Second, the effect of bias evolution is the same as changing , and our signal is not very sensitive to such changes. Scale dependent biasing, if arbitrary, makes any predictions for large scale structure problematic. However, assuming the scale dependence is relatively weak, then so long as we are measuring the radio bias on roughly the same scale as the expected correlations, our results should be fairly robust.
The integrated Sachs-Wolfe effect, if detected, would provide an important confirmation of cosmological theory and provide a new mechanism to distinguish between models with a cosmological constant from quintessence dominated or open universes. Of course, if radio sources themselves contribute significantly to the CMB then such a correlation could be explained otherwise. However, current models indicate that this is not the case. From flux limited 1.4 GHz source counts it can be shown that the contribution from these sources is less than 10% of the expected ISW contribution to and is even less for .
While the upper limit derived here is consistent with the currently favored CDM universe, it is only marginally so. It is worth noting that a similar limit has been derived from the frequency of strong gravitational lensing [22]. Since these observations are so close to being in conflict with the leading cosmological model, it is important to pursue both types of investigations further.
The cross-correlation constraint will be greatly strengthened by NASA’s recently launched Microwave Anisotropy Probe (MAP), which will provide a full sky map with much lower noise and higher angular resolution than the COBE map. Monte Carlos simulations indicate that the cross-correlation of MAP with the NVSS survey should be able to detect the ISW effect for an universe at the 95% confidence level. If, in addition, a future radio survey is able to increase the number of sources by a factor of , then the Poisson counting noise will be effectively eliminated and the detection should be at the level. Finally, if in the future there becomes available a full-sky quasar or distant galaxy redshift survey with several million objects, one will be able to construct the ‘ideal’ redshift distribution function and approach the optimal detection derived by Crittenden and Turok for a universe [7]. These will constitute crucial tests which the CDM universe must pass if it is to remain the favored cosmological model.
We thank Neil Turok for useful discussions and Ed Groth for a variety of analysis programs. RC acknowledges support from a PPARC Advanced Fellowship. This work was supported in part by NASA grant NAG5-9285.
REFERENCES
- [1] A. Riess et al, Astron. J. 116, 1009 (1998). S. Perlmutter et al, Astrophys. J. 517, 565 (1999).
- [2] P. de Bernardis et al, Nature (London) 404, 955 (2000). B. Netterfield et al, astro-ph/0104460.
- [3] S. Hanany et al, Astrophys. J. 545, L5 (2000). A. T. Lee et al, astro-ph/0104459.
- [4] C. Pryke et al, astro-ph/0104490.
- [5] N. Bahcall, J.P. Ostriker, S. Perlmutter & P.J. Steinhardt, Science 284, 1481 (1999).
- [6] R. Sachs & A. Wolfe, Astrophys. J. 147, 1 (1967).
- [7] R. Crittenden & N. Turok, Phys. Rev. Lett. 76, 575 (1996).
- [8] This effect can also be used to constrain open and quintessence models: A. Kinkhabwala & M. Kamionkowski, Phys. Rev. Lett. 82, 4172 (1999). , R. Caldwell & A. Kinkhabwala, private commun. (2000).
- [9] H. V. Peiris & D. N. Spergel, Astrophys. J. 540, 605 (2000).
- [10] S. Boughn, R. Crittenden & N. Turok, New Astron. 3, 275 (1998).
- [11] E.g. A. Comastri, G. Seti, G. Zamorani & G. Hasinger, A& A 296, 1 (1995).
- [12] C. Bennett et al, Astrophys. J. 464, L1 (1996).
- [13] E. Boldt, Phys. Rev. 146, 215 (1987).
- [14] J. Condon et al, Astron. J. 115, 1693 (1998).
- [15] J. Condon, Astrophys. J. 287, 461 (1984).
- [16] J. Dunlop & J. Peacock, MNRAS 247, 19 (1990).
- [17] R. White & S. Stemwedel [1992], in Astronomical Data Analysis Software and Systems I, ASP, eds. (D. Worrall, C. Biemesderfer & J. Barnes).
- [18] M. Magliocchetti et al, MNRAS 318, 1047 (2000). D. Haarsm, R. Partridge, R. Windhorst & E. Richards, Astrophys. J. 544, 641 (2000). B. Mobasher, L. Cram, A. Georgakakis & A. Hopkins, MNRAS 308, 45 (1999).
- [19] C. Cress, D. Helfand, R. Becker, M. Gregg & R. White, Astrophys. J. 473, 7 (1996). C. Cress & M. Kamionkowski, MNRAS 297, 486 (1998).
- [20] M. Magliocchetti et al, MNRAS 300, 257 (1998).
- [21] J. N. Fry, Astrophys. J. 461, L65 (1996). M. Tegmark & J. Peebles, Astrophys. J. 500, L79 (1998).
- [22] D. Maoz & H. Rix, Astrophys. J. 416, 425 (1993). C. Kochanek, Astrophys. J. 466, 638 (1996).