The origin of the high velocity circumstellar gas around SN 1998S
Abstract
Modelling of high resolution Balmer line profiles in the early-time spectra of SN 1998S shows that the inferred fast ( km s-1) circumstellar (CS) gas on days 23 and 42 post-explosion is confined to a narrow, negative velocity gradient shell just above the photosphere. This gas may be identified with a slow ( km s-1) progenitor wind accelerated at the ejecta-wind interface. In this scenario, the photosphere coincides with a cool dense shell formed in the reverse shock. Acceleration by radiation from the supernova or by a shock-accelerated relativistic particle precursor are both possible explanations for the observed fast CS gas. An alternative, equally plausible scenario is that the fast CS gas is accelerated within shocked clouds engulfed by the outer shock, as it propagates through the intercloud wind.
keywords:
supernovae – circumstellar matter – : stars.1 Introduction
Supernova (SN) 1998S in NGC 3877 was discovered by Li & Wan (1998), probably before maximum light (Fassia et al. 2000). The presence of narrow lines in its early-time spectra led to its classification as a type IIn (SN IIn) (Leonard et al. 2000). Nevertheless, the close resemblance of its light curve and spectral development to those of SN 1979C (Liu et al. 2000) means that it is also valid to classify SN 1998S as another bright SN IIL. Whatever the assigned class, there is strong evidence for the existence of a dense circumstellar (CS) wind in its immediate vicinity of SN 1998S. This includes the presence of narrow CS lines (Bowen et al. 2000; Fassia et al. 2001), broad emission lines originating from the interaction (Leonard et al. 2000; Gerardy et al. 2000; Fassia et al. 2001), and radio and X-ray emission (Pooley et al. 2001). Despite extensive effort in the past, we still have a poor understanding of the origin of the large pre-supernova mass loss and the ejecta-wind interaction phenomenon in SNe IIn.
SN 1998S is the most comprehensively observed SN IIn, thus providing us with an excellent opportunity for gaining a deeper insight into the morphology and origin of the dense CS environment and the physics of the interaction. Of particular interest is the origin of two distinct CS wind velocity components deduced from high resolution early-time spectra of SN 1998S taken at 2–5 weeks after the explosion (Bowen et al. 2000; Fassia et al. 2001). These had velocities of km s-1, and km s-1, respectively. The slower component is revealed by both narrow H I and He I P Cygni profiles and forbidden lines, while the faster component is seen only in broader H I and He I absorption lines. The minima of the broad H and H absorptions shifted from –115 km s-1 on 1998 March 20 to –85 km s-1 by 1998 April 8. Similarly broad CS absorption lines are also seen in high resolution ultraviolet (UV) spectra via the Mg II 2800 Å doublet (Bowen et al. 2000). While the presence of the slow wind is unsurprising for a SN II progenitor, the origin of the faster CS material (CSM) is not clear. Bowen et al. (2000) suggest it originated as a pre-existing fast wind component (fast shell). Fassia et al. (2001) suggest it was due to a faster wind produced during a recent BSG phase. A third possibility is that it was due to pre-shock radiative acceleration of the slow wind (Lentz et al. 2001; Fassia et al. 2001).
In this paper we shall focus on the nature of the fast CS component which, we believe, is related to the structure of both the wind and the ejecta-wind interface. We start with a study of the kinematics and location of the fast CS gas (Section 2), making use of the high resolution profiles of Balmer lines observed on 1998 March 20 and 1998 April 8 (Bowen et al. 2000; Fassia et al. 2001). Through our modelling of the CS gas line profiles, we reveal that the fast CS component appears to lie very close to the SN photosphere. Indeed, this proximity presents a challenge in understanding the structure of the ejecta-wind interface. A solution will be proposed. We then consider the plausibility that the fast CS gas results from the pre-shock acceleration of the slow wind by radiation or relativistic particles from the SN. (Section 3). As an alternative explanation, we also investigate shocked dense wind clumps (Section 4). We note that the CS wind considered here corresponds to the ‘Mid-CSM/Outer-CSM’ regions defined in Fassia et al. (2001). This will be discussed further in Section 5, where we conclude that the division into Mid- and Outer-CSM zones is probably not required after all. The ‘Inner-CSM’ region (Fassia et al. 2001), overrun by the ejecta around 2 weeks post-explosion, is examined by Chugai (2001).
Based on Chugai’s (2001) model for the SN-CSM interaction and the light curve, we prefer 1998 February 25 as the date of the SN 1998S explosion. Adopting this as zero epoch, March 20 and April 8 become days 23 and 42, respectively. This should be kept in mind when comparing this work with other papers on SN 1998S.
2 Modelling the circumstellar line profiles
In the standard picture of spherically symmetric SN ejecta interaction with a smooth CS wind, the ejecta-wind interface has a two-shock structure with the outer and inner shocks running outward into the wind and inward into the ejecta, respectively (Chevalier 1982; Nadyozhin 1981, 1985). We define a wind density parameter (linear density) , (g cm-1), where is the density of the unshocked CS wind. With g cm-1, which is typical for SNe II with dense winds (e.g. SN 1979C, see Lundqvist & Fransson 1988), the inner shock wave is radiative. Consequently, a cool ( K) dense shell (CDS) of shocked SN ejecta forms between the outer and inner shocks (Chevalier & Fransson 1985, 1994).
To investigate the origin of the CS line profiles, we consider a model of the line-forming region specified in terms of a) the photospheric radius, , b) the extent of a shell of fast CS gas, , and c) the extent of a slow external wind, . We express the radii in terms of the photospheric radius, i.e. , unless the physical units are needed. The model is similar, in some respects, to that of Lentz et al. (2001), but with two important differences. First, in their model there is a significant “SN atmosphere” zone lying between the SN photosphere and fast CS gas (). In our model the SN atmosphere is absent (we explain why below). There may be a layer of very hot ionised post-shock gas between the photosphere and the fast CS gas (), which does not contribute to line emission or absorption in the optical, but reprocesses the photospheric spectrum in the ultraviolet due to Comptonization (Lundqvist et al., in preparation). Second, in Lentz et al. the velocity within the fast CS gas is assumed constant, while in our model the velocity can vary with radius. Since the kinematic structure of the resulting fast CS gas is not known, we consider initially three different possibilities: (a) a fast, constant velocity wind, (b) an accelerated flow with a positive velocity gradient, , (this might arise from a CS shell lost in a violent mass ejection before the SN explosion (Grasberg & Nadyozhin 1987)), (c) an accelerated flow with a negative velocity gradient (), characteristic of pre-shock acceleration of the slow wind. For the case with a negative velocity gradient, we adopt as the description of the fast CS gas velocity :
| (1) |
where , the velocity of the slow wind, is assumed to be constant with radius. Thus the velocity of the accelerated CS gas is at its innermost limit , falling to at its outermost limit where it merges with the unaccelerated CS wind. Note that corresponds to a very steep velocity gradient, while gives a mild slope.
Given the population of the second level , and the line source function , the CS gas line profile can then be easily calculated for the velocity fields specified in (a)–(c) above. We do not compute the actual hydrogen level population in the wind (although this is itself an interesting problem). Instead, we parameterize the behaviour of and . Specifically, we adopt a power law distribution for the second level population for , with and as free parameters. We split the H source function into net emission and scattering terms, respectively and , with and , where is the dilution factor and is the continuum intensity. This representation reduces uncertainty in the H source function. For other Balmer lines we cannot assume such a simple representation of the source function. However, the scattering term contribution is expected to be substantially lower than for H, and so we simply adopt the power law for these lines. Rather than using the Sobolev escape approximation, we directly integrated the radiative transfer equation, adopting a Gaussian local profile with a thermal most probable velocity . The model parameters comprised , , , , , , , , , and .
| No. | Kinematics | |||||
|---|---|---|---|---|---|---|
| 1 | 1 | 2 | 3 | 6 | ||
| 2 | 1 | 2 | 3 | 6 | ||
| 3 | 1 | 1.3 | 0.65 | 2 | 2 | |
| 4 | 1 | 1.5 | 0.65 | 2 | 2 | |
| 5 | 1.1 | 1.3 | 0.65 | 2 | 2 | |
| 6 | 1 | 1.3 | 1.3 | 2 | 2 | |
| 7 | 1 | 1.3 | 0.3 | 2 | 2 |

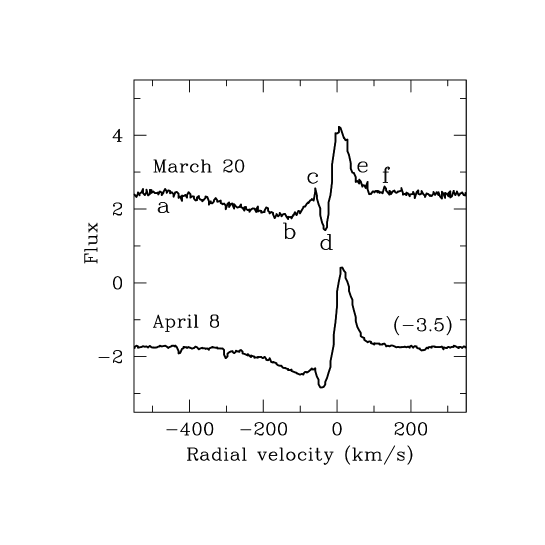
To assess the viability of the different CS kinematics suggested above we shall concentrate on the kinematics of the fast flow, but always including the slow wind component in the model. In all the models the maximum velocity of the fast flow, km s-1. The kinematics of the slow wind is assumed to be a combination of its steady outflow velocity km s-1 within which the hydrogen gas has a thermal most probable velocity km s-1 (corresponding to K). The adopted values for and are based on our best fits to the observations for the slow wind lines (see below), although their precise values are not crucial here. A successful model of the fast CS line component needs to be able to reproduce the specific features indicated in Fig. 1, viz. (i) the low velocity of the absorption minimum (point b); (ii) the slowing down of the absorbing gas velocity between day 23 and day 42, as indicated by the blue wing (a–b); (iii) the relative weakness of the red emission wing (e–f), presumably indicating an occultation effect.
The resulting model profiles are displayed in Fig. 2 with the parameters given in Table 1. Comparison of Figures 1 and 2 shows that model 1 (fast, constant velocity wind) predicts a velocity for the absorption minimum which is far greater than that observed. Variation of the free parameters (, , , ) does not improve the fit. We therefore rule out this model. A somewhat better match is achieved with model 2 (). Moreover, if we increase the outer radius by factor of three, then since we have a fixed maximal velocity, the velocity of the absorption minimum can be made even lower. However, this model predicts that the characteristic velocity derived from the fast CS gas line profile should increase with time as SN overtakes the innermost, lower velocity CS gas. In fact we observe that the characteristic velocity decreases with time (Fig. 1), and so we also discard this model.
Thus, we are left with the negative velocity gradient class of models (Models 3–7). In Fig. 2 (middle panel) we show Model 3 which gives a good fit to the observed day 23 profile (see below). With Models 4–7, we illustrate the sensitivity of these negative gradient models to parameter variations. Increasing the outer limit, of the accelerated CSM (Model 4) (Fig. 2 middle panel) produces a red wing which is much stronger than that observed. The introduction of a gap, , between the photosphere and the fast CS gas (Model 5) also results in an unacceptably strong red wing (Fig. 2 middle panel). Moreover, both Models 4 & 5 exhibit significant differences from Model 3 at radial velocities of km s-1. Variation of the velocity gradient index, , also has a strong effect. This is illustrated by models 6 & 7, again compared with Model 3 (Fig. 2, lower panel). Thus, given a judicious selection of parameters, these preliminary calculations demonstrate that a model comprising a fast CS shell with a negative velocity gradient can successfully reproduce the observations.

We now fit the H CS line profiles for both epochs and compute the other Balmer line profiles using the same parameters as for H, tuning only the amplitude of the source function. A redshift of +850 km s-1 (Fassia et al. 2001) was adopted. We explored the model parameter space and found that the observed H profile could only be reproduced with a narrow (or zero) gap between the photosphere and the fast CS gas, viz. , with being the best choice. The power-law indices, , and amplitudes, , of, respectively, the second level population and source function were estimated by imposing the requirement that both the fast and slow CS absorption components of all the hydrogen lines should be reproduced. The slow wind outflow velocity and thermal velocity were fixed by the positions and widths of the narrow lines. In general, the slow wind outer radius, , is poorly determined. We tested values in the range but were always able to produce acceptable fits by adjusting and . We have, therefore, arbitrarily adopted on day 23 and on day 42. We judge that the Balmer line profile fits for days 23 and 42 (Figs. 3 & 4) are quite good. The parameters used are given in Table 2. In Fassia et al. (2001) we found that the narrow H-line widths corresponded to a velocity of 60 km/s, and we suggested that part of this was due thermal broadening. This is quantified here by our modelling of the narrow hydrogen lines which indicates a slow wind velocity of km s-1 for hydrogen. Curiously, this is actually slightly slower than the 40 km/s wind velocity inferred from the narrow forbidden lines (Fassia et al. 2001).
The model of the fast CS gas defined by the parameters in Table 2 is henceforth dubbed the ‘kinematic model’. The essential feature of this model is that the fast CS gas is confined to a narrow layer, , nearly attached to the photosphere. This indicates that the photosphere resides in the outermost layers of the SN ejecta and possibly coincides with the CDS. The latter point, in fact, agrees with recent modelling of the SN 1998S interaction with the CS gas, which demonstrates that the CDS remains opaque in the Paschen continuum for about 45 days (Chugai 2001). The essential elements of the kinematic model of the fast CS gas are illustrated in Fig. 5.
This picture is, however, somewhat disturbing since it leaves no place for the outer shock wave. The point is that the fast CS gas presumably lies in the pre-shock zone and therefore must be separated from the CDS by the post-shock layer. The extent of this layer depends on whether the shock is adiabatic or radiative. In the adiabatic case the typical thickness of the postshock layer for the outer shock is about (Chevalier 1982). This is in conflict with the kinematic model of the pre-shock fast CS gas, which requires . On the other hand, if the outer shock were essentially radiative, the post-shock layer might be thin enough to meet this requirement. However, the problem with the latter possibility is that the wind density in the region cm, where the interaction proceeds after March 16 (day 19) is very low, g cm-1, according to the analysis of the fast CS ultraviolet lines on March 16 (Lentz et al. 2001). (We note also, that this is consistent with the lower limit of g cm-1 on day 42 which can be obtained from the [O III]-derived density lower limit and the shock radius (Fassia et al. 2000, 2001)). For such a wind the outer shock is essentially adiabatic. We therefore face a ‘proximity problem’, namely, how to reconcile the proximity of the fast CS gas to the photosphere on days 23 and 42 with the claim that the outer shock wave is adiabatic at these epochs.
Two solutions to this problem are conceivable. The first possibility is that the outer shock is adiabatic, i.e , but that the CDS is strongly corrugated, presumably due to Rayleigh-Taylor instabilities, in such a way that spikes of dense opaque CDS material protrude into the postshock layer which lies in the region . The morphology of the corrugated CDS in this case is similar to the ‘hedgehog’ model used by Cid Fernandes & Terlevich (1994) to explain line profiles in SNe II interacting with a dense CS environment. The thick forest of spikes can, in principle, produce an efficient limb occultation of the far side of the fast CS shell and thus bring about the effect of fast CS gas-photosphere proximity.
The second solution is based upon the concept of a clumpy wind. Wind clumpiness is a rather common phenomenon for AGB and post-AGB stars (Olofsson 1994) and is occasionally revealed in interacting SNe II (Chugai 1993). We envisage a two-phase wind with dense clouds embedded in the rarefied intercloud gas. The SN interaction with this wind results in a fast outer shock running through the intercloud gas, and slow shocks running into the dense clouds. Thus, the nearly-stationary clouds become engulfed by the outer shock and, for a certain density contrast and cloud size, can survive in the postshock gas, eventually encountering the CDS. If we attribute the fast CS gas to the effect of shocks running into the engulfed clouds then the proximity problem may be resolved. Two options are conceivable, depending on whether the cloud shock is adiabatic or radiative. In the first option, the mechanism which accelerates the unshocked slow gas in the clouds up to the fast CS gas velocity is presumably the same as would be the case for a smooth wind in the pre-shock region. In the case of radiative cloud shocks the fast CS gas may be identified directly with the shocked cloud gas. The latter possibility will be considered in detail in Section 4.

| Day | ||||||||
|---|---|---|---|---|---|---|---|---|
| km s-1 | cm-3 | |||||||
| 23 | 1.3 | 500 | 30 | 13 | 0.65 | 6 | 2 | 0.055 |
| 42 | 1.25 | 300 | 30 | 13 | 1 | 2 | 2 | 0.045 |
3 Fast CS gas arising from pre-shock acceleration
Between the two epochs (23 and 42 d) the photospheric radius expanded by a factor of (Fassia et al. 2000). Yet the above analysis indicates that, at both epochs, the fast CS gas resided in a thin shell () attached to the photosphere. Moreover, the gas flow in this shell has a negative velocity gradient, declining from the maximal velocity to km s-1 at the inner edge of the disturbed slow wind. All this leads us to the proposition that the fast CS gas is not a pre-existing flow, nor is it accelerated shortly after the explosion by the radiation from the shock breakout, but instead is created by the ongoing acceleration of the slow wind in the immediate vicinity of the photosphere. The acceleration might be produced by the SN radiation (Chevalier 1981) and/or a relativistic particle precursor (Chugai 1997).
3.1 Radiative acceleration
The acceleration of an ionised, optically thin wind via Thomson scattering was invoked to explain the fast CS features observed in SN 1993J at early epochs (Fransson, Lundqvist & Chevalier 1996). Ignoring the initial wind velocity, Thomson scattering can accelerate the CS gas at radius up to km s-1, where is the time-integrated radiation energy in units of erg, and is in units of cm. Fransson et al. (1996) estimated that for SN 1993J using explosion models and calculating the emission from the circumstellar shock. For SN 1998S we have no information on the total luminosity for the early evolution until the estimates for the bolometric luminosity of Fassia et al. (2000), starting on day 17. Integrating the estimated bolometric luminosity between days 17 and 42, we obtain if we assume that the spectrum is blackbody. There is probably considerable uncertainty in this estimate. We have not included the early emission from the photosphere and from the circumstellar interaction, which may lead to an underestimate, but we have also ignored the effects of UV line blanketing in the blackbody approximation, thus producing a possible overestimate. However, the bolometric luminosity is certainly considerably higher than for SN 1993J, with a likely range of . Remarkably, in the SN II models of Falk & Arnett (1977) with an extended presupernova envelope of a size and density similar to those of the SN 1998S inner shell (Chugai 2001), the radiated energy .
On day 42, (Fassia et al. 2000) which, with , yields km s-1 for the CS gas. This is faster than the slow wind velocity of km s-1, suggesting that the observed slow wind may have undergone some radiative acceleration following the supernova explosion. Yet these velocities are insufficient to account for the fast CS shell at this epoch. The same is true for day 23 when . The value of is even more uncertain at that epoch, probably in the range , using the results of Fassia et al. (2000). The corresponding velocity range for the CS gas is then km s-1, again too low for the fast CS gas. We therefore have to seek an additional acceleration mechanism to account for the velocity of the fast CS gas.

The radiative force can be enhanced by including the effects of UV line absorption. This mechanism was exploited by Castor, Abbott & Klein (1975) to account for hot star winds. It was also invoked by Chevalier (1981) to explain the fast CS features in SN 1979C via radiative acceleration in the pre-shock zone, and discussed by Fransson (1986) who argued that lines could pre-accelerate the gas up to more efficiently than Thomson scattering.
The radiative force per unit volume due to the line absorption effect (Castor et al. 1975) is
| (2) |
where is the monochromatic flux. is the radial Sobolev optical depth in the line, where is summed over the total number of lines with the lines arranged in order of frequency. From the dependence of the velocity gradient on we see that line acceleration is a runaway effect; the gas that has been accelerated is also the gas that most easily gets further accelerated. This means that a steeper velocity profile can be created than with pure Thomson scattering (see also Fransson 1986), thus providing an explanation for the line profiles in Section 2. Another mechanism which can steepen the velocity profile is related to the degradation of the UV radiation due to photon splitting. This results in a more efficient acceleration in the inner layers of the pre-shock zone, where the UV flux is greater. Clearly, an adequate treatment of the line effects in radiative acceleration requires the solution of the radiative transfer with the statistical equilibrium of ions and level populations. This is a formidably complicated task, beyond the scope of this work. We shall, instead, restrict ourselves to estimating the radiative force and then the velocity increase due to the lines effect.
Let be the ratio of line absorption force to the Thomson scattering force ( is the total radiation flux integrated over wavelength). Using the equation of motion, the velocity change of the fast CS gas due to the lines effect in the pre-shock zone may then be written approximately as
| (3) |
where is the radius of the outer shock, cm2 g-1 is the Thomson opacity, and is the outer shock wave velocity, which we also identify with the velocity of the CDS.
To estimate the radiative force due to line absorption we use the list of lines with compiled by Ron Eastman (Blinnikov et al. 1998) and extended here using the R.L. Kurucz Data Base available on the web. Solar composition and a Saha-Boltzmann distribution are assumed, while the photospheric radiation is treated as black-body with the flux . In Fig. 6 we show as a function of temperature for densities of , and g cm-3. (We note that these values are consistent with the lower limit cm-3 obtained by Fassia et al. (2001) from observed [O III] line ratios.) The velocity gradient in Eq. (2) is taken to be , with km s-1 and cm. The results indicate that is lower for higher densities. This is due to line saturation effects [see Eq. (3)]. The non-monotonic temperature behaviour is due to the strong temperature dependence of the ionisation fractions in different ions. The low temperature peak at 6000–7000 K is caused primarily by the low ionisation ions of Fe.
On day 23, with the photospheric radius at cm (Fassia et al. 2000), the average radius of the fast CS shell is cm. Therefore, a wind linear density g cm-1 would correspond to the density g cm-3. With the equilibrium temperature K (Fassia et al. 2000) we have thus (Fig. 6). Adopting Eq.(3) cm, km s-1 (Chugai 2001), luminosity erg s-1 (Fassia et al. 2000), and , we obtain from Eq.(3) km s-1. The integrated acceleration due to Thomson scattering was estimated above as km s-1 for this particular epoch. In combination with the lines effect, this yields km s-1 i.e. the upper limit is about equal to the observed maximal velocity of the fast CS gas ( km s-1). Thus, radiative acceleration is a plausible mechanism for the acceleration of the fast CS gas. This possibility is enhanced when we note that the effect of the lines may have been underestimated since (a) the line list may be incomplete, (b) multiple scattering of radiation in the UV line forest has been ignored, and (c) the photospheric spectrum is not strictly black-body. Also, as has been shown by Lundqvist & Fransson (1988) and Fransson et al. (1996), the wind conditions can be far from thermodynamic equilibrium. Most likely it is ‘over-ionised’ which would make the wind behave like a gas which was hotter (cf. Fig. 6) than the K we have assumed, thereby increasing the radiation force.
The slow-down of the fast CS gas between days 23 and 42 can be naturally explained using Eq.(3). Using information from Fassia et al. (2000), the ratio decreases by a factor during this period, and unless increases significantly during the same period, the line acceleration shows roughly the right temporal behaviour.

3.2 Relativistic particles
An alternative mechanism for producing pre-shock acceleration is the dynamical effect of the expected relativistic particle shock precursor (Kang & Jones 1997). Let a fraction of the kinetic luminosity, , dissipated in the outer shock, be converted into relativistic particles trapped in the shock wave region. In the approximation of constant ejecta velocity, , the energy equation with adiabatic losses gives as the total energy of relativistic particles (where is the shock wave radius), and the relativistic particle pressure in the precursor (where is the fraction of relativistic particles in the precursor). The equation of motion of the pre-shock flow with velocity in the shock frame, is , and so we have as the velocity of the pre-shock gas in the lab frame
| (4) |
Setting and km s-1, to obtain a precursor velocity of km s-1 we need . Given comparable fractions of relativistic particle energy in the post-shock and pre-shock regions (Kang & Jones 1997), we may adopt . Thus, to accelerate pre-shock matter up to 500 km s-1, the conversion efficiency of shock energy into relativistic particles must be . While this value is close to the absolute upper limit, it is nevertheless plausible given the high efficiency of particle acceleration in high Mach number astrophysical shocks (Blandford 1984). Thus, from energy considerations alone, we cannot rule out the possibility that the relativistic particle precursor may significantly contribute to the acceleration of the wind in SN 1998S.
4 Fast CS gas arising from shocked wind clumps
We now consider a radically different mechanism for producing the fast CS gas. This has already been mentioned in Section 2. It essentially exploits the possibility that the wind may have a clumpy structure. In this scenario, the fast CS gas is identified with radiatively-cooled shocked gas in wind clouds engulfed by the intercloud shock. This may, in principle, reproduce both the characteristic velocity of the fast CS gas and resolve the photosphere proximity problem. Moreover, it may also produce a negative velocity gradient. Since the postshock density increases from the outer shock jump towards the contact discontinuity (Chevalier 1982), it means that the cloud shock velocity also increases inwardly. Thus, the negative velocity gradient may well be mimicked by the ensemble of cloud shocks.
A specific feature of the proposed mechanism is a ‘stripping flow’ produced by the mass loss from the shocked cloud due to a Kelvin-Helmholtz instability (Klein, McKee & Colella 1991). The stripping flow is characterized by a broad spectrum of fragment sizes and velocities with the smaller fragments acquiring the higher velocities. Tiny, high velocity fragments are subjected to efficient mixing with the hot outer shock gas, which results in their heating and ionisation. Therefore, we expect that the high velocity stripping flow should be revealed particularly by the presence of high ionisation lines. In fact HST UV spectra do show high velocity (several km s-1) blue wings in C IV and Si IV resonance lines (Lundqvist et al., in preparation), and this may well be the consequence of such a stripping flow.
We now test the clumpy wind model against particular observational requirements, particularly on day 23. The cloud/intercloud density ratio must be consistent with the cloud shock wave velocity, (the factor of two is from the factor of four density jump at the intercloud shock). With km s-1 and a CDS velocity at this epoch of about km s-1 we thus obtain . To meet the requirement of proximity to the photosphere, the lifetime, , of a cloud of radius must be equal to or greater than the time, , which it takes to cross the intercloud post-shock layer ( is the thickness of this layer). This leads to the constraint . We consider the case where the ratio is close to this lower limit, viz. , in order to maximize the number of shocked clouds and so be consistent with the absence of strong fluctuations in the line profile. Combining this ratio with and the value of the photospheric radius at this epoch, cm (Fassia et al. 2000), we get a cloud radius cm. The filling factor of the clouds () may be estimated from the condition that the covering factor of the shocked clouds is about unity, i.e. . From this, we obtain . Adopting all the cloud parameters derived above, we find that the number of clouds in the outer postshock layer is .
We now demonstrate that, given the above choice of cloud parameters (, , and ), the cloud shocks are essentially radiative. The condition that the cooling time is less than the time for the cloud shock wave propagation is , where is the proton mass, and erg s-1 cm3 is the cooling function. This leads to the requirement cm-2, where km s-1 is assumed. Given an average wind density cm-3, , and , we obtain a cloud density of cm-3. Therefore, from the above lower limit for the cloud column density, , we find that for the cloud shocks to be radiative, cm. This is consistent with the value cm derived above using the observed values for , and at 23 days.
Finally, the adopted set of cloud parameters must be consistent with the day 23 observational upper limit for the net H luminosity erg s-1 (Fassia et al. 2001). To check this, we use the simple expression for the cumulative H luminosity of the shocked clouds
| (5) |
where is the efficiency of H emission, of the order of (Chevalier & Fransson 1994). Substituting in Eq. (5) g cm-1, km s-1, , , one obtains erg s-1, in accord with the observational upper limit.
Thus, for the cloud shock scenario an appropriate set of cloud parameters might be , , cm, with the average linear wind density g cm-1. Note, this model can account for the observed slow down with time of the average cloud shock velocity (), if the density contrast increases with radius between days 23 and 42 and/or decreases with time, both being plausible.
Summing up, the above order of magnitude analysis shows that the shocked wind cloud model for the fast CS component may be matched to the bulk of the empirical constraints for a reasonable set of parameters. While the proposed model is quite crude, it does appear to offer a useful alternative explanation for the fast CS gas phenomenon, including the high velocity blue wings of the fast CS absorption profiles in high ionisation UV lines.
5 Discussion
The principal finding of this paper is that the fast CS gas observed in Balmer lines in SN 1998S during the era day 23–42 has a negative velocity gradient flow confined to a narrow layer above, and attached to, the photosphere. The same should be true for the fast CS gas observed in He I (Bowen et al. 2000, Fassia et al 2001) and Mg II 2800 Å (Bowen et al. 2000). We argue that the fast CS gas is the result of the acceleration of the slow wind in the immediate vicinity of the SN photosphere, and show that acceleration driven by radiation is a plausible mechanism. Thomson scattering alone, while significant, is insufficient to account for the observed fast CS gas velocity. However, when we include the additional effects of UV line absorption, we can obtain the observed velocity. Moreover, this is a conservative conclusion given the that the line list may be incomplete, that we ignore multiple scattering in UV line forest, and that time-dependent and non-thermodynamic equilibrium effects are not included. We also demonstrate that the a relativistic particle precursor is able to accelerate pre-shock matter up to the observed fast CS gas velocity.
The fast CS gas can also originate in a completely different way; it could be the result of radiative shocks propagating into dense wind clumps together with the effects of a stripping flow. The stripping flow aspect of the clumpy wind model predicts the presence of very fast, highly ionised CS gas. This seems to be supported by the observation of high velocity blue absorption wings (several km s-1) in C IV and Si IV (Lundqvist et al., in preparation).
An intriguing fact, is that the narrow line width of the unaccelerated wind ( km s-1) indicates a rather moderate wind temperature K. This is quite unlike the hot wind ( K) at early epochs ( month) anticipated by the model of Lundqvist & Fransson (1988) for SN 1979C with comparable wind density, as well as for the somewhat less dense wind around SN 1993J (Fransson et al. 1996). This disagreement may indicate that either the outer shock is essentially radiative so that the Comptonization responsible for the bulk of the UV radiation is inefficient, or that the wind is clumpy with a resulting low equilibrium temperature in the pre-shock wind clumps. We favour the second option, because a radiative outer shock would produce even higher UV luminosity than that of Comptonized radiation from an adiabatic shock. We note that a clumpy-wind scenario was also introduced for SN 1993J by Fransson et al. (1996) to resolve a similar controversy between the theoretical high wind ionisation and a lower ionisation implied by the CS spectral lines.
In Fassia et al. (2001) we suggested that the fast CS gas in SN 1998S resulted from the progenitor going through an RSG phase and then a BSG phase shortly before it exploded. ‘Mid-CSM’ and ‘Outer-CSM’ zones were defined corresponding, respectively, to a tenuous, fast CSM wind from the BSG, and a dense, slow CSM wind from the RSG wind. The BSG wind would have ‘piled up’ against the inner boundary of the RSG wind, producing a negative velocity gradient. The SN shock would first engulf the faster more tenuous part of the BSG wind thus accounting for the observed decrease in the absorption blueshift with time. The abrupt appearance of the strong broad lines by about day 45 would be due to the impact of the ejecta with the denser RSG wind. Thus, qualitatively at least, this model can account for much of the observed spectral behaviour. However, an important result of the spectral line modelling described in Section 2 is that, in terms of the photospheric radius, the radius, , of the interface between the accelerated (fast) and unaccelerated (slow) wind remains about constant between days 23 and 42 (Table 2). Yet, in the RSG/BSG wind explanation, decreases from 2.1 on day 23 to 1.3 on day 42. But Model 4 (Table 1 and Fig. 2) shows that changing from 1.3 to just 1.5 produces a much poorer reproduction of the observed profiles. This appears to present a difficulty for the BSG/RSG wind scenario. Moreover, the acceleration model can also account for the sudden appearance of the strong, broad lines simply as a result of the CDS becoming optically thin around this epoch (Chugai 2001). In other words, there may not be a need for a division of the wind into ‘Mid-CSM’ and ‘Outer-CSM’ components. All this leads us to favour the proposition that the fast CS gas is not a pre-existing flow, but instead is created by the ongoing acceleration of the slow wind in the immediate vicinity of the photosphere. The question of whether or not the BSG/RSG explanation can survive quantitative modelling is beyond the scope of this paper.
It is instructive to review briefly the other known cases of type IIn and type IIL supernovae which have high velocity CS spectral features. The first observational evidence for a phenomenon of this kind was provided by the IUE spectra of the type IIL SN 1979C. This revealed UV lines of C IV and Si IV indicating a gas velocity in the range km s-1 (Panagia et al. 1980). Bearing in mind the photometric and spectral similarities between SN 1998S and SN 1979C, the fast (CS) material in SN 1979C may also be associated with shocked wind clumps. Originally, the UV lines in SN 1979C were attributed to pre-shock radiative acceleration of the slow wind (Chevalier 1981), or to emission from X-ray heated ejecta (Fransson 1984).
Another case is the type IIb SN 1993J where H P Cygni profiles suggested a gas velocity of km s-1 at 2–3 days post-explosion (Cumming et al. 1994). A similar velocity was indicated by the N V 1240 Å emission line (Sonneborn et al. 1994). Fransson et al. (1996) suggested radiative acceleration of the slow wind as a mechanism for the origin of this fast CS gas, but noted that Thomson scattering could be insufficient. It would be interesting to determine whether or not line absorption radiation pressure could provide the required enhancement of the radiative force in this case. Or do we need alternative mechanisms such as a cosmic ray precursor or shocked wind clouds?
In the type IIn SN 1984E, spectral features are attributed to a superwind. Velocities of km s-1 are indicated by the emission components of Balmer lines, while the blue edge of the H absorption indicates a velocity as high as 3000 km s-1 (Dopita et al. 1984), i.e. substantially higher than in the case of SN 1998S. The low signal-to-noise ratio of the SN 1984E data leaves some doubts about the precise interpretation of the line profile; in any event a velocity of 3000 km s-1 at the observed epochs is probably beyond the capability of radiative acceleration.
The type IIn SN 1994W exhibited P Cygni lines which indicated CS gas velocities of km s-1. At first sight, therefore, we might take this SN to be similar to SN 1998S. However, the amazing persistence of the absorption line velocities for about two months (Sollerman, Cumming & Lundqvist 1998) is quite unlike the velocity evolution observed in the fast CS gas features of SN 1998S. A pre-existing CS shell (wind) with a constant velocity of km s-1 is the more likely explanation for the fast CS gas around SN 1994W (Sollerman et al. 1998).
It may well be that in different SNe IIn we see two kinds of fast CS matter. One type is the result of acceleration of the slow progenitor wind at the ejecta-wind interface (e.g. SN 1998S), while the other type is produced by the progenitor before it explodes (e.g. SN 1994W). The origin of such different modes of heavy mass loss in the final stages of a star’s life remains quite uncertain, with the conceivable involvement of stars from both the low mass ( M⊙) and high mass ( M⊙) ends of the massive star range. By studying a sufficiently large sample of SNe IIn using high-resolution spectroscopy together with other observations in the X-ray, optical and radio bands, we shall acquire clues about the complicated physics of the ejecta-wind interaction, the origin of the dense CS matter, and the pre-SN IIn genesis.
Acknowledgments
The research made by one of us (NC) was partially supported by RFBR grant 01-02-16295. We also acknowledge support from The Royal Swedish Academy of Sciences, The Wenner-Gren Foundations and the Swedish Research Council. We also acknowledge support from the UK Particle Physics and Astrophysics Research Council through grant PPA/G/S/1997/00266. The work of SB and ES was supported by RFBR grant 99-02-16205.
References
- [1] Blandford R.D., 1986, in Magnetospheric phenomena in astrophysics, ed. R.I. Epstein & W.C. Feldman (New York: AIP), 1
- [2] Blinnikov S.I., Eastman R., Bartunov O.S., Popolitov V.A., Woosley S.E., 1998, ApJ, 496, 454
- [3] Bowen D.V., Roth K.C., Meyer D.M., Blades J.C., 2000, ApJ, 536, 225
- [4] Castor J.I., Abbott D.C., Klein R.I., 1975, ApJ, 195, 157
- [5] Chevalier R.A., 1981, ApJ, 251, 259
- [6] Chevalier R.A., 1982, ApJ, 259, 302
- [7] Chevalier R.A., Fransson C., 1985, in Supernovae as distance indicators, ed. N. Bartel (Berlin: Springer), 123
- [8] Chevalier R.A., Fransson C., 1994, ApJ, 420, 268
- [9] Chevalier R.A., Blondin J.M., 1995, ApJ, 444, 312
- [10] Chugai N.N.,1993, ApJ, 414, L101
- [11] Chugai N.N., 1997, Astrophys. Space Sci., 252, 225
- [12] Chugai N.N., 2001, MNRAS, submitted
- [13] Cid Fernandes R.C., Terlevich R., 1994, in Tenorio-Tagle G. ed. Violent Star Formation. From S Doradus to QSO. CUP, Cambridge p. 365
- [14] Cumming R.J., Meikle P., Walton N., Lundqvist P., 1994, in Circumstellar media in the late stages of stellar evolution, ed. R.E.S. Clegg, I.R. Stevens and W.P.S. Meikle (Cambridge: Univ. Press), 192
- [15] Dopita M.A., Evans R., Cohen M, Schwartz R.D., 1984, ApJ, 287, L69
- [16] Falk S.W., Arnett W.D., 1977, ApJS, 33, 515
- [17] Fassia A., Meikle W.P.S., Vacca W.D. et al., 2000, MNRAS 318, 1093
- [18] Fassia A., Meikle W.P.S., Chugai N.N. et al., 2001, MNRAS, in press
- [19] Filippenko A.V., 1997, ARA&A, 35, 309
- [20] Fransson C., 1984, A&A, 132, 115
- [21] Fransson C., 1986, Highlights Astron., 7, 611
- [22] Fransson C., Lundqvist P., Chevalier R.A., 1996, ApJ, 461, 993
- [23] Grasberg E.K., Nadyozhin D.K., 1987, Sov. Astron., 31, 629
- [24] Kang H., Jones T.W., 1997, ApJ, 476, 875
- [25] Klein R.I., McKee C.F., Colella P., 1991, in Supernovae, ed. S.E. Woosley (New York: Springer), 696
- [26] Leonard D.C., Filippenko A.V., Barth A.J., Matheson T., 2000, ApJ, 538, 239
- [27] Lentz E.J. et al., 2001, ApJ, 547, 406
- [28] Li W.D., Wan Z., 1998, IAU Circ., No. 6829
- [29] Liu Q.-Z., Hu J.-Y., Hang H.-R., Qiu Y.-L., Zhu Z.-X., Qiao Q.-Y., 2000, A&AS, 144, 219
- [30] Lundqvist P., Fransson C., 1988, A&A, 192, 221
- [31] Nadyozhin D.K., 1981, Preprint ITEP No. 1
- [32] Nadyozhin D.K., 1985, Astrophys. Space. Sci., 112, 225
- [33] Olofsson H., 1994, in Circumstellar media in the late stages of stellar evolution, ed. R.E.S. Clegg, I.R. Stevens and W.P.S. Meikle (Cambridge: Univ. Press), 246
- [34] Panagia N., Vettolani G., Boksenberg A. et al., 1980, MNRAS, 192, 861
- [35] Pooley D., et al. 2001, astro-ph/0101196
- [36] Sollerman J., Cumming R.J., Lundqvist P., 1998, ApJ, 493, 933
- [37] Sonneborn G., Pascual P.R., Wamsteker W., Fransson C., 1994, in Circumstellar media in the late stages of stellar evolution, ed. R.E.S. Clegg, I.R. Stevens and W.P.S. Meikle (Cambridge: Univ. Press), 198