Radio AGN surveys
Abstract
We present a short overview of radio surveys for AGN, including the ‘complete’ flux limited surveys and ‘filtered’ surveys. We also describe our ultra-steep spectrum search for the highest redshift radio galaxies, and our follow-up VLA and ATCA observations of the most distant () and the most luminous radio galaxy known.
Institut d’Astrophysique de Paris, France
IGPP/LLNL, Livermore, CA, USA
Sterrewacht Leiden, The Netherlands
NRAO, Socorro, NM, USA
1. Flux limited and filtered radio surveys
Radio surveys play a crucial role in the study of AGN. Searches for AGN at radio wavelengths have several major advantages over other wavelength regimes, including: (i) the radio emission is often extremely powerful, and can be detected out to the highest redshifts (e.g. SDSSp J083643.85+005453.3 at , Fan et al. 2001), (ii) the most powerful radio sources at the highest redshifts pinpoint the most massive and luminous galaxies at such redshifts, allowing a detailed study, (iii) radio emission is not affected by dust emission, which often affects optical selection criteria.
Several major observational efforts have therefore been performed during the last 4 decades to identify the host galaxies of large samples of radio sources (Table 1). These samples can be divided between ‘complete’ flux limited surveys, and ‘filtered’ surveys, designed to select the highest redshift objects. The advantage of the flux limited surveys is that, given sufficient spectroscopic redshift information, they can be used to derive the radio luminosity function (RLF; e. g. Dunlop & Peacock 1990, Willott et al. 2001). This RLF shows a strong increase between and , and a possible decrease at larger redshifts is subject of considerable debate (e.g. Jarvis et al. 2001b, Waddington et al. 2001). The main problem for establishing the high-z RLF is the small number of radio galaxies and quasars in the flux limited samples.
To find more high redshift radio galaxies (HzRGs; ), additional selection criteria have been used to construct ‘filtered’ surveys. The most successful of these is the selection of sources with ultra steep radio spectra (USS), although others such as angular size upper limits have also been used. While the main explanation for the success of the USS criterion is a simple correction of the generally concave radio spectrum, other effects could strengthen the correlation, including (i) the steepening of the rest-frame radio spectral index with radio power, and (ii) more important inverse Compton losses at high redshift.
Table 1 shows that these filtered surveys reach fainter flux densities, and find objects with a mean redshift , while the flux limited surveys target brighter sources at .
2. An ultra-steep spectrum search for high redshift radio galaxies
With the advent of several major radio surveys during the last decade (Table 2), it is now possible to construct large, uniform samples of radio sources. We have started a program to find significant numbers of radio galaxies. Our 3 samples consist of 669 USS sources, covering the entire sky outside the Galactic plane (see De Breuck et al. 2000). To derive spectral indices, we combined the WENSS and TEXAS survey with the NVSS. Figure 1 and Table 2 show that WENSS is ideally matched in both resolution and sensitivity for such a USS sample. In the regions not covered by the WENSS survey (∘), we have used the shallower TEXAS survey.

More recently, we have also constructed a deeper sample in the region using the southern extension of the WENSS, the Westerbork in the Southern Hemisphere (WISH, De Breuck et al., in prep.). At , we shall combine the SUMSS with the NVSS to construct a first sensitive USS sample in the deep southern hemisphere.
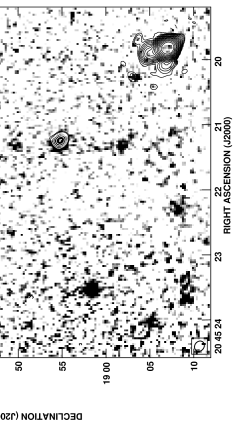
At , the extragalactic radio sky is even less explored, with several extremely luminous radio sources (comparable to northern 3C sources) remaining to be identified. Burgess & Hunstead (1994) describe the only observational effort to date to identify these intriguing objects. We have therefore also constructed the first USS sample at , using the MRC and PMN surveys. From this sample, we have already discovered one of the most powerful radio sources known: MP J20456018 at (Fig. 2).
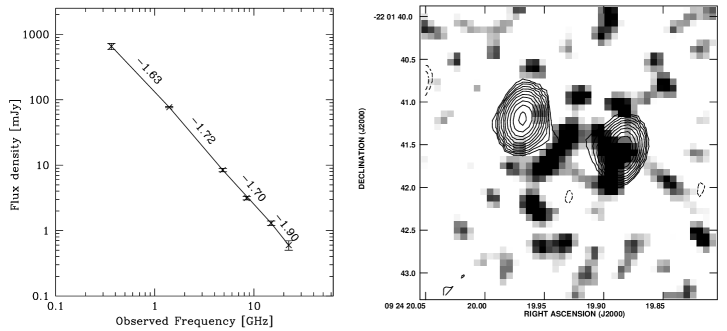
To identify the radio sources in our USS samples, we first obtained high resolution radio images from the VLA and ATCA. After an initial campaign of optical identifications, we switched to band imaging using the Keck and CTIO telescopes (De Breuck et al. 2002). Even with moderately deep imaging (20 to 22), we find an identification rate of 95% for the 86 sources observed in band. Subsequent optical spectroscopy of 46 sources with 3-10m class telescopes has yielded redshifts for 72% of these, with a mean redshift of (De Breuck et al. 2001). From this sample, we have discovered the most distant radio galaxy known: TN J09242201 at (van Breugel et al. 1999). Figure 3 shows the radio spectrum determined from multi-frequency VLA imaging. The spectrum curves at high frequencies, consistent with what is seen in most powerful radio galaxies. Our deep VLA images (Fig. 3) show a 125 double radio source, but no radio core.
Interestingly, despite integration times of 1h or more with the Keck telescope, 5 sources show only a faint continuum emission, but no identifiable emission lines between 4000 Å and 9000 Å. These sources are possibly obscured AGN, as suggested by the detection of several of these at (sub)mm wavelengths (Reuland et al., in preparation).
Acknowledgments.
This work was supported by a Marie Curie Fellowship of the European Community programme ‘Improving Human Research Potential and the Socio-Economic Knowledge Base’ under contract number HPMF-CT-2000-00721, and by the Research and Training Network ‘The Physics of the IGM’ set up by the Human Potential Programme of the European Commission. The work by WvB was performed under the auspices of the U.S. Department of Energy, National Nuclear Security Administration by the University of California, Lawrence Livermore National Laboratory under contract No. W-7405-Eng-48.
References
Becker, R., White, R., & Helfand, D. 1995, ApJ, 450, 559
Bock, D., Large, M, & Sadler, E. 1999, AJ, 117, 1578
Burgess, A. & Hunstead, R. 1994, ASP Conference Series, Vol. 54, p.359
Condon, J., et al. 1998, AJ, 115, 1693
De Breuck, C., van Breugel, W., Röttgering, H., & Miley, G. 2000, A&ASup, 143, 303
De Breuck, C., et al. 2001, AJ, 121, 1241
De Breuck, C., et al. 2002, AJ, in press, astro-ph/0109540
Douglas, J., et al. 1996, AJ, 111, 1945
Dunlop, J. & Peacock, J. 1990, MNRAS, 247, 19
Fan, X., et al. 2001, AJ, in press, astro-ph/0108063
Griffith, M. & Wright, A. E. 1993, AJ, 105, 1666
Jarvis, M., et al. 2001a, MNRAS, 326, 1563
Jarvis, M., et al. 2001b, MNRAS, 327, 907
Lacy, M., et al. 1999, MNRAS, 308, 1096
McCarthy, P., et al. 1996, ApJSup, 107, 19
Rawlings, S., Eales, S., & Lacy, M. 2001, MNRAS, 322, 523
Rengelink, R., et al. 1997, A&A, 124, 259
Röttgering, H., et al. 1994, A&ASup, 108, 79
van Breugel, W., et al. 1999, ApJ, 518, L61
Waddington, I., et al. 2001, MNRAS, 328, 882
Willott, C., et al. 2001, MNRAS, 322, 536
![[Uncaptioned image]](/html/astro-ph/0111254/assets/x4.png)