2School of Physics, University of Exeter, Stocker Road, Exeter, EX4 4QL, UK
3Goddard Space Flight Centre, NASA, Greenbelt, MD 20771, USA
4Department of Physics and Astronomy, University of Southampton, Southampton, SO17 1BJ, UK
Understanding the LMXB X2127+119 in M15
We present X-ray observations of the high-inclination low-mass X-ray
binary system X2127+119 (AC211) in the globular cluster M15 (NGC
7078). The observations consist of data acquired in 1996 with the RXTE satellite and in 1995 with the ASCA satellite. Also, the
MPC1 data from the 1988 GINGA observations were de-archived and
re-analysed.
The phase-folded 2-10 keV hardness ratios from all three missions
differ significantly indicating that the system can exhibit different
spectral behaviours. We find that the X-ray eclipse profiles can be
described relatively well using a simple model where the secondary
star passes in front of a large X-ray emitting region. For this we
require a mass ratio of about one. The radius of
this X-ray emitting region is and its vertical
extent above the orbital plane. We suggest that if
this X-ray emitting region were an optically thick corona, it would
explain various puzzling aspects of this system. We also show that
the X-ray dip observed at phases around 0.65 does not conform with the
idea that the dip is caused by vertically extended material associated
with the stream/disc impact region, but that it could be due to
structure in the inner parts of the disc.
Key Words.:
Accretion, accretion discs – X-rays: binaries – Stars: binaries: eclipsing, coronae – Stars: individual: X2127+119, AC2111 Introduction
Low-mass X-ray binaries (LMXBs) are interacting binary star systems, where the mass accreting star is either a neutron star or a black hole with the mass-losing secondary star usually being of late spectral type. Grindlay (Grindlay93 (1993)) lists 12 bright LMXBs that are known to exist in globular clusters. The general properties of these systems are summarised in Table 1 of Deutsch et al. (Deutsch00 (2000)). The X-ray source X2127+119 is associated with the globular cluster M15 (NGC 7078). The variable, ultraviolet-bright star AC211, which lies very close to the core of M15, was suggested as the optical counterpart by Auriére et al. (Auriere84 (1984)). Charles et al. (Charles86 (1986)) spectroscopically confirmed this through the detection of a strong Heii emission line.
X2127+119 belongs to a distinct group of LMXBs. Namely, LMXBs that exhibit an Accretion Disc Corona (ADC). The standard ADC model was first outlined by White et al. (White82 (1982)) and McClintock et al. (Mcclint82 (1982)) and it requires a hot ionized cloud that surrounds the accretion disc and which is supported by X-ray heating of the disc by a central X-ray source. The corona could also be supported by scattering X-rays from the central source onto the disc and thus heating the disc material to temperatures of K.
Previous X-ray studies of X2127+119 with the EXOSAT satellite Callanan et al. (Callanan87 (1987)) revealed the presence of periodic dips in the X-ray light curve of the system. Ilovaisky et al. (Ilovaisky93 (1993)) found that the period of X2127+119 was 17.11 hours and that the system exhibited two very distinct dips both in the X-rays and in the optical. Milgrom (Milgrom78 (1978)) first pointed out that systems possessing an ADC would show orbital variations in their light curve which are due to both the secondary star and the accretion disc only if their inclination is high enough . In this paper we present further evidence that the two dips observed in X2127+119 are indeed due to an eclipse by the companion star and by variations in the accretion disc structure. This dip associated with variation in the disc structure is assumed to be caused by the partial eclipse of the central X-ray emitting region by the bulge of accretion disc material, which forms at the point where the accretion stream from the secondary star impacts the accretion disc. However, as we discuss later in the paper there is a problem with this “standard” interpretation concerning the cause of this dip in X2127+119.
Homer & Charles (Homer98 (1998)) found that previous X-ray observations could also be fitted with a parabolic ephemeris as well as with the linear ephemeris of Ilovaisky et al. (Ilovaisky93 (1993)). The period change yielded a Ṗ/P yr-1, which implies a very high mass transfer rate of the order of .
X2127+119 was also found to be an X-ray burster by van Paradijs et al. (vanpar90 (1990)), thus firmly establishing the nature of the central accreting object as a neutron star, which was presumably directly visible at that time.
In this paper we examine the complex X-ray properties of this high inclination system. The nature of what seems to be a very large X-ray emitting region is discussed, as well as the argument of whether the neutron star at the center of the system is normally visible as the observation of bursts would suggest. However, the lack of a strong black-body component, the absence of fast quasi periodic oscillations and the X-ray light curve characteristics seem to suggest that the neutron star, as well as the inner disc regions, are hidden from view. Phase-resolved X-ray spectroscopy is performed using datasets from the Rossi X-Ray Timing Explorer (RXTE) and the Advanced Satellite for Cosmology and Astrophysics (ASCA). We have also de-archived and re-analysed the MPC1 data from the GINGA satellite. Finally, in Sect. 5 we discuss various possible models that could account for the complex X-ray behaviour of X2127+119 and a summary of our conclusions is presented in Sect. 6.
2 Observations and Data Reduction
2.1 The RXTE Data
The RXTE satellite observed X2127+119 twice in 1996. The first observation (hereafter 96a) was between 1996 April 3 15:08:08 UT and 1996 April 5 21:24:26 UT, which corresponds to 3.2 orbital cycles of the system. The second observation (hereafter 96b) was between 1996 November 26 05:50:24 UT and 1996 November 28 16:28:32 UT.
The primary instrument for these observations was the Proportional Counter Array (PCA), which consists of five propane and xenon gas filled proportional counter units (PCU). The energy response range of the PCA instrument is 2-60 keV with an energy resolution of at 6 keV. The observations for 96a were carried out using three units (PCU0, PCU1 and PCU2) with PCUs 3 and 4 switched off. In observation 96b all five PCUs were on but units 3 and 4 were periodically switched on and off. For consistency we only present here the combined data from PCUs 0, 1 and 2 for both observations.
Simultaneous observations were also taken with the High Energy X-ray Timing Experiment (HEXTE). The HEXTE instrument comprises two clusters, each cluster composed of four phoswich detectors. The energy response range for the HEXTE is 15-250 keV at an energy resolution of 15% at 60 keV.
The PCA data presented here are the standard2a mode data and were reduced with FTOOLS (see Giles et al. 1995 and references therein for a full description of the RXTE spacecraft and its experiments). The data were background corrected but not dead-time corrected. The dead-time of the data is less than 1% for count rates that are less than 1000 counts/s per PCU. The maximum count rate for our observations was about 220 counts/s from the sum of all three PCUs.
Data screening filters were applied. These filters excluded data that satisfied any of the following criteria: a) the time since the last passage through the South Atlantic Anomaly (SAA) was less than 45 minutes for observation 96a and 30 minutes for 96b, b) the source elevation above the Earth’s limb was less than , and c) the spacecraft pointing was offset more than from the source.
This resulted in 67856 seconds of useful data, arranged in 16s bins, from observation 96a and 46560 seconds from observation 96b. Figures 1 and 2 show the 2-15 keV light curves for the 96a and 96b observations respectively.
HEXTE did not detect X2127+119 in either the 96a or 96b observations because the background count rate completely dominated the source signal. This is not surprising if one looks at the way the background affects the high energy end of the PCA spectra, where the background starts to dominate the source signal at about 15 keV.
2.2 The ASCA Data
Observations with the ASCA satellite were carried out between 1995 April 16 00:55:13 UT and 1995 April 17 03:50:15 UT, corresponding to 1.54 orbital cycles.
Data selection criteria were set such as to exclude data whose times included an Earth elevation angle less than , geomagnetic rigidity greater than 4 GeV/c, times of passage through the SAA, times when the pointing offset was greater than . Other high background times from the GIS instruments such as contamination from Earth’s radiation belts were also excluded. The data were not background subtracted since the background, as derived from blank sky observations, always constituted less than 0.5% of the source from both the SIS and the GIS instruments.
The above screening requirements resulted in 35888 s of available data from SIS and 36432 s of data from GIS, which were arranged into 16s bins.
The SIS data were reduced in BRIGHT mode and the X2127+119 count rates in the 0.7-10.0 keV range were 8.9 counts/s and 7.3 counts/s for SIS0 and SIS1 respectively. The corresponding count rates for GIS2 and GIS3 were 5.5 counts/s and 6.3 counts/s respectively.


The combined SIS and GIS 0.7-10.0 keV average light curve can be seen in Fig. 3. It was created by first normalising the data from the two SIS instruments by using the mean value of the light curve count rate. The mean count rate from SIS0 was found to be 1.21 times higher than SIS1. Similarly we normalised the data from the GIS instruments and found that GIS3 contained 1.16 times more counts than GIS2. The two resulting light curves from both SIS and GIS instruments were then normalised to the mean SIS level and finally combined to produce the light curve shown in Fig. 3. The average uncertainty resulting from combining the SIS and GIS data was found to be at the 5% level.
2.3 The GINGA Data
The GINGA satellite observed X2127+119 in October 1988 (van Paradijs et al. 1990) using the Large Area Counter (LAC). We de-archived the processed and background subtracted standard products from the LEDAS database and have re-analysed the MPC1 mode data. Fig. 4 shows the 2-18 keV GINGA top layer MPC1 light curve.
3 Temporal Analysis
3.1 The light curves


At the time of our RXTE and ASCA observations the linear and the quadratic ephemeris of Homer & Charles (Homer98 (1998)) are aligned with each other. For this reason we have opted to fold the light curves on the linear ephemeris of Homer & Charles (Homer98 (1998)). The approximate uncertainty in phase using the linear ephemeris is about 0.001. The data from RXTE show the primary eclipse at phase 1.0 as well as the dip, which occurs between phases 0.5 and 0.8. The ASCA dataset covers two consecutive eclipses, and it can clearly be seen in Fig. 3 that the profile of the second eclipse is substantially different from the first. The dip that is extremely prominent in the 96a RXTE data is not very well defined by ASCA. In the GINGA observations the main eclipse is deeper than with RXTE and the dip seems to be absent.
3.2 Hardness ratios and Colour–Colour diagrams
The keV hardness ratios for all the observations are shown in Fig. 5. Both hardness ratios, from the PCA data, show a variation with orbital phase of about 10% and there is some evidence of correlation with X-ray flux. We find that the hardness ratio values drop slightly during main eclipse. During the dip the hardness ratio rises progressively as we approach dip egress and indeed the hardness ratio plot reaches its highest level at the point where the dip ends.
The ASCA SIS (4-10)/(2-4) keV hardness ratio against time plot does not show the same behaviour as the RXTE data. Whilst the hardness ratio from RXTE exhibits slight modulations with orbital phase, what we observe with ASCA is an almost featureless hardness ratio plot. The hardness ratio plot from the GINGA observations (top right of Fig. 5) exhibits a completely different behaviour to the hardness ratios from both the ASCA and the RXTE observations, an indication that the system was in a different state than the ASCA and RXTE observations. The hardness ratio is evidently anti-correlated with X-ray flux as originally reported by Callanan (Callanan93 (1993)).
The colour-colour diagrams constructed with the count rates from the (2-4),(4-6) keV and (6-8),(8-15) keV bands for both the 96a and 96b RXTE PCA data can be seen in Fig. 6. Although the data show the same “island” behaviour as found by van Paradijs et al. (vanpar90 (1990)) they also clearly show that the system was in a different state in the two observations. The ratio between the 4-6 keV and the 2-4 keV band is found to be a factor of two higher in the 96b observation.

3.3 The Main Eclipse
Low mass X-ray binaries that possess an ADC and are of sufficiently high inclination will exhibit both eclipses and dips in their light curves. This is because the secondary star will now be able to obscure part of the ADC in addition to the obscuration caused by the accretion disc rim structure. This geometrical configuration was first pointed out by Milgrom (Milgrom78 (1978)).
The main eclipses in X2127+119 are broad with an average full-width-half-minimum (FWHM) of about 0.15 of an orbital cycle. During the main eclipse the X-ray flux from the system is reduced by about 50%. This is clearly not an eclipse of a point source (such as the central compact object) for two reasons: a) the eclipse profile does not show any sharp ingress/egress features, b) at eclipse minimum the profile is not flat as one would expect. Furthermore, at mid-eclipse the flux does not drop to zero, indicating that there is also a significant contribution from extended X-ray emitting regions that are not eclipsed by the companion star.
As there is no sharp ingress or egress from which to measure the exact point of the neutron star eclipse, we can only make guesses for the inclination and the mass ratio of the system. The inclination must obviously be high due to the presence of the eclipse and the dips. We therefore begin our analysis by assuming an inclination of . Considering the turn-off mass for the M15 cluster, Homer & Charles (Homer98 (1998)) assumed a mass for the secondary of and the canonical value of for the neutron star. This yields a mass ratio value of . With these basic assumptions we can now attempt to reproduce the observed X-ray eclipses of the system.
For a -value of 1.75, a large X-ray emitting region, of the order of about (where is the distance from the neutron star to the inner Lagrangian point) is needed to match the eclipse width.
Lowering the mass ratio is equivalent to introducing a larger secondary star. Including a larger secondary star requires a larger X-ray emitting region to keep the first and the last eclipse contact points at the same phase. Indeed, for lower values of , such as , the X-ray emitting region requires a radius of to account for the start and end contact points of the eclipse light curve.
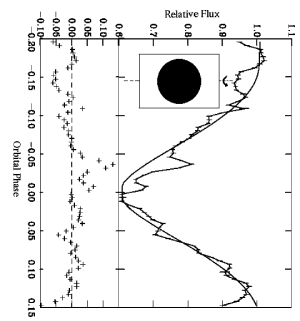
For a system with an inclination of and we find that a model consisting of a black disc, representing the secondary star, which occults a rectangular X-ray emitting region, can reproduce the eclipse light curve reasonably well. Figure 7 shows the model light curve and a schematic of the model geometry. Considering the Roche-lobe geometry of the system, the aspect ratio (i.e. height/radius) of this X-ray emitting region is 1.7, with the disc radius having a value of . This is alarming as it implies that the height of the X-ray emitting region is larger than its radius. We have found that we could lower the required height by including a dark “strip” representing the accretion disc wall along the orbital plane. The best preferred value for the full opening angle of this wall was found to be . Including a wall higher than this value had the effect of flattening the light curve during mid-eclipse while lower values for the strip required an even higher vertical extent for the X-ray emitting region to account for the eclipse depth.
For values of we could not find a disc radius and/or a vertical extent for the X-ray emitting region that would produce the eclipse profile observed. The model light curves were always wider and shallower than the data as effectively a results in a smaller secondary star. Thus for an inclination of we can constrain to . If we use a lower inclination of then the radius of the X-ray emitting region becomes smaller at about for and for . It is therefore evident that in all of the geometric configurations discussed above, and even for inclinations as low as , we need a very large X-ray emitting region with a large vertical extent to account for the primary eclipse profile.
Although these numbers must be regarded as highly uncertain, it is clear that, to explain the eclipse profile, we need to invoke a structure that is relatively large in comparison with the secondary star. An “accretion disk corona” (ADC) that extends to the outer regions of the accretion disc and also has a large vertical extent would thus explain the observed light curves. Scattered X-rays from the ADC could then account for the non-zero X-ray flux when at mid-eclipse.
3.4 The Orbital Dips
Apart from the main eclipse of the X-ray emitting regions, the system also exhibits X-ray dips that are very prominent in the 96a RXTE dataset. The 96a RXTE coverage included observations of two complete dips as well as dip egresses and ingresses at the start and end of the observation respectively. The coverage of the dips in our 96b RXTE observations was not sufficient to allow a detailed analysis and thus our analysis of the dips depends mostly on our 96a observations.
The depth of the dip is about 70% of that of the primary eclipse, indicating that the central X-ray emitting regions of the disc are eclipsed by some sort of disc structure. The drop in X-ray flux during the dip is about 30%. The dip structure is seen to be persistent and fairly stable with sharp ingress and egress. We observe the dip ingress and egress in our RXTE data to have a similar slope to the ingress and egress of the main eclipse. The width of these X-ray dips is of the same order of the primary eclipse. This behaviour indicates that the occulting bulge solid angle must be of the order of the secondary star and also possesses a very well defined structure. We have measured the depth and width of the two complete dips observed in the 96a RXTE data, which are indicated as Dip 1 and Dip 2 in Fig. 1, and we find that they are very dependent on energy (see Sect. 4.2).
The depth of Dip 1 is seen to remain roughly constant as the X-ray energy increases, but its width becomes narrower. The depth of Dip 2 is seen to decrease with increasing energy but its width remains constant. As is also indicated by the changing eclipse profile in the ASCA data, this is evidence that the structure of the X-ray emitting region and/or of the accretion disc edge undergoes changes on time scales of an orbital cycle.
3.5 What is the cause of the dip?
The full width of the main eclipse is 0.3 of an orbital cycle. The full width of the dip is 0.4 of an orbital cycle. If the dip is caused by structure at the edge of the disc then this structure spans in azimuth.
It would be reasonable to assume that the dip seen in the X-ray light curves is caused by the bulge of material created at the point where the accretion stream impacts the accretion disc. However, the phase at which the dip ends, which should be the point where the stream first meets the disc, does not conform with what one would expect from calculations of the ballistic trajectory of the accretion stream.
Using the results of Lubow & Shu (Lubow75 (1975)) we calculate the ballistic trajectory of the stream and we find that for a disc radius of 0.8 the stream impacts the accretion disc at a point that lies about from the line of centres between the two stars. This translates to a phase 0.93. Phase 0.93 lies well within the main eclipse, which extends back to phase 0.8. The dip is seen to end at phase 0.75 which would imply that the point of interaction between the stream and the disc edge corresponds to the point where the line of centres of the two stars and the line representing the radius of the disc are at .
For the ballistic trajectory of the stream to intersect the disc at such a point, the disc must have a very small size of about 0.1 . Clearly, such a disc cannot give rise to the very broad primary X-ray eclipse observed. Assuming an inclination of and a mass ratio of 1.7 we find that to reproduce the main eclipse width and determine the contact phases of the X-ray emitting region with the secondary star we need a disc that extends to about 0.8 .
Frank et al. (Frank87 (1987)) proposed a model where the accretion stream from the secondary star is shielded from X-ray heating by the accretion disc and thus is able to penetrate the disc down to the circularization radius where it shocks with the disc material and produces a bulge. They show that the vertical extent of this bulge is independent of system parameters and that it is always , where is the circularization radius. Using a the circularization radius is 0.27 . At such a radius the bulge would occur at about phase 0.8 and would subtend a full opening angle of about to the central regions of the disc. Our observations favour the above model and are not consistent with the bulge located at the edge of the accretion disc. Figure 8 adopted from Frank et al. (Frank87 (1987)), depicts the model that is supported by our observations of the orbital dips in X2127+119.
4 Spectral Analysis
4.1 The Summed Spectra
We found that multiple component models were needed to fit the overall spectrum. The models fitted included power law (PL), black-body (BB), thermal bremsstrahlung (BR) and Raymond-Smith (RS) hot plasma emission models, combined with photoelectric absorption (wabs). We also attempted to fit the data with the Comptonisation spectra of Lamb & Sanford (Lamb79 (1979)) (CompLS) and Sunyaev & Titarchuk(Sunyaev80 (1980)) (CompST). The best one component model found is a photoelectrically absorbed BR model, which gave a of 3.48 with 337 degrees of freedom (dof). The best two component model found was a photoelectrically absorbed BB+BR model, which returned a of 1.59 with 335 dof. Models like wabs(PL+CompLS) and wabs(PL+BR) produced fits with of 1.87 (334 dof) and 1.89 (335 dof) respectively.
Although, we cannot draw any conclusions from our model fits to the overall summed spectra we can, by direct comparison of the summed spectra in both of the RXTE observations, see that in the case of the 96b observation there is a surplus of soft flux in the region of 2-8 keV and that the spectra from both the 96a and 96b observations are very similar in the 8-15 keV range.


4.2 Phase resolved spectroscopy
In an attempt to try and understand the physical processes occurring, we examined spectra from specific orbital phases. We split the ASCA observations into 11 orbital phase regions from phase 0.12 to phase 1.22.
It was found that several single component models were able to reproduce the spectra very well. Photoelectrically absorbed PL, BR, CompLS and Raymond-Smith models produced very good fits returning values in the region of 1-1.5. It was noticed however, with the exception of the absorption component, that the model parameters did not follow any regular pattern and had an erratic behaviour with orbital phase. This leads us to the conclusion that the X-rays emitted by this source are produced by complex processes and that these models only provide smooth descriptions of the data.
Mitsuda et al. (Mitsuda84 (1984)) proposed a model where the X-rays observed in LMXB systems could be explained by the superposition of a single temperature black-body curve attributed to the neutron star surface and a multi-temperature black-body component from the inner regions of the accretion disc. Interestingly, two-component models that included a blackbody did not produce acceptable fits for our phase-resolved spectra ( never dropped below 2 despite the fact that our best model for the summed spectra was a BR+BB model. The detection of a black-body component in the X-ray spectra of X2127+119 would imply that we see directly into the innermost parts of the accretion disc and to the surface of the neutron star itself. However, as we do not detect such a component we believe that these regions are obstructed from view by some kind of structure at the edge of the disc.
Observations of X2127+119 by BeppoSAX and a brief examination of the same ASCA spectra presented here was performed by Sidoli et al. (Sidoli00 (2000)). They found that they could fit the BeppoSAX intensity averaged spectra with a partially covered disc black body model and a power law, where the black body flux was contributing between 24% and 60% of the total flux and that the same model could be fit to the ASCA phase averaged spectrum. However, as we have shown above the spectral properties of X2127+119 are highly phase dependent and that the overall averaged spectra can be modelled relatively well by a variety of models. Furthermore, a partial covering model is not able to explain the behaviour of the eclipse depth with energy that is seen in the fractional spectra of Fig. 9. This further emphasises the fact that these models simply provide a smooth description of the data rather than depict the actual physical processes that take place in X2127+119.
Thus to study the spectral changes during the primary eclipses and the dips we have looked at the fractional spectra accumulated from different phases. We divided the mid-eclipse and the mid-orbital dip spectra by a spectrum accumulated at phases (0.2-0.3). The hardness ratio at phases 0.2-0.3 remains constant indicating no abrupt spectral changes.
We find that the eclipse depth is different in each observation and that it also varies from eclipse to eclipse but the overall spectral behaviour is stable over the large time period of the observations discussed here, with the deepest eclipses produced at energies around 4-6 keV (see Fig. 9).
The fractional spectra that correspond to the middle of the orbital dips (phases 0.55-0.65) in our 96a RXTE observation suggest that photoelectric absorption could be responsible for the observed dips and which is evident at low energies (2-7 keV). However, at energies above 7 keV, where photoelectric absorption is not expected to play a dominant role in the spectra, we find that the fractional spectra are not equal to unity (see Fig. 10). This could be explained by a model where a disc bulge whose structure is such that its dense central part completely absorbs the X-ray flux from the centre of the disc and thus lowering the overall flux observed, but its less dense outer parts exhibit normal photoelectric absorption behaviour at low energies leading to the observed profiles.
What is evident from the fractional spectra of the eclipses and the dips is that they are caused by two completely different processes. The fractional spectra suggest that the dips are caused partly by photoelectric absorption, while during eclipse the fractional spectra are not consistent with photoelectric absorption models. Instead, they show a complicated profile with the deepest eclipse of the X-rays around the 4-6 keV region. This behaviour is persistent in all of the observations discussed here. If the eclipses were caused by further disc structure one would expect that the fractional spectra would be similar to the spectra of the dip.
4.3 Luminosity Considerations
X2127+119 is known to exhibit variability in its long term X-ray light curve. Corbet et al. (Corbet97 (1997)) reported a weak 37-day modulation of the X-ray flux.
The 2-10 keV luminosity was found to vary significantly between the four observations reported in this paper. Using the widely accepted distance of 10.5 kpc for M15 (Pryor & Meylan 1993), we find that the GINGA MPC1 data from 1988 exhibit an average luminosity of erg s-1. The ASCA observations from 1995 show that the system was brighter with a luminosity of erg s-1. Also the ASCA observations show the highest modulation of flux with a difference of more than a factor of two between the minimum luminosity value of erg s-1 when at mid eclipse and erg s-1 when at phase 0.22. The system was found to be in a slightly less bright state at the time of the 96a RXTE observation with a luminosity of erg s-1 and again brighter in the 96b observation with a luminosity of erg s-1. The slightly higher luminosity of the 96b observation as compared to the 96a observation combined with the excess soft flux observed (see Sect. 4.1) suggests that the system moved through the colour-colour space in a fashion that is typical for “atoll” sources (van der Klis 1997).
4.4 Photoelectric absorption
In our phase-resolved analysis of the ASCA data (Sect. 4.2), we found that various one-component models were able to fit the spectra well. However, it was noticed that models such as CompLS, BR and RS preferred roughly the same amount of photoelectric absorption. PL models generally required an absorption component that was consistently 25% higher than other models. The deviation of the values between the CompLS, BR and Raymond models was always less than 10%.
Using the value for the interstellar reddening towards M15 of (Pryor & Meylan 1993) and the empirical relation between interstellar reddening and X-ray absorption column from Ryter et al. (Ryter75 (1975)) we find a value for cm-2. This is a factor lower than the column densities that are required to fit the best one-component models (CompLS) to our phase resolved X-ray spectra. This suggests that a significant amount of photoelectric absorption must be intrinsic to X2127+119.
The modulation of column density with orbital phase in X2127+119 was first observed by Hertz & Grindlay (Hertz83 (1983)). Fig. 11 shows a plot of the variation of column density with orbital phase as derived from our ASCA observation. The column densities were calculated using the CompLS model. There is a clear anti-correlation between column density and X-ray flux. The average column from all the phase resolved spectra found using the CompLS model is cm-2. This is in agreement with the values quoted by Schulz (Schulz99 (1999)) using observations of X2127+119 from ROSAT. However, it should be noted that in all of our models, the photoelectric absorption is assumed to be caused by material with solar abundances and that the column density is a constant factor regardless of the atomic number of each element. If the material of the system has a metallicity value similar to that of the M15 cluster as a whole (i.e. ) then to account for all the absorption, that would otherwise be caused by metals, we would need to multiply our column values by a factor of . However, we note that, despite the fact that M15 has an intrinsic low metallicity there is likely to be processed material being transferred from the companion if it is evolved and convective.
Photoelectric absorption could also be responsible for the behaviour of the hardness ratio plots from the RXTE data shown in Fig. 5. The rise in the hardness ratio plot during the dips could be attributed to photoelectric absorption of the soft X-rays as is indicated by the fractional spectra of the dip shown in Fig. 9.

5 Discussion
White et al. (White81 (1981)) and McClintock et al. (Mcclint82 (1982)) were among the first to suggest that the broad eclipses, observed in systems like X1822-371 and X2129+470, were due to the obstruction of a large ionized cloud of gas that surrounds the accretion disc and the central compact object. Similar ADC models were proposed by Callanan et al. (Callanan87 (1987) and Fabian et al. (Fabian87 (1987)) for X2127+119. The standard ADC model is reviewed by Mason (Mason86 (1986)).
There are two controversial predictions from this model for X2127+119: i) for high inclination systems the neutron star surface is never seen directly, ii) as a result the source is X-ray faint because the system is viewed through an optically thin scattering corona. In the following we suggest that an optically thick scattering corona could account for the peculiar X-ray properties of X2127+119.
5.1 High or low ?
The low X-ray to optical luminosity ratio of is normally given as an argument for X2127+119 being an ADC source in which the observed (but not intrinsic) is low. The low ratio is taken to mean that is low. In this section we address the question: Is the intrinsic really low?.
Comparing X2127+119 with other X-ray sources, whose distances are relatively well defined, namely X1724-307 (Terzan 2), X1746-370 and X1850-087, we find that the X-ray luminosity of X2127+119 is similar to the luminosities of the above systems and that it is only a factor of two fainter than the galactic burst source EXO 0748-676. The only notable exception is the galactic ADC source X1822-371 which is about a factor of five fainter than X2127+119.
We would like to draw attention to the comparison of X2127+119 with the source in the globular cluster Terzan 2, which shows no X-ray eclipses or dips. Therefore assuming that the system is of low inclination we can expect that the X-ray flux observed from Terzan 2 corresponds to the bulk of the X-ray emission from the centre of the disc and the neutron star. The persistent 2-10 keV luminosity of Terzan 2 is erg s-1 (Guainazzi et al. 1998), which is very similar to that of X2127+119.
Substantial evidence therefore exists that points towards a relatively normal level for X2127+119, suggesting that it is the high optical luminosity that is responsible for the low . Indeed this is evident if one looks at the X-ray and optical properties of the 12 known globular cluster low mass X-ray binary systems that are tabulated in Deutsch et al. (Deutsch00 (2000)). One can clearly see that although the X-ray luminosity of X2127+119 has a value similar to many of the other globular cluster systems, its absolute optical magnitude is by far the brightest. In addition, the very broad optical eclipses seen in the optical counterpart of X2129+119 suggest that the optical emission also emanates from an extended region of the system (i.e. the accretion disc and the ADC).
5.2 Do we see the Neutron Star?
Herein lies the heart of the X2127+119 puzzle. The two main arguments that point to the neutron star being hidden from view are: i) the lack of a black-body component in the phase- resolved spectra in our RXTE and ASCA datasets and ii) the X-ray eclipse profile, which does not show evidence of a sharp ingress/egress.
In contrast, results from Dotani et al. (Dotani90 (1990)) and van Paradijs et al. (vanpar90 (1990)), in their study of the burst seen in 1988, suggests that the absence of evidence for reprocessed radiation and the strength of the burst ( counts/s in the GINGA LAC detector) would imply that at the time of the burst the neutron star surface was directly visible. In addition, the fact that the X-ray luminosity of this system is comparable to the X-ray luminosity of presumably more face-on systems (e.g. Terzan 2) and it is also relatively high when compared to other systems where we know we can see the neutron star surface directly (e.g. EXO 0748-676), suggests that we do in fact see the full X-ray flux emitted. Yet, how can we have a high inclination ADC source which is X-ray bright?
5.3 An optically thick corona?
A very large ADC (or X-ray emitting region) is needed in order to account for the very broad eclipses and dips that are observed. Assuming a high inclination system with , an ADC that extends out to 0.8 is required to match the contact points between the limb of the secondary star and the X-ray emitting regions. Such a large ADC is not unreasonable. Fabian et al. (Fabian87 (1987)) pointed out that in a low metallicity system, such as X2127+119, a large ADC is expected. The reason is that the X-rays will stop heating the surface of the disc once they have been sufficiently absorbed. In a low metallicity system photoelectric absorption is not very strong and thus the X-rays can heat and evaporate the surface of the accretion disc out to a larger distance from the center. Using the same model Fabian et al. (Fabian87 (1987)) were also able to produce a system with high optical luminosity by heating the accretion disc with scattered X-ray photons from the corona. This could therefore be the mechanism responsible for the very high optical luminosity of X2127+119.
The problem with an optically thin corona is that only a small fraction of the X-rays produced at the central source of the system would be scattered into our line of sight and thus the system would not exhibit its high X-ray luminosity when compared with other face-on systems. Instead, we suggest that a large optically thick corona would scatter the centrally produced X-rays, diverting a greater number of X-ray photons into our line of sight producing a more nearly isotropic radiation pattern. Hence we would observe most of the emitted luminosity. In addition, the two reasons stated in Sect. 5.2 concerning the visibility of the neutron star itself could be attributed to an optically thick corona, however, the main drawback of this scenario is the lack of reprocessed radiation from the 1988 burst (van Paradijs 1990).
6 Conclusions
From our observations acquired with the RXTE and ASCA satellites we find that:
i) the X-ray source X2127+119 must possess a very large accretion disc corona. Assuming an inclination of we find that we can fit the X-ray light curve with a simple model consisting of an X-ray emitting region whose vertical extent is equal to or greater than its radius. The radius of the ADC required is about . This scenario would require X2127+119 to have an intrinsically high mass transfer rate in order to support such an accretion disc/ADC. Indeed, X2127+119 is the globular cluster system with the longest orbital period, which implies high mass transfer rates.
ii) an optically thick ADC could account for the low X-ray to optical luminosity ratio and that it must be the high optical luminosity of this system which is responsible for the low of 20, not a low .
iii) there is strong evidence of photoelectric absorption during the X-ray dips. However, spectra taken during the main eclipse are difficult to explain. They do require a photoelectric absorption component but they also exhibit various “bumps” and “troughs”, especially at low energies (2-4 keV), which we cannot account for. The level of absorption is seen to be modulated with orbital phase.
iv) models of the X-ray spectra do not prefer strong black-body components, which lead us to assume that the surface of the neutron star is hidden from view, in contrast with the GINGA results of van Paradijs et al. (vanpar90 (1990)) who did not observe any reprocessed radiation during the large 1988 burst. The hardness ratio plot from the GINGA observation (which differs significantly from our RXTE and ASCA observations) suggests that the system might have been in a very different state at the time of the burst.
v) an inconsistency exists with the position of the dip. A disc with a radius of intersects the ballistic trajectory of the stream at an angle of about from the line of centres of the two stars. However, the dip in our 96a RXTE data is seen to end at about phase 0.75, which implies an angle of . A situation where the stream penetrates the disc and produces a bulge at the circularization radius could account for this effect.
Acknowledgements.
We would like to thank Dr. Coel Hellier and Dr. Edward Robinson for useful discussions as well as Dr. A. Beardmore for his help with the data reduction phase. TN was a PPARC Advanced Fellow during most of this work. This research has made use of data obtained through the High Energy Astrophysics Science Archive Research Center Online Service, provided by the NASA/Goddard Space Flight Center and also the Leicester Database and Archive Service at the Department of Physics and Astronomy, Leicester University, UK.7 NOTE ADDED IN PROOF
Following submission of this paper we have learned of the discovery by the Chandra X-ray observatory of a second X-ray source in the core of M15. These results are reported in White & Angelini (2001, ApJ, 561, L101). The new X-ray source named M15 X-2 is actually 1.5 times brighter than X2127+119. The two sources were completely unresolved by all missions prior to Chandra. However, since the M15 X-2 shows very little or no variability, our analysis of the X-ray light curve of the system remains largely unaffected. The main effect of M15 X-2 on the light curve of X2127+119 is the addition of a constant amount of X-ray flux. Thus we now believe that the eclipse of X2127+119 is actually deeper – perhaps even total – than previously thought, further supporting the evidence that this system is of very high inclination, perhaps very close to . This in turn would have the effect of lowering the vertical extent of the ADC, since we no longer need to account for the extra X-ray flux. The discovery of M15 X-2 could explain some of the peculiar properties of X2127+119. If the X-ray bursts originated from M15 X-2 then that explains our difficulty in detecting the neutron star in the spectra of X2127+119. In addition, the strange behaviour of the hardness ratio seen in Fig. 5 and our difficulties in modelling the eclipse spectra could also be attributed to contamination from M15 X-2.
References
- (1) Auriére M., Le Févre O., Terzan A., 1984, A&A, 138, 415
- (2) Callanan P.J., Fabian A.C., Tennant A.F. et al., 1987, MNRAS, 224, 781
- (3) Callanan P.J., Naylor T., Charles P.A., 1989, Accretion powered binaries, ed. Chris Mauche, CUP, 51
- (4) Callanan P.J., 1993, PASP, 105, 961
- (5) Callanan P.J., Drake J.J., Fruscione A., 1999, ApJ, 52, L125
- (6) Charles P.A., Jones D.C., Naylor T., 1986, Nat, 323, 417
- (7) Church M.J. & Bałucińska–Church M., 1998, ApJ, 504, 516
- (8) Corbet R., Peele A., Smith D.A., 1997, IAU Circ., 6632
- (9) Deutsch E.W., Margon B., Anderson F.S., 2000, ApJ, 530, L21
- (10) Djorgovski S.G., 1993, in Structure and Dynamics of Globular Clusters, eds: Djorgovski S.G. & Meylan G.,ASP Conference Series, 50, 373
- (11) Dotani T., Inoue H., Murakami T. et al. 1990, Nat, 347, 534
- (12) Fabian A.C., Guilbert P.W., Callanan P.J., 1987, MNRAS, 225, 29
- (13) Frank J., King A.R., Lasota J.-P., 1987, A&A, 178, 137
- (14) Giles A.B., Jahoda K., Swank J.H., Zhang W., 1995, Proc. Astron. Soc. Aust., 12, 219
- (15) Gottwald M., Haberl F., Parmar A.N., White N.E., 1986, ApJ, 308, 213
- (16) Grindlay J.E., 1993, in The Globular Cluster–Galaxy Connection, ed. Graeme H.S. and Brodie J.P., ASP, 48, 156
- (17) Guainazzi M., Parmar A.N., Segreto A. et al. 1998, A&A, 339, 802
- (18) Hellier C. & Mason K.O., 1989, MNRAS, 239, 715
- (19) Hellier C., Mason K.O., Williams O.R. 1992, MNRAS, 258, 457
- (20) Hertz P., & Grindlay J.E., 1983, ApJ, 275, 105
- (21) Homer L. & Charles P.A., 1998, New Astronomy, 3, 435
- (22) Ilovaisky S.A., Auriére M., Koch-Miramond L. et al. 1993, A&A, 270, 139
- (23) Lamb P. & Sanford P.W. 1979, MNRAS, 188, 555
- (24) Lubow S.H. & Shu F.H. 1975, ApJ, 198, 383
- (25) Mason K.O., 1986, in Physics of Accretion onto Compact Objects, p.29, eds. Mason K.O., Watson M.G. & White N.E., Springer-Verlag, Heidelberg.
- (26) McClintock J.E., London R.A., Bond H.E., Grauer A.D., 1982, ApJ, 258, 245
- (27) Milgrom M., 1978, A&A, 67, L25
- (28) Mitsuda K., Inoue H., Koyama K. et al. 1984, PASJ, 36, 741
- (29) Naylor T., Charles P.A., Hassall B.J.M. et al. 1992, MNRAS, 255, 1
- (30) Parmar A.N., White N.E., Giommi P., Gottwald M., 1986, ApJ, 308, 199
- (31) Pryor C. & Meylan G., 1993, in Structure and Dynamics of Globular Clusters, eds: Djorgovski S.G. & Meylan G., ASP Conference Series, 50, 357
- (32) Raymond J.C. & Smith B.W., 1977, ApJ, 35, 419
- (33) Ryter C., Cesarsky C.J., Audouze J., 1975, ApJ, 198, 103
- (34) Schulz N.S., 1999, ApJ, 511, 304
- (35) Sidoli L., Parmar A.N., Oosterbroek T., 2000, A&A, 360, 520
- (36) Sunyaev R.A. & Titarchuk L.G., 1980, A&A, 86, 121
- (37) van der Klis M., 1997, in X-ray Binaries, ed. Lewin W.H.G., van Paradijs J., van den Heuvel E., Cambridge University Press, p. 277
- (38) van Paradijs J., Dotani T., Tanaka, Y., 1990, PASJ, 42, 633
- (39) White N.E., Becker R.H., Boldt E.A. et al. 1981, ApJ, 247, 994
- (40) White N.E. & Holt S.S., 1982, ApJ, 257, 318