A spectroscopic survey of stars brighter than B=16.6 magnitude in Centauri
Abstract
Using the 2dF multi-fibre instrument at the AAT, we have carried out a spectroscopic survey of over 1500 stars brighter than B=16.6 mag, which have been confirmed by the proper motion study of van Leeuwen et al. (2000) to be members of the massive galactic globular cluster, Centauri. The survey aimed at sampling the Hertzsprung-Russell Diagram in a uniform way, thus avoiding a bias towards the dominant stellar population and allowing the study of stars with less common properties such as particularly metal-rich or metal-poor stars. Exceptionally, though, emphasis has been given to include as many RR Lyrae variables as possible in order to address the question why these variables are distributed over such a wide observed range in colours — coinciding with many non-variable stars of similar colours. The potential of the data and analysis are presented together with the first preliminary results.
Astrophysics Group, School of Chemistry & Physics, Keele University, Staffordshire ST5 5BG (jacco@astro.keele.ac.uk)
1. Introduction
Globular clusters are unique objects, especially for the study of stellar evolution. Each globular cluster contains stars, which are more or less co-eval and at the same fairly well-known distance. This greatly simplifies the study of the evolutionary stages after the exhaustion of hydrogen in the core of these stars: in effect, these post-Main Sequence stars all have about the same Zero-Age Main-Sequence (ZAMS) mass, and comprise a relatively narrow range in metallicity. The great number of such stars, thousands per cluster, makes it possible to accurately derive the mean and shape of the distribution over a particular stellar parameter for a particular evolutionary phase. Examples of short-lived phenomena may be encountered, that last for only years. With typical distances of several kpc, the local galactic globular clusters are sufficiently nearby that photometric and spectroscopic studies are possible for most of the post-Main Sequence evolutionary stages. Different globular clusters show differences in mean metallicity that span more than two orders of magnitude between [Fe/H] and [Fe/H], whilst their ages are all very similar with years. This allows the study of the effects of metallicity on post-Main Sequence evolution, but at the same time it limits such studies to stars with masses M⊙.
The most massive galactic globular cluster, Cen is favourably located at a distance of kpc from the Sun and kpc from the galactic centre (Harris 1996). Membership has been determined on the basis of a recent proper motion survey for all stars with mag (van Leeuwen et al. 2000), resulting in a near-complete sample of stars that have evolved beyond the base of the first-ascent red giant branch (RGB). The mean metallicity of stars in Cen is with [Fe/H] very typical, but a rather large spread in metallicity has been suggested in recent years, which has subsequently been interpreted in terms of a spread in age over a few Gyr (Norris et al. 1996). As such, Cen is an excellent object for the study of post-Main Sequence stars albeit with the possible complication of a spread in abundances — which in itself merits further investigation. Many clusters differ from each other also in other respects, for instance the specific frequency of X-ray binaries, and the morphology of the horizontal branch is known to depend not only on the mean cluster metallicity. The formation history of the cluster may be important too. Therefore, studying the properties of the evolved stars in Cen can help us understand the evolution of stars with M⊙ and the formation and evolution of globular clusters, but it will probably not provide a complete picture. Also, as the mean metallicity is not as high as in some other globular clusters that have [Fe/H], it might be difficult to probe and study dust in the outflows of red giants in Cen, and the effect of this dust on the further evolution of the stars as well as its fate in the intra-cluster medium.
2. Scientific objectives
With the availability of multi-fibre spectroscopes at large telescopes, and a magnitude-limited inventory of membership and photometry for the upper part of the Hertzsprung-Russell Diagram (HRD) of Cen, it was decided to perform a spectroscopic survey of a significant fraction of the number of post-Main Sequence stars. The aim was to obtain effective temperatures and elemental abundances for stars across the upper HRD, as well as other diagnostics for the conditions in the stellar atmospheres such as gravity, micro-turbulence, rotation and temperature inversion layers, which in principle will provide us with a map on which the path of evolution is outlined by the changing structure of the stellar atmosphere and interior. This can be used to test the results obtained from photometric studies, to break degeneracies encountered in photometric analyses, and to put previous spectroscopic work into a global perspective in order to arrive at a consistent picture of post-Main Sequence evolution in Cen. In addition we may find spectroscopic binaries, measure radial velocities to confirm membership and study the kinematics within the gravitational potential, or detect faint absorption by the intra-cluster medium as well as the intervening inter-stellar medium.
2.1. Abundances
The spread in metallicities as deduced from photometric and limited spectroscopic studies of RGB stars needs to be confirmed and refined using direct spectroscopic determinations of a statistically sound sample of stars. Although ideally these would be Main Sequence stars with photospheres in Local Thermodynamic Equilibrium, stars on the RGB are next best, having suffered relatively little from astrophysical processes that enrich or deplete surface abundances. Care should be taken to also sample the wings of the distribution in order not to be biased towards the most common examples. This can then set the stage for careful modelling of the stellar ages. The initial metallicity, exact ZAMS mass and binarity are some of the most fundamental parameters that will determine the further evolution of a star, and this should be consistent with observations of stars that have evolved beyond the base of the RGB. Therefore, the metallicity distribution should be investigated at different heights along the RGB and at subsequent evolutionary stages such as the Horizontal Branch (HB) and Asymptotic Giant Branch (AGB). More detailed analysis of the abundance spectrum may reveal the effects of astrophysical processes such as mixing, magnetic fields, nuclear burning and stellar winds on the post-Main Sequence evolution.
2.2. Variability
Many variable stars are known in Cen (Kaluzny et al. 1997; van Leeuwen et al. 2000), most of which are radial pulsators. Pulsation of stellar mantles is an important phenomenon because it affects the structure of the stellar surface and interior, and it can affect the evolution of the star through mixing and/or mass loss as well as the evolution of close binaries. Pulsation can also be used as a tool to determine global stellar parameters and/or to probe the structure of the stellar interior. For instance, the pulsation period and luminosity can be used to estimate the (pulsation) mass of the star, which can then be reconciled with the predicted mass on the basis of evolutionary models. The observed discrepancy between these two estimates for Cepheid variables is often interpreted as evidence for the loss of M⊙ on the RGB.
The number of variable stars is dominated by RR Lyrae variables in the instability strip between the RGB and blue-HB, with typical periods around half a day. In Cen the range in colours of the RR Lyrae stars is surprisingly broad. This might be due to an extended range in for stars in the instability strip as a result of the metallicity spread in Cen. This could then also be responsible for the observed large number of RR Lyrae colour “mimics” — stars that have similar colours and luminosities as the RR Lyrae variables but that do not pulsate. This hypothesis may be tested spectroscopically.
Other variables include bright red Long Period Variables (LPVs) with typical periods of (a few) 100 days. These are commonly found on the AGB, but there are indications that stars near the tip of the RGB also pulsate. Spectroscopy of these LPVs may shed light on their RGB or AGB nature, on the particular conditions in the stellar mantles and the possible connection with significant mass loss. A few more blue variables are found at luminosities above the HB but below the evolutionary tracks of post-AGB stars, and their nature is yet to be determined (see van Leeuwen et al. 2000). They may be on their way from the blue-HB to the early AGB, or they may be stars that do not make it all the way onto the AGB — the so-called “AGB manqué” stars. Again, spectroscopic analysis of the content and conditions in their photospheres may provide an answer.
3. Observations
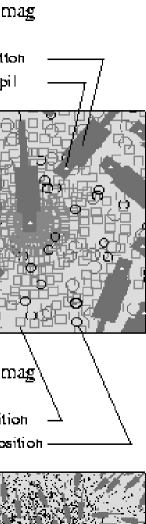
Multi-object spectroscopy was performed using the 2dF (two degree field) fibre-fed spectroscope at the 4m Anglo Australian Telescope on the four half nights of 26 & 27 February and 1 & 2 March 2000. The 2dF instrument provides 400 fibres of for the acquisition of light from stars or sky positioned within a field diameter of . Two (thinned) CCDs of 1k1k each record 200 spectra produced by the fibre-fed spectrograph. Four additional fibres are used for field acquisition and guiding on four bright stars (fiducials). Fig. 1 shows typical fibre allocations for stars in Cen. The extent to which stars in the core of the cluster can be accessed is not so much due to crowding relative to the fibre aperture but due to the considerable physical size of the button which holds the fibre. Grating 1200B was chosen to acquire spectra from up to Å (B-band) at a spectral resolution of Å () with an efficiency of 50 to 60%. The sample of targets was divided into a sample of bright targets with mag, which spectra were integrated for minutes, and a sample of faint targets with mag, which spectra were integrated for minutes. While one plate of fibre allocations was being exposed, another plate of fibres was being prepared for the next set of targets.
The data were reduced within the dedicated 2dFdr software package. This includes bias subtraction and flatfield correction, wavelength calibration using spectra of an arc lamp (Fe/Ar), spectrum tracing and extraction, and a correction for scattered light. Sky subtraction was performed offline by constructing a radial grid of sky spectra in order to account for the contribution to the sky from the unresolved stellar population of Cen. The contamination within the fibre aperture by the light from neighbouring stars was estimated by using the photometric survey data from Kaluzny et al. (1997), which is fairly complete down to the limits of our spectroscopic survey. Only 15 (1%) of the observed stars and 4 (%) of the observed sky positions suffer from contamination in excess of 1%, with a maximum of %.
4. Target selection
The main objective was to cover the upper HRD in a uniform fashion, as much as possible including outliers. Initially, the proper motion survey of van Leeuwen et al. (2000) provided us with 9847 objects, of which we selected stars with a % probability of cluster membership. Stars were rejected if they had other known objects within a distance of or (in a few cases only) if no & photometry was available for them. The uniform colour-magnitude selection was established on the basis of a grid with & mag. For each of these grid boxes, stars were assigned priorities according to their distance from the cluster centre, with the highest priority for the most distant star — which was thought to probably yield the highest quality spectra for stars of a particular magnitude and colour. Some boxes contain as few as zero objects, but from none of the boxes were drawn more than a few objects. In addition to the uniformly selected sample, the interest in the RR Lyrae variability strip led us to include all 150 variables from van Leeuwen et al. (2000) and all 134 RR Lyrae colour mimics with & mag, plus the well-known and brightest cluster member HD 116745 (Fehrenbach’s star). The remaining brightest red giants were used to define a sample of cluster members to act as fiducials. The sky positions were drawn from a concentric grid of 2295 positions at an increasing density towards the cluster core after excluding positions with a known star within .
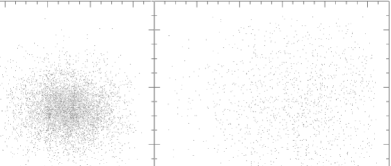
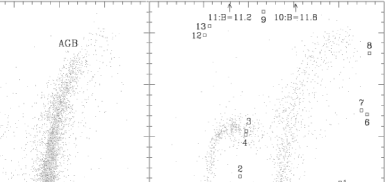
A total of 9 configurations were used to obtain spectra of 1528 different stars in Cen, of which 238 stars were repeated on another occasion, down to mag at S/N, together with a total of 1135 spectra on 692 unique sky positions. The distributions on the sky and across the HRD of the % cluster members and the observed stars amongst them are shown in Figs. 2 & 3, respectively. As a result of the selection procedure the spatial distribution is not centrally concentrated. The HRD is covered relatively uniformly except for the RR Lyrae region from which most targets were in fact observed. However, quite many of the stars from sparsely populated regions in the HRD could not be observed because they tend to lie in the central densest regions of the cluster.
5. Examples
To give a flavour of the quality of the spectra and their potential use, a few examples are presented and briefly discussed. Labelled from 1 to 13, they are more or less ordered along the evolutionary path of a star (Fig. 3) as it ascends the RGB, progresses through the HB and ends via the AGB as a post-AGB object. The 5-digit numbers in the spectra are their entries in the proper motion catalogue of van Leeuwen et al. (2000). All spectra are clearly red-shifted by Å with respect to the laboratory wavelengths of the strongest lines, which is consistent with membership of Cen ( km s-1).
5.1. Red and blue RGB stars

After having left the Main Sequence, 0.8 M⊙ stars spend most of their remaining life on the RGB. Therefore, the RGB is densely populated and ideal for the study of the metallicity distribution. Photometric determinations of the mean value for the metallicity are often quite accurate, but photometry in the crowded core of globular clusters causes observational scatter which might mimic extended wings in the metallicity distribution. As a cautionary example, therefore, two stars were selected that have & magnitudes ressembling respectively very red and very blue RGB stars. Their K-type spectra turn out to be virtually identical (Fig. 4): weak hydrogen Balmer lines, but strong absorption by the Ca ii H & K lines and by the G-band. Many weak absorption lines from metals (i.e. not noise!) can be seen, and these may be used in future analysis of the detailed abundance spectrum of the RGB stars. These two stars are only a few arcminutes away from the centre of Cen, and hence their photometry is less reliable. The red star is the only one amongst the 12 stars with & mag for which a spectrum was obtained, because they all lie in the core region of Cen.
5.2. RR Lyrae variables and colour mimics
The RGB evolution terminates with the ignition of helium in the stellar core. If the star is of low mass and metallicity, it will continue to evolve along the HB, passing through a phase where the mantle is unstable against radial pulsation. These pulsations are easily detected as photometric variability with amplitudes of tenths of a magnitude and periods of several hours up to a day. An example of the spectrum of such an RR Lyrae-type variable ( days) in Cen is presented in Fig. 5, along with the spectrum of another member of Cen which has almost identical & magnitudes but which is not seen to pulsate — i.e. a colour mimic. The spectrum of the variable star contains many faint absorption lines of metals and strong absorption by Ca ii, in stark contrast to the spectrum of the non-variable star that is dominated by hydrogen Balmer lines with remarkably strong absorption wings. A more detailed analysis of the chemical content and physical conditions of the photospheres of these and other RR Lyrae variables and colour mimics may clarify the reason for both their differences and similarities. Also, for some of these stars, spectra were taken more than once and hence their variability may be studied spectroscopically.

5.3. Extreme horizontal branch
In some globular clusters, the HB extends to very blue colours indicative of high photospheric temperatures. In extreme cases such as observed in Cen, the photosphere can become so hot that the maximum of continuum emission shifts sufficiently into the ultra-violet to render optical photometry insensitive to . In the versus diagram, for instance (Fig. 3), the extreme blue-HB bends over to become a “Vertical Branch” near mag with the stars becoming optically fainter as more of their light is radiated at wavelengths Å. The morphology of the HB is observed to differ substantially amongst globular clusters with similar metallicity, and it is not yet understood what is the “second parameter(s)” responsible for this: age in combination with mass loss on the RGB may not be sufficient (Catelan 2000), but binary evolution may be important (Maxted et al. 2001). An example of an extreme blue-HB star is given in Fig. 6: a hot continuum with strong hydrogen Balmer absorption lines, very weak He i and no Ca ii (except for an interstellar component). As this is one of the fainter stars in our spectroscopic sample, most of the structure seen in the continuum is probably due to noise.
5.4. Cool giants
After core-helium burning extinguishes, stars of M⊙ may ignite hydrogen in a shell surrounding the electron-degenerate core and ascend the AGB. Stars that fail to do so (AGB manqué stars) drop off the HB towards the white dwarf cooling tracks. In some colour-magnitude diagrams the early-AGB blends with the RGB. In the versus diagram of Cen (Fig. 3), the RGB-tip is reached at mag and hence the (red) stars brighter than this must be on the AGB. However, as the mantle of both RGB and AGB stars inflates enormously, their photosphere cools to K, radiating most of the light at wavelengths Å. Hence their optical brightness diminishes if their colours become redder than mag. If circumstellar dust is formed around these cool stars, they become even redder and fainter at optical wavelengths. Because the mantles of very cool giants become unstable against radial pulsations, and because the surface gravity is very low and the formation of molecules and/or dust in their extended atmospheres promotes driving a wind, AGB stars enter a phase of high mass-loss rates ( M⊙ yr-1) during which they shed their entire mantles (van Loon 2001). What happens for stars near the tip of the RGB is not yet known, but it is believed that as much as M⊙ much be lost on the RGB (Fusi Pecci & Renzini 1976).

The spectra of two very cool stars (M3–4) in Cen are presented in Fig. 7. It is not certain whether these stars are on the AGB or on the RGB, although their position in the versus diagram (Fig. 3) suggests they may be at the tip of the distinct red RGB that is currently being interpreted as due to a (small) population of relatively metal-rich stars (Pancino et al. 2001, and references therein). Their photospheres are sufficiently cool to show strong absorption by TiO molecules. One of the two stars exhibits hydrogen Balmer line emission which may arise from shocks travelling through a pulsating atmosphere. Indeed, this star, #33062 is known to be variable in an irregular way, but the timescale of variability of days (van Leeuwen et al. 2000) is surprisingly short for a cool giant and inconsistent with radial pulsation. The other star, #35250 is also a known irregular variable with days — typical for pulsation of a red giant even though its spectrum does not show line emission.

5.5. A reddened AGB star?

With mag, #44277 is the reddest star of which a spectrum was obtained (Fig. 8), and indeed the reddest member of Cen down to mag. It is probably an AGB star of spectral type about M0. The spectral slope, however, is much steeper than expected for such spectral type: compare, for instance, with the spectra of the much cooler giants in Fig. 7. Is the photosphere of this star really as cool as the spectral slope suggests, and does the early spectral type merely reflect a very low metallicity? Or is the spectral slope reddened by intervening dust? The latter explanation is quite plausible for a star near the tip of the AGB: the dust may be of circumstellar origin and have formed in the outflow from the AGB star. The rather moderate spectral type may indeed be due to low metallicity, causing a consequently warm photosphere for a mass-losing AGB star and hence a relatively small stellar radius. The (irregular) variability and its relatively short period of days (van Leeuwen et al. 2000) are consistent with the interpretation of a metal-poor mass-losing AGB star. The mass-loss rate must then be quite high in order to produce as much dust as is needed to cause the observed reddening, as the dust-to-gas ratio in the outflow is (probably linearly) proportional to the metallicity (van Loon 2001).
5.6. Luminous post-AGB stars

The evolution along the AGB terminates when most of the mantle has been consumed by nuclear burning and/or has disappeared as a result of mass loss. Mass loss dominates over mass consumption for AGB stars of M⊙ (van Loon 2001), but this is not well documented for less massive stars. The star leaves the AGB because the hot core becomes exposed and hence the photospheric temperature increases dramatically, at first whilst maintaining its high luminosity before the nuclear-burning shell finally extinguishes. By then, the star has become a white dwarf that gradually cools and faints. Two examples of such luminous post-AGB stars in Cen are presented in Fig. 9. Their spectra show hydrogen Balmer line emission in one case (#43105), and partly filled-in absorption in the other case (#32029) where the contrast with the bright continuum is smaller. The line emission is probably of circumstellar origin, the hot core illuminating the rarefied material from its former mantle. Both spectra show quite strong Sr ii and Ba ii absorption lines indicative of an enhancement of s-process material which was dredged-up during the AGB phase from the nuclear burning layers through the convective mantle into the photosphere (van Loon 2001). Both stars are known variables with periods of days for #43105 and days for #32029 (van Leeuwen et al. 2000).
5.7. Fehrenbach’s star

The brightest member of Cen in the B-band, Fehrenbach’s star (HD 116745) is a post-AGB star (Gonzalez & Wallerstein 1992). Its spectrum (Fig. 10) shows strong hydrogen Balmer lines in absorption: line emission may be too weak to see against the bright continuum, or alternatively the circumstellar ionized material may already have dispersed by the time it took the star to evolve to its present position in the HRD. Again, absorption lines of the s-process elements Sr ii and Ba ii are indicative of the post-AGB nature of this object.
5.8. Luminous hot stars

As a last example, spectra are presented of two bright hot stars (Fig. 11), which presumably are post-AGB objects. Despite them having very similar B & V-band photometry, their spectra are quite different. Both have hot continua, but star #39220 is clearly (much) hotter than star #30020 as evidenced by the violet upturn of the continuum and the strong He i absorption lines. There is only a weak trace of the strongest amongst the He i lines in the spectrum of #30020 which, besides strong hydrogen Balmer absorption lines, is almost featureless except for an interstellar component of Ca ii and a narrow (interstellar?) Mg ii absorption line. The hydrogen Balmer lines in the spectrum of #39220 are relatively weak, possibly due to the high and/or a hydrogen deficiency in the photosphere of this highly evolved post-AGB object.
6. Status and future
Using the 2dF instrument at the AAT, we have obtained 1766 high quality spectra of 1528 confirmed members of Cen, in the wavelength range of to Å at a resolving power of . It covers the upper regions of the HRD including almost completely the HB and most of the RGB, with the emphasis on sampling the extremes of the distribution of stars in the HRD plus the variable and non-variable stars in the RR Lyrae part of the instability strip.
The data reduction is nearly finalised, and all spectra will eventually be made available to the astronomical community. The analysis of the spectra is about to start, and will first aim at spectral classification in order to construct a physical HRD (). When possible, metallicities and abundance spectra will be derived, which can then be used to reconstruct the star formation and chemical enrichment histories of Cen. The changes in the abundance spectra along the evolutionary paths in the HRD may help us understand the morphology of the HB, the properties of the RR Lyrae variables and RR Lyrae colour mimics, and dredge-up processes on the RGB and AGB. Emission-line objects, reddened stars and post-AGB candidates will receive particular attention in order to study mass loss from red giants in globular clusters.
Future multi-object spectroscopes with smaller fibre pupils, finer gratings, larger CCDs, at 8m-class telescopes allow the described spectroscopic study to be extended: (i) in wavelength, especially 5000 to 9000 Å, to cover more spectral diagnostics for the determination of , the abundance spectrum, surface gravity, etcetera; (ii) to higher spectral resolution in order to better measure line profiles for analysis of the physical conditions in the photosphere, decompose blended lines and measure kinematics; (iii) to fainter stars, including main-sequence stars (see the contribution by Russell Cannon to these proceedings); (iv) to other galactic globular clusters and nearby dwarf spheroidals.
Acknowledgments.
I would like to thank the organisers for giving me the opportunity to present this work at a pleasant and interesting conference, all the participants from whom I have learnt a lot, and Joana.
References
Catelan M., 2000, ApJ 531, 826
Fusi Pecci F., Renzini A., 1976, A&A 46, 447
Gonzalez G., Wallerstein G., 1992, MNRAS 254, 343
Harris W.E., 1996, AJ 112, 1487
Kaluzny J., Kubiak M., Szymanski M., et al., 1997, A&AS 125, 343
Maxted P.F.L., Heber U., Marsh T.R., North R.C., 2001, MNRAS 326, 1391
Norris J.E., Freeman K.C., Mighell K.J., 1996, ApJ 462, 241
Pancino E., Ferraro F.R., Bellazzini M., Piotto G., Zoccali M., 2001, ApJ 534, L83
van Leeuwen F., Le Poole R.S., Reijns R.A., Freeman K.C., de Zeeuw P.T., 2000, A&A 360, 472
van Loon J.Th., 2001, in: IAU Colloquium 185 “Radial and Nonradial Pulsations as Probes of Stellar Physics”, eds. C. Aerts, T. Bedding & J. Christensen-Dalsgaard. ASP.Conf.Ser. (astro-ph/0110167)