Multi-wavelength Surveys for Distant Clusters
Abstract
Given the importance of clusters to the fields of cosmology and galaxy evolution, it is critical to understand how the cluster detection process affects (biases) ones scientific conclusions derived from a given cluster sample. I review the astrophysics, algorithms, and observational constraints that must be considered when attempting to assess cluster selection biases and their impact on the scientific constraints derived from multi-wavelength cluster surveys. In particular, one can more accurately quantify and understand the selection biases and assess cluster evolution when using joint optical/NIR/x-ray surveys than can be achieved when employing any single cluster survey.
Space Telescope Science Institute, 3700 San Martin Drive, Baltimore, MD 21208, U.S.A.
1. Introduction
It is well appreciated by this audience that clusters of galaxies are important as tracers of mass on intermediate and large scales and as laboratories for exploring galaxy evolution. Recently, the application of coordinated multi-wavelength observations has significantly enhanced our understanding of the physics of cluster formation and evolution. In particular, the use of multi-wavelength data
-
•
enables studies of a broad range of physical processes which control cluster and cluster galaxy evolution,
-
•
expands the accessible redshift range,
-
•
enhances detection of distant large-scale structure (e.g., intercluster filaments) via joint passband detection methods, and
-
•
minimizes false positive detections and improves ones understanding of sample selection biases.
Now that the era of objective cluster detection across wide wavelength ranges is upon us, it is critical to ask “How does the cluster detection process affect (bias) the scientific conclusions?” This is an important question because different types of clusters can be found by different algorithms and/or at different wavelengths. The different detection outcomes are a consequence of a cluster detection S/N ratio that is generally a function of redshift, survey passband, and the mathematical details and statistical properties of the detection algorithm applied.
The wavelength-dependent differences in the properties of clusters are directly related to the physical phenomena that dominate the clusters “visibility.” In the x-ray passbands (0.1 – 10 keV), it is the hot intracluster medium (ICM) that is being detected. The ICM in clusters typically shines with a luminosity in the range . A luminous, centrally condensed ICM usually indicates a cluster in a state of dynamical equilibrium with a fairly deep gravitational potential. In the optical and near-IR passbands (0.6 – 2.2), it is one or more of the following that is being detected: a large overdensity of galaxies, a population of early-type galaxies with a narrow optical/NIR color range, and/or the distortion of the images of background galaxies due to gravitational lensing by the cluster. A large galaxy overdensity does not necessarily imply a well-relaxed or massive cluster. Hence, optical/NIR based surveys may include systems of significantly lower mass and/or age than those found in x-ray based surveys. The spectral energy distribution of most clusters peak in the optical/NIR with luminosities in the range . The millimeter wavebands (200 – 300 GHz) are ideal for detection of the Sunyaev-Zeldovich effect. The detection of the SZ effect is independent of redshift in as much as the electron density in the ICM and the effective electron temperature is independent of redshift (i.e., if and are functions of time, then so will be the amplitude of the SZ decrement). SZ based surveys have great potential for detecting systems in a quite homogeneous manner out to . However, the presence of a significant ICM is obviously required. At the longest wavelengths (1.4 – 30 GHz), detection of radio loud cluster galaxies at very high redshifts and detection of galaxies with bent radio lobes (suggesting passage through an ICM) can be achieved. Because radio-loud cluster galaxies may not always be a by-product of cluster formation, radio-based cluster surveys have significant selection biases. They are, nonetheless, capable of detecting systems at the highest redshifts ().
2. Astronomical & Observational Considerations
In addition to a variety of astrophysical parameters that dictate the area, depth, and geometry of a distant cluster survey, there are also several important observational considerations that must be accounted for. An obvious one is the much greater availability of optical/NIR facilities relative to x-ray telescopes. This makes completing large area surveys in the optical/NIR much easier. Competing with this is the fact that the detection of the ICM is a relatively unambiguous indicator of the physical reality of the cluster candidate. The pros and cons of performing cluster surveys in x-ray, optical, and SZ bandpasses are summarized in the table below.
The lack of a significant background in the x-rays is a key advantage of looking for clusters in this wavelength range. Figure 1 shows a beautiful example of this in the form of Chandra/ACIS imaging of the Lynx supercluster complex at (Stanford et al. 2001). However, such x-ray images require a large investment of telescope time (190 ksec in the example here). The same clusters can be easily detected in NIR images with th the exposure time. In addition, the presence of a significant background in the optical/NIR when searching for clusters at intermediate and high redshifts has lead to the development of several smart algorithms which selectively suppress the background and, in doing so, yield relatively accurate () redshift estimates for the cluster candidates. Having these redshift estimates greatly accelerates the science that can be extracted from a survey conducted primarily111I say primarily because the use of color information can provide a quasi-third dimension that eliminates projection effects on scales larger than km s-1. in two dimensions. Note that the Lynx cluster in Figure 1, CL0848+4453, was initially discovered in a NIR image (Stanford et al. 1997).
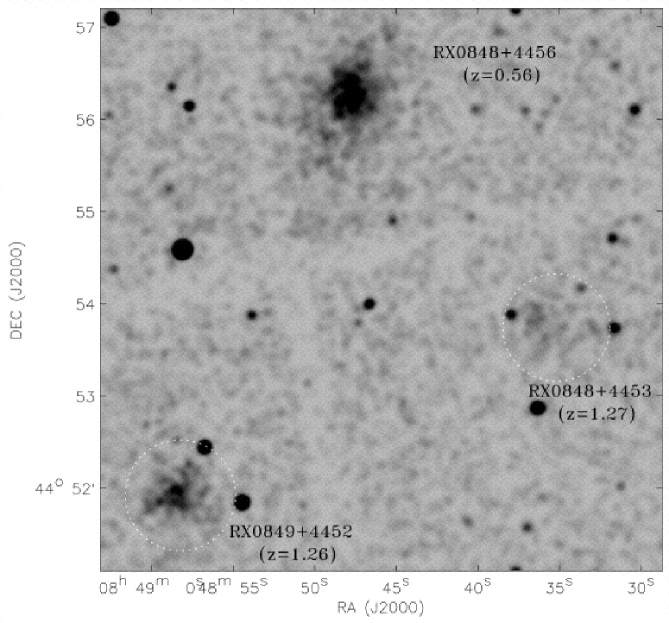
Figure 2 summarizes the cluster survey area–depth parameter space covered to date (with a few near-future surveys included). This figure is modeled after that in Ebeling et al. (2001) but includes optical and NIR surveys as well. Survey flux limits have been converted to common cgs units for comparison across a broad wavelength range. Although the primary science motive for each listed survey is not always the study of cluster evolution, each one is well suited to the search for distant clusters. Within a given passband, the survey flux limit is an indicator of the effective redshift depth of the survey. However, in order to directly compare effective depths across a large spectral range one must also understand how the cluster and galaxy luminosity functions vary with wavelength. Fortunately, this is relatively well known. The characteristic luminosity of clusters in the x-ray (0.5 – 2 keV), and the characteristic luminosity of cluster galaxies in the optical (0.8), and NIR (2.2) passbands are plotted for and . Also shown are curves which indicate the areas and depths at which one would expect to find 10 and 100 clusters, respectively, with erg s-1 at any z (Ebeling et al. 2001).

| X-ray Surveys | Optical/NIR Surveys | SZ (mm) Surveys |
|---|---|---|
| Detection of ICM is an | Large areas can be surveyed | Detection of decrement |
| unambiguous indicator of | relatively quickly | requires ICM, an |
| a real cluster | unambiguous indicator of | |
| Many telescopes available | a real cluster | |
| High contrast | ||
| High QE detectors | SZ signal is independent | |
| Background is negligible | (modulo ICM evolution) | |
| Many algorithms | ||
| Low (10%) spurious rate | produce cluster redshift | Limited telescope access |
| estimate | ||
| Limited telescope access | Large area surveys are time | |
| 30% spurious rate (in 2D) | intensive but upgrades to | |
| Large area surveys are | BIMA/OVRO could cut | |
| time intensive | Background is significant, | time by factor of 10 |
| need “smart” algorithms | ||
| Requires optical/NIR | ||
| follow-up for redshifts | Optical richness - cluster | |
| mass relation is noisy |
Recent deep optical/NIR surveys are now reaching areas in excess of 100 square degrees enabling the discovery of the richest clusters at and the study of the evolution of the moments of the cluster distribution. In this regard, optical/NIR surveys still provide the largest numbers of distant () cluster candidates. However, new untargetted SZ surveys and very wide area x-ray surveys (e.g., MACS) provide substantial potential for the creation of distant cluster catalogs with very low contamination rates. The NOAO Deep Wide survey (Jannuzi et al. 2000) and the proposed Primordial Explorer (see http://prime.pha.jhu.edu) mission will provide superb datasets, enabling detection and study of clusters out to .
An optimal cluster survey strategy would be to take advantage of the benefits of each particular passband by observing a given region of sky in optical/NIR and x-rays. At the least, this will yield important constraints on differences in the selection functions at these wavelengths. At best, this will produce a comprehensive set of data with which to study cluster evolution. While this is currently difficult to do to sufficient depth to study distant clusters over a large area of sky, it is feasible over regions of a few square degrees. Indeed, several teams have recently done precisely such studies either using existing x-ray data and re-imaging in the optical (Donahue et al. 2001) or using existing optical data and searching in x-ray archives for the corresponding high energy imaging (Holden et al. 1999). I review the conclusions reached from these two studies later in this talk to demonstrate the important constraints that multi-wavelength distant cluster surveys can yield. First, however, I will briefly review the cluster detection algorithms in use today, emphasizing some of the wavelength dependent pros and cons of each, as well as highlighting the importance of quantifying the selection function prior to attempting scientific analysis of any objectively derived cluster sample.
3. Cluster Detection Algorithms
The advancement of cluster detection algorithms has benefited greatly from the adaptation of well-known signal and image processing techniques to astronomical use. These include matched filters (e.g., Postman et al. 1996, Kawasaki et al. 1998, Kepner et al. 1999, Lobo et al. 2000, Gladders & Yee 2000) and adaptive wavelet transforms (e.g., Rosati et al. 1995). Other methods come to astronomy from the realm of multi-parametric statistical and clustering analysis such as the Voronoi Tessellation Technique (e.g., Scharf et al. 1997, Ramella et al. 2001). One characteristic of distant clusters, almost regardless of observational bandpass, is that they are relatively low contrast features222The contrast of a distant cluster in a survey is often low because the survey goal is to cover a modest to large area at the expense of depth. The contrast of the same cluster in a given bandpass can, of course, be increased by increasing the exposure time as in the Chandra/ACIS example in Figure 1.. A key property of many of the above methods is, thus, to take the basic input data (e.g., , an x-ray image or a galaxy catalog) and process it in a manner that significantly enhances the contrast. For example, the matched filter algorithm developed by Postman et al. (1996), and modified further by Kepner et al. (1999), enhances the contrast of a cluster observed in the band sufficiently to turn a fluctuation in raw galaxy counts into a fluctuation in the matched filter signal. Similarly, the color cut used by Gladders & Yee (2000) in their red-sequence detection method can transform a fluctuation in galaxy counts (due to a cluster) into a fluctuation. Most of the methods above can be applied at a wide range of redshifts and over a broad spectral range. Exceptions include methods which rely on cluster characteristics that span a limited spectral range (e.g., the red galaxy sequence) or are best applied in the optical/NIR (e.g., detection of gravitational lensing). Because each method comes with advantages and disadvantages, using multiple methods is desirable. Multiple algorithm application can assure high completeness across a broad range of cluster properties.

Indeed, the use of multiple algorithms highlights the importance of determining an accurate selection function. Figure 3, adopted from the work of Goto et al. 2001, shows an example of the differences in the richness and redshift distributions of cluster candidates identified using 4 different detection methods applied to identical data. The input data was the early release data from the Sloan Digital Sky Survey. The differences in the resulting cluster catalogs can be understood as a consequence of the different selection function each algorithm yields. Accurate interpretation of cluster data is thus critically dependent on accurate estimation of the relevant selection function.
An example of how cluster selection might affect scientific conclusions is a comparison of the recent work of Dressler et al. 1999 and Poggianti et al. 1999 (MORPHS) versus that of Balogh et al. 1999 and Ellingson et al. 2001 (CNOC). The CNOC study used 15 x-ray selected ( erg s-1) clusters in the redshift range . These clusters are mostly rich, relaxed systems. The CNOC clusters also exhibit a prominent E/S0 red sequence in their color-magnitude diagrams. The 10 MORPHS clusters were primarily optically selected and lie in a similar redshift range, . They span a wide range of mass and , with 40% being classified as “irregular” in their overall morphology (as traced by the galaxy distribution). The CNOC clusters are reported to contain a low A galaxy fraction of 4.5% and after correction for scatter this value decreases to 1.5%. The field A fraction, for comparison, is 1 – 2%. In contrast, the MORPHS survey finds a significantly larger A fraction of % and a significant excess of post-starburst galaxies. The MORPHS study also concludes that star formation in clusters is truncated relatively quickly ( Gyr). The CNOC study finds no excess starburst or post-starburst activity relative to the field and concludes that cluster galaxy star formation is truncated gradually over a 2 – 3 Gyr period. How can these two studies reach such different conclusions given the similarity in sample size and redshift range? The answer may, in part, lie in the different selection biases associated with optical vs. x-ray selection. X-ray luminous clusters at tend to be dynamically older systems – as indicated by the existence of a well-established and centrally-compact intracluster medium. Their galaxy populations, at least within the central 500 kpc, are dominated by early type galaxies with a narrow range in optical color. While such systems would easily be detected in optical surveys, systems that are dynamically younger may often not satisfy the minimum x-ray luminosity constraint and would thus be systematically excluded from an x-ray selected survey. Infall of late type galaxies into clusters may be more prominent in younger clusters and, hence, so to the presence of starburst and post-starburst objects. While one cannot attribute all differences between the CNOC and MORPHS survey results to the cluster selection process (e.g., some of the differences are likely due to differences in the data analysis or data quality), it is clearly an important factor.
4. Case Studies
To better understand the consequences of using x-ray and optical selection criteria, as well as to improve constraints on cluster evolution in general, it is essential to study a common region of sky in multiple wavelengths. Two recent works, the CFHT Optical PDCS Survey (COPS; Holden et al. 1997, 1999, 2000; Adami et al. 2000) and the ROSAT Optical X-ray Survey (ROXS; Donahue et al. 2001), have done just this and have reached some interesting conclusions which are worth reviewing here.
In the COPS study, the ROSAT archive was searched for PSPC data with exposure times of 3 ksec or more and lying within 40 arcminutes of the centers of 31 optically selected clusters from the Palomar Distant Cluster Survey. The x-ray data were then processed using the SHARC source detection software (Romer et al. 2000). A cumulative x-ray luminosity function (XLF) was derived from the resulting extended source catalog and compared with previous XLFs from Burns et al. (1996), Ebeling et al. (1997), Burke et al. (1997), and Rosati et al. (1998). Of the 31 PDCS clusters studied, 7 (23%) were detected in the x-ray data. The cumulative XLF of both the detections and the upper limits are consistent with those from previous x-ray selected samples. Holden et al. conclude that optical selection does not appear to miss a significant number of x-ray emitting clusters within a given area and that optical selection finds both intrinsically luminous and intrinsically faint ( erg s-1) x-ray clusters. Of course, the errors on the derived XLF in the COPS study are substantial given the small sample. Further, while this effort was the first to systematically explore objectively derived optical and x-ray cluster samples it was not a double blind experiment – the existence of an optically selected cluster was the trigger for the ROSAT archive search.
The ROXS study takes the spirit of the COPS study and raises it one level higher by performing completely independent optical and x-ray cluster detection over a common 4.8 deg2 area. The ROXS x-ray data are 23 deep ( 8 ksec) ROSAT PSPC pointings. Optical images in the and passbands were obtained for each ROSAT pointing. An adaptive wavelet algorithm (Rosati et al. 1995) was applied to the ROSAT images to detect extended sources. A matched filter algorithm was applied to the optical data to detect clusters and derive an optical richness estimate, , which corresponds to an effective optical luminosity. The availability of complete x-ray and optical data over the same sky area enabled the ROXS team to generate entirely independent cluster catalogs. The two catalogs were compared in a variety of ways and the following key results derived:
-
•
57 x-ray detections and 155 optical detections were found. 72% of the x-ray candidates are co-identified in the optical survey. Of the remaining 28%, one third are bona fide optically faint candidates. The rest are systems with poor x-ray flux measurements.
-
•
Most optically selected clusters are real if the relationship is steep. The best fit is .
-
•
There is no need to hypothesize a sizeable population of optically rich, x-ray faint clusters. The observed cluster distribution is consistent with a steep relation in which there is also significant scatter between x-ray and optical luminosity and a false positive rate (in the optical) of %.
Indeed, if the slope of the relation is steeper than 2 and , then the ratio of clusters will continue to increase with mass (at least into the moderate mass range of ROXS clusters). Specifically, if then . Figure 4 shows this prediction overplotted on actual observational data obtained for low redshift clusters (Hradecky et al. 2000).

5. Goals for Multi-wavelength Distant Cluster Surveys
Multi-wavelength surveys for distant clusters have conclusively demonstrated their value in quantifying wavelength-dependent selection biases, establishing fundamental relationships between global cluster properties, and for predicting and characterizing key evolutionary trends. The near term goals for the current and next generation of cluster surveys will likely focus on addressing the following key scientific questions:
-
•
How do global cluster properties (mass, gas fraction, mass profile) depend on the size of the early type galaxy population, star formation rate, and internal kinematics. For example, is the red sequence unique to virialized clusters?
-
•
How does clustering on large-scales evolve? Cluster surveys are now reaching volumes and depths that enable detection of several hundred clusters with . The utility of clusters as tracers of large-scale structure has been proven at low redshift and that same advantage can now be employed at .
-
•
How do clusters themselves evolve? The assembly of a statistically complete sample of clusters in the range over an area of deg2 is within reach of current technology (NIR mosaic cameras, more efficient millimeter band receivers for SZE detection). Coupled with spectroscopic, HST, and x-ray observations, such a large survey will yield precise constraints on cluster evolution.
To achieve these goals, equally dedicated efforts must be undertaken in the development and/or enhancement of cluster detection algorithms (e.g., , see Nichol et al. 2001) and improved methods for comparing and analyzing independently derived cluster catalogs over a broad spectral range. This is especially important given the current or near future availability of homogeneous multi-wavelength surveys that have significant sky overlap (e.g., 2MASS, SDSS, ROSAT/MACS, MAP, PRIME). The LSST (Tyson, Wittman, & Angel 2000) holds the potential for wide-area “mass”-selected cluster catalogs, substantially simplifying the scientific interpretation of the resulting cluster samples. In all these efforts, however, the question of understanding how the cluster detection process affects the scientific conclusions must always be in the fore.
References
Adami, C., Holden, B. P., Castander, F. J., Mazure, A., Nichol, R. C., Ulmer, M. P. 2000, A&A, 362, 825.
Balogh, M. L., Morris, S. L., Yee, H. K. C., Carlberg, R. G., Ellingson, E. 1999, ApJ, 527, 54.
Burke, D. J., Collins, C. A., Sharples, R. M., Romer, A. K., Holden, B. P., Nichol, R. C. 1997, ApJ, 488, L83.
Burns, J. O., Ledlow, M. J., Loken, C., Klypin, A., Voges, W., Bryan, G. L., Norman, M. L., White, R. A. 1996, ApJ, L49.
de Propris, R., Stanford, S. A., Eisenhardt, P. R., Dickinson, M., Elston, R. 1999, AJ, 118, 719.
Donahue, M., Mack, J., Scharf, C., Lee, P., Postman, M., Rosati, P., Dickinson, M., Voit, G. M., Stocke, J. T. 2001, ApJ, 552, L93.
Dressler, A., Smail, I., Poggianti, B. M., Butcher, H., Couch, W. J., Ellis, R. S., Oemler, A., Jr. 1999, ApJS, 122, 51.
Ebeling, H., Edge, A. C., Fabian, A. C., Allen, S. W., Crawford, C. S., Boehringer, H. 1997, ApJ, 479, L101.
Ebeling, H., Edge, A. C., & Henry, P. 2001, ApJ, 553, 668.
Ellingson, E., Lin, H., Yee, H. K. C., Carlberg, R. G. 2001, ApJ, 547, 609.
Gladders, M. D. & Yee, H. K. C. 2000, AJ, 120, 2148.
Goto, T. et al. 2001, AJ, submitted for publication.
Holden, B. P., Romer, A. K., Nichol, R. C., Ulmer, M. P. 1997, AJ, 114, 567.
Holden, B. P., Nichol, R. C., Romer, A. K., Metevier, A., Postman, M., Ulmer, M. P., Lubin, L. M. 1999, AJ, 118, 2002.
Holden, B. P., Adami, C., Nichol, R. C., Castander, F. J., Lubin, L., Romer, A. K., Mazure, A., Postman, M., Ulmer, M. P. 2000, AJ, 120, 23.
Hradecky, V., Jones, C., Donnelly, R. H., Djorgovski, S. G., Gal, R. R., Odewahn, S. C. 2000, ApJ, 543, 521.
Jannuzi, B. T., Dey, A., Tiede, G. P., Brown, M. J. I., NDWFS Team 2000, B.A.A.S., 197, 7709.
Kawasaki, W., Shimasaku, K., Doi, M., Okamura, S. 1998, A&AS, 130, 567.
Kepner, J., Fan, X., Bahcall, N., Gunn, J., Lupton, R., Xu, G. 1999, ApJ, 517, 78.
Lobo, C., Iovino, A., Lazzati, D., Chincarini, G. 2000, A&A, 360, 896.
Nichol, R. C. et al. 2001, astro-ph/0110230.
Poggianti, B. M., Smail, I., Dressler, A., Couch, W. J., Barger, A. J., Butcher, H., Ellis, R. S., Oemler, A., Jr. 1999, ApJ, 518, 576.
Postman, M., Lubin, L. M., Gunn, J. E., Oke, J. B., Hoessel, J. G., Schneider, D. P., Christensen, J. 1996, AJ, 111, 615.
Postman, M., Lauer, T. R., Szapudi, I., & Oegerle, W. 1998, ApJ, 506, 33.
Ramella, M., Boschin, W., Fadda, D., Nonino, M. 2001, A&A, 368, 776.
Romer, A. K., Nichol, R. C., Holden, B. P., Ulmer, M. P., Pildis, R. A., Merrelli, A. J., Adami, C., Burke, D. J., Collins, C. A., Metevier, A. J., Kron, R. G., Commons, K. 2000, ApJS, 126, 209.
Rosati, P., Della Ceca, R., Burg, R., Norman, C., Giacconi, R. 1995, ApJ, 445, L11.
Rosati, P., Della Ceca, R., Norman, C., Giacconi, R. 1998, ApJ, 492, L21.
Scharf, C. A., Jones, L. R., Ebeling, H., Perlman, E., Malkan, M., Wegner, G 1997, ApJ, 477, 79.
Stanford, S. A., Elston, R., Eisenhardt, P. R., Spinrad, H., Stern, D., Dey, A. 1997, AJ, 114, 2232.
Stanford, S. A., Holden, B., Rosati, P., Tozzi, P., Borgani, S., Eisenhardt, P. R., Spinrad, H. 2001, ApJ, 552, 504.
Tyson, J. A., Wittman, D., Angel, J. R. P., 2000, in proceedings of the Dark Matter 2000 conference (Santa Monica, February 2000) to be published by Springer, astro-ph/0005381.
Voit, M., & Donahue, M. 1999, private communication.