The X-ray – radio alignment in the radio galaxy PKS 1138–262
Abstract
We present high resolution X-ray observations of the narrow line radio galaxy PKS 1138262 at z = 2.156 with the ACIS-S detector on the Chandra observatory. These observations show that the X-ray emission from 1138–262 is dominated by emission from the active galactic nucleus (AGN) with a 2 to 10 keV luminosity of erg s-1. The relative X-ray and radio properties of the AGN in 1138–262 are similar to those seen for the AGN in the archetype powerful radio galaxy Cygnus A.
Between 10 and 25 (depending on energy) of the X-ray emission from 1138–262 is spatially extended on scales of 10′′ to 20′′. The extended X-ray emission is elongated, with a major axis aligned with that of the radio source. While the X-ray and radio emissions are elongated on similar scales and position angles, there is no one-to-one correspondence between the radio and X-ray features in the source. The most likely origin for the extended X-ray emission in 1138–262 is thermal emission from shocked gas, although we cannot rule-out a contribution from inverse Compton emission. If the emission is from hot gas, the gas density is 0.05 cm-3 and the gas mass is M⊙. The pressure in this hot gas is adequate to confine the radio emitting plasma and the optical line emitting gas. We set an upper limit of erg s-1 to the (rest frame) 2 to 10 keV luminosity of any normal cluster atmosphere associated with 1138–262.
No emission was detected from any of the Ly emitting galaxies in the (proto-) cluster around 1138–262, outside of the Ly halo of 1138–262 itself, to a (rest frame) 2 to 10 keV luminosity limit of erg s-1. Emission was detected from a QSO located 2′ west of 1138–262 with a luminosity of erg s-1.
Subject headings: cosmology – large scale structure; galaxies – active; radio continuum – galaxies; X-rays – galaxies, clusters)
1 Introduction
Radio galaxies are the most massive galaxies known at high redshift, and have been shown to reside in regions of high ambient gas and galaxy density (Röttgering, Best, & Lehnert 1999; McCarthy 1993). As such, these sources provide unique laboratories for the study of the formation of galaxies and clusters of galaxies, acting as beacons to biased galaxy formation within large scale structure at high (Carilli et al. 2001).
One of the more extensively studied high redshift radio galaxies in a dense environment is the source PKS 1138–262 at (Pentericci et al. 1997). The 1138–262 radio source has the most disturbed morphology of any radio galaxy yet identified, appearing as a string of bright knots with a total linear extent of 15′′ (Carilli et al. 1997). The radio source is enveloped in a Ly emitting halo with a luminosity of erg s-1, spatially extended on a scale of 20′′ and with a major axis oriented along the radio source axis (Pentericci et al. 1997). There are clear spectroscopic signatures of strong interaction between the expanding radio source and the ambient gas (Kurk et al. 2001). The polarized radio emission from 1138–262 shows the most extreme values of Faraday rotation of any source at , with (rest frame) rotation measures (RMs) up to 6250 rad m-1 (Carilli et al. 1997). These RMs are comparable to values observed toward low powerful radio galaxies in dense, X-ray emitting cluster atmospheres. For the low sources the origin of the large RMs is thought to be magnetized cluster gas, with magnetic fields of a few G or more (Carilli & Taylor 2001).
High resolution optical images show that the parent galaxy of 1138–262 is comprised of many compact ‘knots’ of emission distributed on a scale of 10′′. Wide field imaging and spectroscopy with the VLT has revealed many compact Ly emitting galaxies distributed on arcminute scales around 1138–262 (Pentericci et al. 2000), with an implied over-density of objects similar to proto-clusters recently discovered in searches for UV dropout galaxies by Steidel et al. (1998). Pentericci et al. (2000) interpret these results on 1138–262 as indicating a forming giant elliptical galaxy within a proto-cluster.
Carilli et al. (1998) searched for X-ray emission from 1138–262 using the HRI detector on ROSAT. While the source was clearly detected, the sensitivity and spatial resolution of the ROSAT observations were insufficient to determine the relative contribution to the X-ray luminosity from the AGN and possible extended emission. In this paper we present Chandra observations which clarify the X-ray emission processes in 1138–262. While the dominant X-ray source is the AGN, we also detect an extended soft X-ray emission component with an extent and orientation similar to the radio source. We consider mechanisms for this extended emission, and discuss the origin of the X-ray – radio alignment in 1138–262. We use Ho = 65 km s-1 Mpc-1, , and , leading to DL = 18300 Mpc and Dθ = 1844 Mpc (1′′ = 9 kpc). We defined spectral index, , as a function of frequency, , and flux density, Sν, as: .
2 Observations and Results
PKS 1138–262 was observed for 40 ksec on June 6, 2000, with the back-illumiated ACIS-S CCD detector array on the Chandra Observatory (Weisskopf, O’Dell, & Van Speybroeck, 1996; Garmire 1997). The source was positioned one arcmin from the standard aim point so as to avoid the node boundary on the ACIS-S3 chip. Standard ACIS settings were used: TE mode with 3.2 s readout and ’faint’ telemetry format. The data were reprocessed in 2001Jan. For analysis of extended regions the event file was filtered to reject times of high background, resulting in a a live-time of 28 ksec. For unresolved sources we use the entire observation (live-time of 39.5 ksec). Data analysis was performed using the CIAO 2.1 software package for spectroscopic imaging. Image analysis was also performed using the Astronomical Image Processing System.
2.1 Images
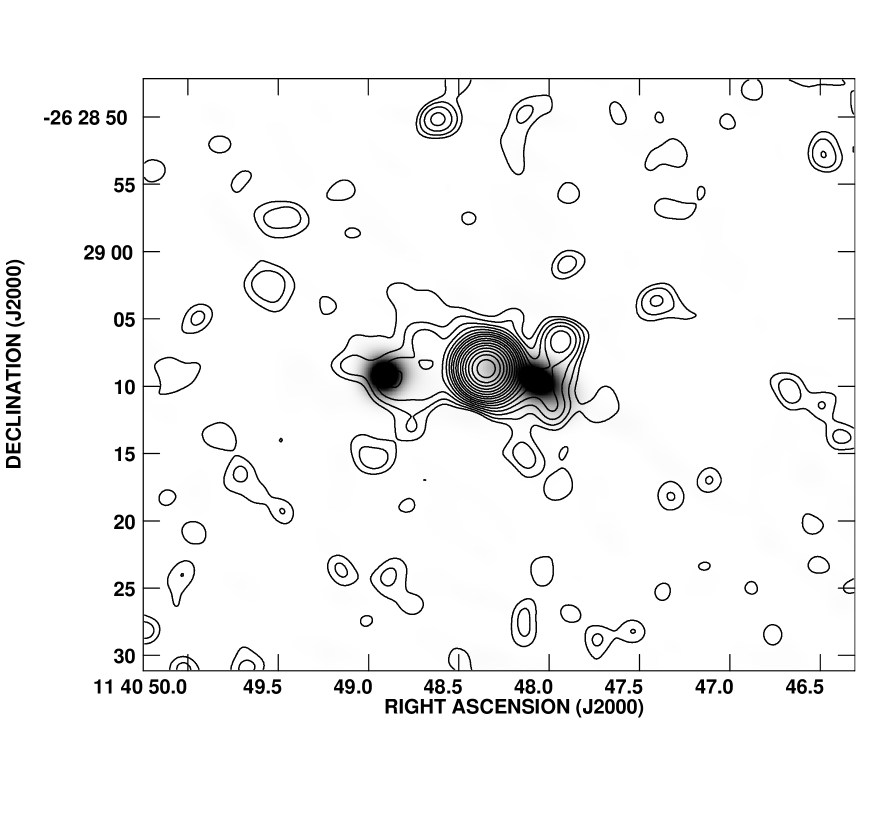
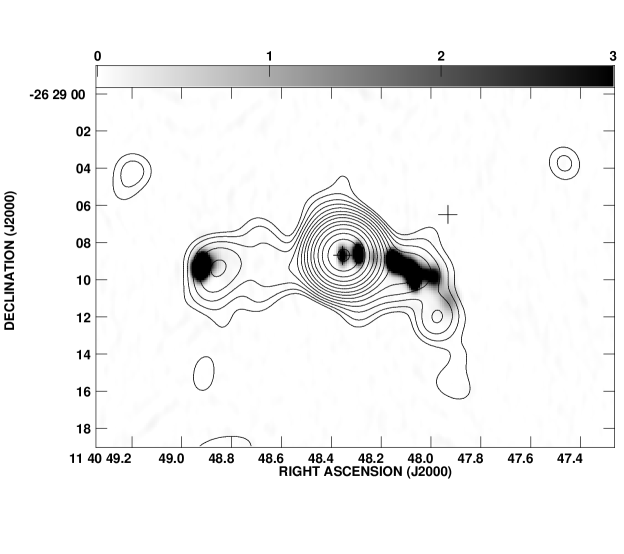
Figure 1 shows the Chandra total X-ray image (energy range = 0.3 to 10 keV), convolved with a Gaussian of Full Width at Half Maximum (FWHM) of 2′′, along with the VLA radio image at 1.4 GHz, 2′′ resolution in greyscale (from Carilli et al. 1997). A total of 880 counts are detected in a box centered on the radio galaxy. We estimate a background contribution in this box of 102 counts.
Two components are evident in Figure 1: (i) compact emission at the location of the AGN, and (ii) extended emission on a scale of about 20′′. Comparison of the compact AGN component to the Chandra point spread function, and Gaussian fitting, shows that the emission is unresolved with a size . The total emission from the nucleus is 663 counts. There is also a point source about 5′′ northwest of the nucleus which contains 15 counts at a position of 11h 40m 47.93s, –26o 29′ 06.5′′ (J2000). This source is also detected in the Ly and the HST images, but not in the 5 GHz image to a 3 limit of 90Jy (Figure 2a). Subtracting the background and the two point sources leads to 9830 counts for the extended emission from 1138–262, or 13 of the total.
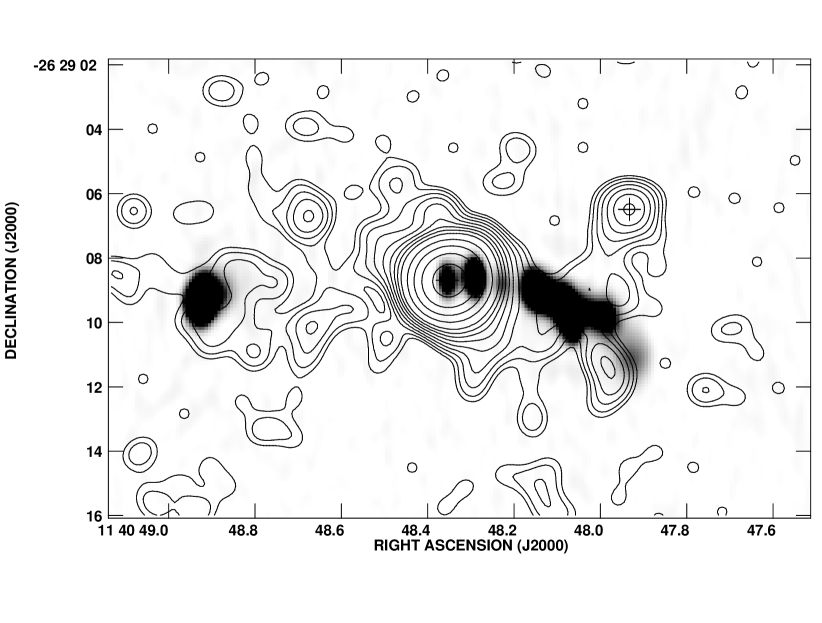
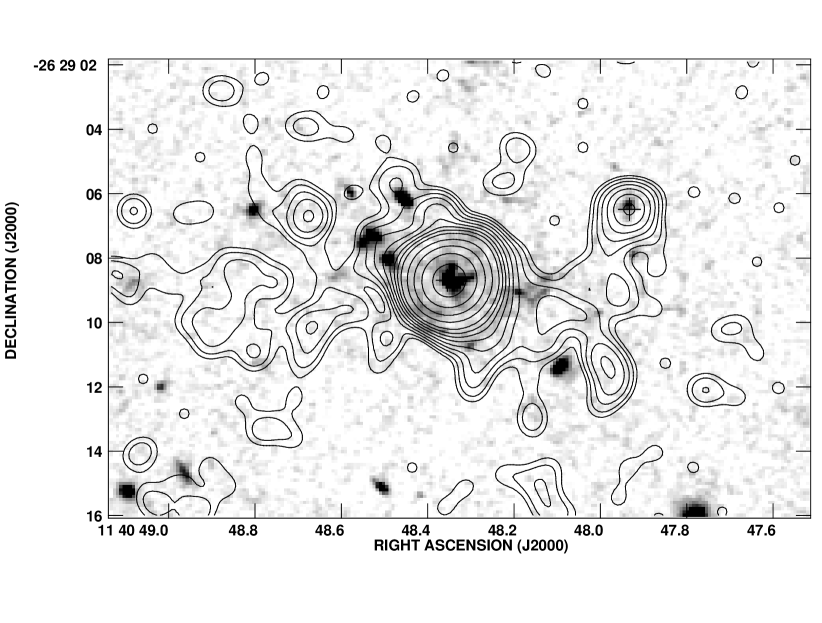
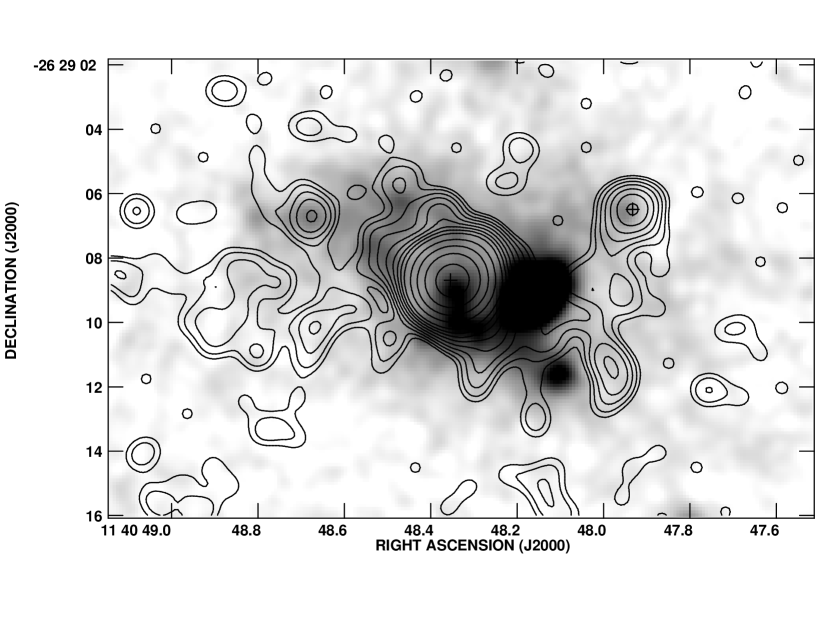
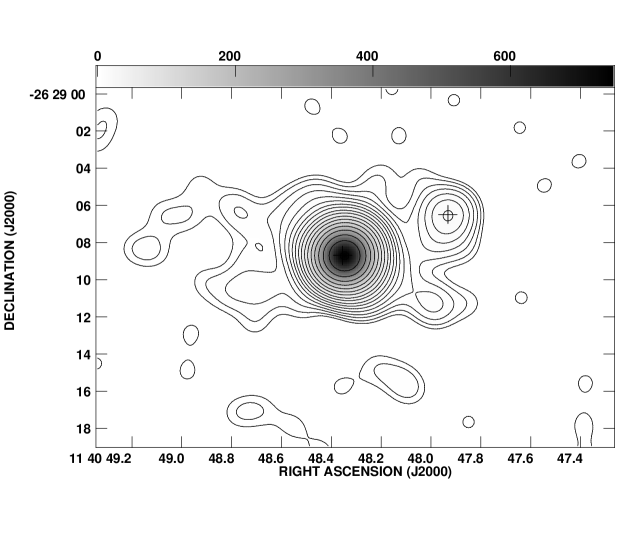
Figure 2a shows the image of total X-ray emission from 1138–262 convolved with a Gaussian of FWHM = 1′′, along with the radio image at 5GHz, 0.5′′ resolution (2a), the HST F606W image (2b), and the VLT Ly image (2c). The position of the nucleus of 1138–262 as determined in near IR images, H line images, and the HST image, is 11h 40m 48.37s, –26o 29′ 08.9′′ 0.1′′ (J2000) using USNO astrometry (Monet et al. 1996). The radio nucleus is located at 11h 40m 48.35s, –26o 29′ 08.8′′ 0.1′′, implying that the radio and optically determined positions for the nucleus are within 0.2′′ of each other. The nominal astrometry from Chandra places the X-ray nucleus at 11h 40m 48.31s, –26o 29′ 08.6′′, or and away from the radio position in RA and Dec, respectively. This is consistent with the offset seen for the QSO in the 1138–262 field (see below), and with the mean offsets of and in RA and Dec, respectively, between radio and X-ray positions of sources in the Abell 370 field found by Barger et al. (2001). In the analysis below, the images at different frequencies are aligned using the nucleus.
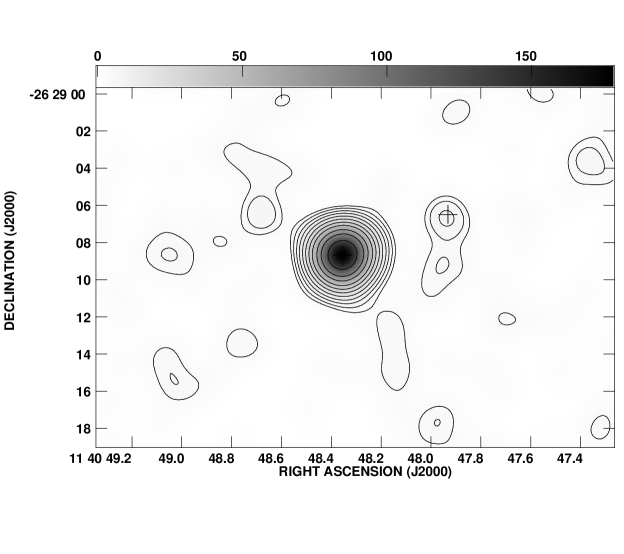
Figure 3 shows the X-ray emission in three energy bands: 0.3 to 1.2 keV (3a = soft), 1.2 to 2.4 keV (3b = mid), and keV (3c = hard). The 5 GHz radio continuum emission is shown in greyscale in Figure 3a. The extended X-ray emission is softer than the emission from the nucleus, while the emission from the point source 5′′ northwest of the nucleus is harder. For the soft image the extended emission contributes to the total source counts. This percentage drops to for the mid energy range, and in the hard X-ray image.
Figure 4 shows the surface brightness profiles averaged azimuthally in rings centered on the nucleus of 1138–262 for quadrants oriented parallel and perpendicular to the radio axis. The profile along the radio axis shows extended emission to about 12′′ radius. For illustrative purposes we have fit a standard cluster model to the on-axis profile, as shown with the solid line. The formal results for the model parameters are and . This value of is much steeper than what is expected for a typical cluster atmosphere, even for high redshift clusters, for which is observed typically (Stanford et al. 2001). Such a steep may simply reflect the fact that the extended emission region is clearly not circularly symmetric, but is highly elongated. An elongated morphology will lead to a decrease in the fractional emitting area intercepted with increasing annular radius, and hence an artificially steep radial profile. Perhaps a more interesting result in Figure 4 is that the profile perpendicular to the radio source axis shows very little emission beyond about 4′′ distance from the nucleus. Averaging the signal out to 12′′ radius, excluding the inner 5′′, shows that the luminosity of the extended emission perpendicular to the radio source major axis is less than 25 of that seen along this axis.
We have searched for X-ray emission from the Ly emitting galaxies in the (proto) cluster around 1138–262 (Pentericci et al. 2000). There are no detected X-ray sources within 1′′ of any of the cluster galaxies, outside of the Ly halo of 1138–262 itself. The 3 upper limit to the 2 to 10 keV X-ray luminosities of these sources is erg s-1, assuming a standard powerlaw spectrum of spectral index . X-rays are detected from a QSO located 2′ west of 1138–262 (Pentericci et al. 2000), at 11h 40m 39.73s –26o 28′ 44.9′′ (J2000). A total of 56 counts are detected from this source, implying an X-ray luminosity of erg s-1 for .
2.2 The X-ray Spectra
The X-ray spectrum of the nuclear emission from 1138–262 is shown in Figure 5. The spectrum is reasonably fit by a power-law with , plus absorption at the redshift of the source of N(HI) = cm-2. The reduced for the fit is 0.52, and the error bars for the fit parameters represent changes in reduced by . The Galactic value of N(HI) in this direction is cm-2 (Stark et al. 1992). The unobscured 2 to 10 keV luminosity for the nucleus is erg s-1. The implied extinction toward the nucleus is , assuming a Galactic dust-to-gas ratio. This large extinction may explain the lack of strong Ly emission from the nucleus of 1138–262. For completeness, we note that the nuclear spectrum can be equally well fit by a thermal spectral model (Raymond-Smith) with keV.
Considering the radio properties of 1138–262, the luminosity between rest frame frequencies of 1 to 10 GHz for the nucleus of 1138–262 is: erg s-1. The radio luminosity for the entire source for rest frame frequencues of 0.1 to 1.0 GHz is: erg s-1 (Carilli et al. 1997).
The archetype powerful radio galaxy Cygnus A has a highly absorbed X-ray emitting nucleus with N(HI) = cm-2 and an unobscured 2 to 10 keV luminosity of erg s-1 (Ueno et al. 1994). The radio nucleus of Cygnus A has erg s-1, and the radio luminosity for the entire source from 0.1 to 1.0 GHz is erg s-1 (Carilli et al. 1991). Hence, to within a factor two for both 1138–262 and Cygnus A: , and . Ward et al. (1996) show that the obscuration corrected properties of the X-ray nucleus of Cygnus A are typical of broad line radio galaxies.
Due to the paucity of counts, the spectrum of the extended X-ray emission from 1138–262 is very poorly constrained, with an allowed range 0.8 to 15 keV for a Raymond-Smith thermal plasma emission model. In the analysis below we adopt a value of 5 keV. The implied 2 to 10 keV (rest frame) luminosity for the extended emission is then erg s-1. Further observations of 1138–262 are required to constrain this important parameter.
3 Discussion
The most interesting aspect of the extended X-ray emission from 1138–262 is that it is oriented along the radio axis and has a similar spatial extent. There are a number of possible mechanisms to explain this emission, and its alignment with the radio axis.
3.1 Inverse Compton, synchrotron, and scattering
One mechanism for the extended X-ray emission from 1138–262 is synchrotron radiation from the relativistic electrons in the radio lobes. The total extended X-ray emission corresponds to Jy at 2 keV. The radio spectral index for the integrated emission from 1138–262 at cm wavelengths is –1.1, and the integrated flux density from the source at 5 GHz is 160 mJy (Carilli et al. 1997). Extrapolating the radio spectrum to 2 keV ( Hz) implies an expected flux density of Jy. Hence the X-ray emission cannot be a simple extrapolation of the radio synchrotron spectrum. The spectrum would have to flatten at frequencies above 15 GHz. Such a flattening can be ruled-out by the fact that the predicted I-band ( Hz) emission would be Jy, while the upper limit is Jy.
A second possibility is Thompson scattering of X-ray emission from the nucleus. This is easily ruled out since the spectrum of the extended X-ray emission is different than that of the nucleus.
A third possible mechanism is inverse Compton (IC) emission, ie. up-scattering of the cosmic microwave background (CMB) by the relativistic electrons in the radio source. In this case comparing the radio synchrotron and X-ray IC emission constrains the magnetic fields within the radio source, since both depend on the relativistic electron population. Using equation 11 in Harris and Grindlay (1979), and using the integrated flux densities of the extended emission from 1138–262 in the radio and X-ray, the resulting magnetic field is 7G assuming . For comparison, the minimum energy magnetic field is about 200 G in the radio source (Carilli et al. 1998). Whether the fields and particles conspire to reach a minimum configuration remains unknown, however, a field value a factor 30 lower than the minimum energy value raises the internal pressure by a factor 150. If the fields are at the minimum energy level, then IC emission constitutes 0.1 of the total extended X-ray emission.
Brunetti et al. (2001) have shown that in some sources the energy density in the photon field in the radio lobes due to optical/IR photons from the AGN is larger than that in the CMB. In principle, this would allow for larger magnetic fields in the radio lobes. However, assuming a luminous (obscured) AGN of optical through IR luminosity erg s-1 in 1138–262 (as adopted by Brunetti et al. for 3C 295), and correcting the energy density in the CMB for redshift, it is clear from their Figure 2 that the energy density in the photon field will be dominated by the CMB beyond about 10 kpc from the nucleus. The X-ray emission in 1138–262 extends well beyond this radius.
Perhaps the most telling argument against IC being the dominant emission mechanism for the X-rays seen from 1138–262 is that there are off-sets between the positions of high surface brightness radio and X-ray emitting features (see Figures 1 and 2). In all radio galaxies for which IC X-ray emission has been seen, it is coincident with high surface brightness radio features (Harris et al. 2000, Harris, Carilli, & Perley 1994). If the dominant photon field is the microwave background, the observed X-rays are predominantly from electrons with Lorentz factors , corresponding to radio emission at 270 MHz for . These data imply that if the X-ray emission is IC, then the radio morphology of the source would have to change significantly from low to high frequencies. High resolution images at frequencies MHz are required to test this hypothesis, although 1.4 GHz images show no dramatic change in the source morphology relative to that seen at 5 GHz.
3.2 Hot Gas
A final mechanism we consider is thermal emission from hot gas. The extended emission from 1138–262 has a 2 to 10 keV luminosity of erg s-1. For comparison, the cluster atmosphere enveloping the powerful radio galaxy Cygnus A has a 2 to 10 keV luminosity of erg s-1 (Arnuad et al. 1987). The Cygnus A cluster atmosphere is roughly azimuthally symmetric, with a FWHM kpc (Reynolds and Fabian 1996). The spatial extent of the X-ray emission from 1138–262 is confined to a region of kpc, and is aligned along the radio axis. So while the extended X-ray luminosities are within a factor two for Cygnus A and 1138–262, the relative volumes differ by a factor of about 30. The implication is that the density of hot gas in 1138–262 must be a factor of five or so larger than that seen in Cygnus A, implying gas densities cm-3. The mass in hot gas is M⊙.
The pressure in the hot gas is dynes cm-2, assuming K. The minimum pressure in the radio source is dynes cm-2, while the pressure in the Ly emitting gas is about dynes cm-2 (Pentericci et al. 1997). The pressure in the hot gas appears to be roughly adequate to confine both the radio source and the low filling factor, line emitting clouds. Note that this confinement mechanism applies only to the Ly emitting regions within the maximum radius of the X-ray source.
The cooling time for such gas is years, which is more than an order of magnitude larger than the dynamical timescale for the system, but a factor three shorter than the age of the universe at that redshift. A possible heating mechanism of this gas is the expanding radio source, ie. the X-ray emission is from the ‘cocoon’ of shocked material enveloping the radio source, as predicted by dynamical models of supersonically expanding jets (Begelman, Blandford, & Rees 1986). Assuming that the radio luminosity is of the jet kinetic luminosity implies a lower limit to the jet kinetic luminosity of ergs s-1. The total energy stored in the X-ray gas is about ergs. So it appears that the radio jet could have heated the medium over a timescale of years, which is reasonable for a radio galaxy of the size of 1138–262 (Blundell & Rawlings 1999).
Our search for X-ray emission from 1138–262 was originally motivated by the extreme values of Faraday rotation, with the idea that the source is embedded in a dense, magnetized cluster atmosphere. While we have detected extended X-ray emission, the morphology of the emitting regions is distinctly different than that expected for a normal cluster atmosphere. So whence the large rotation measures? If the X-ray emission is from the coccoon of shocked gas around the radio lobe, then large rotation measures will occur if the shocked material contains magnetic fields of order 20 G, ordered on scales of a few kpc (Bicknell, Cameron, & Gingold 1990).
The lack of extended emission perpendicular to the radio source axis allows us to set an upper limit to the 2 to 10 keV luminosity of an extended (relaxed) cluster atmosphere around 1138–262 of erg s-1, or of the X-ray luminosity of the Cygnus A cluster. So while the overdensity of galaxies in the region suggests that the system will evolve into a massive cluster, the lack of an extended X-ray atmosphere is consistent with the idea that it is not yet a dynamically relaxed system. This is also suggested by the irregular velocity distribution of the Ly emitting galaxies (Pentericci et al. 2000).
The lack of a hot cluster atmosphere also implies that the ambient medium into which the radio source is expanding in 1138–262 is very different than the diffuse cluster atmospheres at K seen in similar luminosity radio galaxies at lower redshift, such as Cygnus A and 3C 295. This difference is consistent with the suggestion by Rees (1989) that the environments of radio galaxies consist of a multiphase medium of cool ( K) clouds or filaments, embedded in a virialized medium at 106 to 107 K. The passage of the bow shock driven by the expanding radio source would have a number of effects in such a multiphase medium (Kaiser & Alexander 1999). Rees (1989) points out that the densest clouds are relatively unaffected by the passage of the shock, and may be induced to collapse and form stars by the high pressure medium in which they suddenly find themselves (cf. Icke 1999). The intermediate density clouds are shocked, but the cooling time is shorter than the jet lifetime, perhaps giving rise to some of the Ly emission directly associated with bright radio features. The lower density, higher filling factor gas is shock heated to , giving rise to the extended X-ray emission.
Barthel and Arnaud (1996) have proposed a selection effect in radio galaxies in which jets propagating through regions of higher gas density have a higher conversion efficiency of jet kinetic energy into radio luminosity (see also Eales 1992). If the ambient medium is anisotropically distributed, then radio jets of a given kinetic luminosity propagating along the direction of highest ambient density will be brighter than ones propagating through low density regions. In this case, preferential alignment between the jet axis and the axis of highest density of the ambient material will occur naturally in radio flux limited samples (West 1999).
A final comparison we make is with the recent observations of the extended X-ray emission around the radio galaxy 3C 294 by Fabian et al. (2001). The observations of 3C 294 show a similar alignment between the X-ray and radio axes as that seen in 1138–262, and a similar lack of one-to-one correspondence between high surface brightness radio and X-ray features. In particular, for 3C 294 the X-ray emission extends significantly beyond the radio source maximum radius. Fabian et al. (2001) interpret the extended X-ray emission as being thermal emission from a cooling flow cluster atmosphere. Using the temperature-luminosity relation for X-ray emitting cluster atmospheres, they show that the existence of such a system at this high redshift argues for a low universe. Inherent in this argument is that the gas temperature is a gross measure of the gravitational mass of system. For 1138–262 we have argued that the gas heating is due to the expanding radio source, and hence unrelated to the gravitational potential of the system.
The existence of a hot, high filling factor, thermal gas in high radio galaxies has long been hypothesized in order to confine both the radio source and the optical line emitting clouds (Chambers et al. 1990, Bremer et al. 1992). It may be that in 1138–262 the Chandra observatory has revealed this pervasive hot medium.
The National Radio Astronomy (NRAO) is a facility of the National Science Foundation, operated under cooperative agreement by Associated Universities, Inc.. DEH and CLC acknowledge support from NASA grant GO0-1137B. DEH acknowledges support from NASA contract NAS8-39073. We acknowledge support from a programme subsidy provided by the Dutch Organization for Scientific Research (NWO).
References
Arnaud, K.A., Fabian, A.C., Eales, S.A, et al. 1987, MNRAS, 227, 241
Barger, A.J., Cowie, L.L., Mushotzky, R.F., & Richards, E.A. 2001, AJ, 121, 622
Barthel, P.D. & Arnaud, K. 1996, M.N.R.A.S. (letters), 283, 45
Begelman, M.C., Blandford, R.D., & Rees, M.J. 1984, Rev. Mod. Phys., 56, 255.
Bicknell, G.V., Cameron, R.A., & Gingold, R.A. 1990, ApJ, 357, 373
Blundell, K.M. & Rawlings, S. 1999, Nature, 399, 330
Bremer, M. N., Fabian, A. C., Sargent, W. L. W., Steidel, C. C., Boksenberg, A., Johnstone, R. M. 1992, MNRAS, 258, 23L
Brunetti, G., Cappi, M., Setti, G., Feretti, L., & Harris, D.E. 2001, A&A, 372, 755
Carilli, C.L., Perley, R.A., Dreher, J.W., & Leahy, J.P. 1991, ApJ, 383, 554
Carilli, C.L., Röttgering, H.J.A., van Ojik, R., Miley, G.K., & van Breugel, W.J.M. 1997, Ap.J. (Supp.), 109, 1
Carilli, C.L., Harris, D.E., Pentericci, L., Roetterging, H.J.A., Miley, G.K., & Bremer, M.N. 1998, ApJ, 496, 57L
Carilli, C.L., Miley, G.K., Röttgering, H.J.A., et al. 2001, in Gas & Galaxy Evolution, (ASP: San Francisco), eds. J. Hibbard, M. Rupen, & J. van Gorkom.
Chambers, K. C., Miley, G. K., van Breugel, W. J. M. 1990, ApJ, 363, 21
Eales, S.A. 1992, ApJ, 397, 49
Fabian, A.C., Crawford, C.S., Ettori, S., & Sanders, J.S. 2001, MNRAS, 322, L11
Garmire, G.P. 1997, BAAS, 190, 3404
Harris, D.E. & Grindlay, J.E. 1979, MNRAS, 188, 25
Harris, D.E., Carilli, C.L., & Perley, R.A. 1994, Nature, 367, 713
Harris, D.E., Nulsen, P.E., Ponman, T.J. et al. 2000, ApJ, 530, L81
Icke, V. 1999, The Most Distant Radio Galaxies, (Royal Netherlands Acadamy: Amsterdam), eds. H. Roettgering, P. Best, & M. Lehnert, 217
Kaiser, C.R. & Alexander, P. 1999, MNRAS, 305, 707
Kurk, J.D., Roettgering, H.J.A., Pentericci, L., Miley, G.K., & Pentericci, L. 2001, Rev Mex. A& A, in press
McCarthy, P.J. 1993, A.R.A.A., 31, 639
Monet, D., Bird, A., Canzian, B., et al. 1996, USNO-SA1.0, (U.S. Naval Observatory, Washington DC)
Miley, G.K. 1980, A.R.A.A., 18, 165
Pentericci, L., Röttgering, H.J.A., Miley, G.K., Carilli, C.L., & McCarthy, P. 1997, A&A, 326, 580
Pentericci, L., Röttgering, H.J.A., Miley, G.K., et al. 1998, ApJ, 504, 139
Pentericci, L., Kurk, J.D., Röttgering, H.J.A. et al. 2000, A& A, 361, L25
Rees, M.J. 1989, MNRAS, 239, 1P
Reynolds, C.S. & Fabian, A.C 1996, M.N.R.A.S., 278, 479
Roettgering, H.J.A., Best, P., & Lehnert, M. 1999, The Most Distant Radio Galaxies, (Royal Netherlands Acadamy: Amsterdam)
Stanford, S.A., Holden, B., Rosati, P., Tozzi, P., Borgani, S., Eisenhardt, P.R., & Spinrad, H. 2001, ApJ, 552, 504
Stark, A.A., Gammie, C.F., Wilson, R.W. et al. 1992, Ap.J. (Supp.), 79, 77
Steidel, C., Adelberger, K., Dickinson, M., Giavalisco, M., Pettin, M., & Kellogg, M. 1998, ApJ, 492, 428
Taylor, G.B. & Carilli, C.L. 2002, ARAA, in press for Vol 40
Ueno, Shiro, Koyama, Katsuji, Nishida, Minoru, Shigeo, Yamauchi, & Ward, Martin J. 1994, Ap.J. (letters), 431, L1
Ward, M.J. 1996, in Cygnus A, eds. C. Carilli & D. Harris, (Cambridge Univ. Press: Cambridge), p.43
Weisskopf, M.C., O’Dell, S.L., & Van Speybroeck, L.P. 1996, Proc. SPIE, 2805, 2
West, M.J. 1999, in The Most Distant Radio Galaxies, (Royal Netherlands Acadamy: Amsterdam), eds. H. Roettgering, P. Best, and M. Lehnert p. 365
Figure Captions
Figure 1 – The contours show the total (0.3 to 10 keV) X-ray emission from the radio galaxy PKS 1138–262 as observed with the ACIS-S detector on the Chandra Observatory. The Chandra image has been convolved with a Gaussian of FWHM = 2′′. In this and subsequent images the contours are a geometric progression in square root two. The first contour level is 2.3 counts per Gaussian beam. The greyscale shows the radio continuum image at 1.4 GHz, 2′′ resolution made with the Very Large Array (Carilli et al. 1997). The greyscale range is 0 to 150 mJy beam-1.
Figure 2 – A comparison of the X-ray emission
and emission at other wavelengths in PKS 1138–262. The contours in
all cases are of total X-ray emission
convolved with a Gaussian of FWHM = 1′′.
The first contour level is 0.9 counts per Gaussian beam
(note: the highest four contour levels in these images are
by a factor two, not root two). The crosses mark
the position of the radio galaxy nucleus, and of an X-ray point source
located 5′′ northwest of the nucleus.
a. The greyscale shows the 5 GHz radio continuum emission at 0.5′′
resolution. The greyscale range is 0 to 2 mJy beam-1.
(from Carilli et al. 1997).
b. The greyscale shows the HST F606W image (from Pentericci et
al. 1998). Note that 606nm corresponds to 192nm at .
c. The greyscale shows the VLT image of the Ly emission (from
Kurk et al. 2001).
Figure 3 – Three-band images of X-ray emission
from PKS 1138–262 convolved with a Gaussian of FWHM = 2′′.
The crosses are the same as in Figure 2.
a. The soft X-ray (0.3 to 1.2 keV) emission. The greyscale shows
the radio continuum emission at 5 GHz. The first contour level is 1.1
counts per Gaussian beam.
b. The mid X-ray (1.2 to 2.4 keV) emission. The first contour level is
0.9 counts per Gaussian beam.
c. The hard X-ray (2.4 keV) emission. The first contour level is
1.8 counts per Gaussian beam.
Figure 4 – The surface brightness profiles averaged azimuthally in rings centered on the nucleus of 1138–262. The solid circles are for the two quadrants along the radio axis, while the open squares are for the two quadrants perpendicular to the radio axis. Both profiles have been normalized at the first point, corresponding to a radius of 3.5′′, and the points at smaller radii are omitted due to confusion by AGN emission. The solid line is a model fit to the data along the radio axis, with and . The dotted line is the background level.
Figure 5 – The X-ray spectrum of the AGN emission from PKS
1138–262. The model
is a power-law spectrum with and N(HI) = cm-2 at .