A photometric and spectroscopic study of dwarf and giant galaxies in the Coma cluster - V. Dependence of the spectroscopic properties on location in the cluster 111Based on observations made with the William Herschel Telescope operated on the island of La Palma by the Isaac Newton Group in the Spanish Observatorio del Roque de los Muchachos of the Instituto de Astrofisica de Canarias.
Abstract
We investigate the radial dependence of the spectroscopic properties, in particular the Mg2, Fe and H spectroscopic indices, in a sample of galaxies spanning a wide range of absolute luminosity in the Coma cluster. After allowing for the magnitude dependence of these indices, we find a significant gradient in Mg2, in the sense that galaxies in the core of the cluster have stronger Mg2. We find only weak gradients in Fe and H. Using the model grids presented in an earlier paper in this series, we attribute the Mg2 gradient to changes in metal abundance. One possible mechanism to create this abundance gradient is pressure confinement by the intracluster medium of material from Supernova driven winds early in the history of the galaxies.
1 Introduction
This is the fifth paper in a series which examines the properties of galaxies in the Coma cluster in the magnitude range 12 R 20 and in a wide variety of environments. In this paper we examine the spatial dependence of line indices which depend upon metal abundance and age, and of the luminosity weighted mean stellar abundances and ages which we derived from these indices in Paper III of this series (Poggianti et al. 2001). In this paper we examine the spatial dependence of the line indices diagnostic of metal abundance and age and investigate the origin and implication of such gradients.
The properties of galaxies in clusters have long been known to depend strongly upon the environment. This was shown most clearly by the survey of Dressler (1980a,b) who showed a dependence of galaxy morphology upon environment in the sense that the proportion of E and S0 galaxies increases with increasing density. This has been taken as evidence for a merger process occurring in clusters which transforms disk galaxies to spheroids at an early epoch. Further work on clusters at higher redshifts (Dressler et al. 1997) shows that this dependence is qualitatively similar in highly concentrated clusters at earlier epochs.
The importance of the intracluster medium has become clear more recently. the hot gas mass in clusters is typically 5 times the luminous mass in galaxies, and that gas typically has a metal abundance (specifically iron abundance) of 0.2 - 0.5 solar (Finoguenov et al. 2000; De Grandi & Molendi 2000). The majority of the heavy elements in a cluster are in the hot gas, but all of these heavy elements must have come from galaxies at some stage. Finoguenov & Ponman (1999) and Finoguenov et al (2000) study the distribution of both iron and elements in the hot gas component in clusters, and find that there are radial gradients in the abundances, stronger in iron than in elements. They conclude that Type II supernovae dominate the enrichment process in the outer regions of clusters, but in their centers Type I supernovae are more important. However in the Coma cluster, which is the subject of this study, Arnaud et al. (2001) find that the abundance profile is flat at 0.25 solar out to 15 arcminutes radius, except for a region of enhanced abundance less than 30 arcsec in radius centerd on NGC 4874. These authors present only a single abundance profile, presumably derived assuming solar abundance ratios.
As the galaxies are the source of the heavy elements, it is important to study and understand their properties. Line indices and luminosity weighted ages and abundances for samples of Coma cluster galaxies have been published by Jorgensen (1999) and Terlevich et al. (2000), but our sample has a much greater range in luminosity, and covers a wide range of radius and of environment.
2 Observations
Our data are taken from photometric and spectroscopic observations of two 40 x 30 arcminute fields in the Coma cluster, with the Tokyo Mosaic CCD camera and the WYFFOS fibre fed spectrograph respectively. Details of the observing setup and data reduction are given in earlier papers in this series. Photometric observations and reduction are described in paper I (Komiyama et al. 2001). Paper II (Mobasher et al. 2001) describes the spectroscopic sample selection. In paper III (Poggianti et al. 2001) we derive line indices on the Lick system and luminosity weighted ages and metallicities from these indices. In the current paper we analyse the following quantities: galaxy position, R magnitude, (B-R) color and concentration index from Paper I; and the spectroscopic indices Mg2, Fe and H from paper III, together with luminosity weighted ages and metallicities derived from the the model grids presented in the Mg2 - H diagram in Figure 4 of that paper.
Our galaxy sample selection is described in paper II. The spectroscopic sample comprises two subsamples, a bright sample of galaxies at R18 with known redshifts from Colless & Dunn (1996) and Colless (1998) and a faint sample selected from our own photometric imaging survey (Paper I) to have 18R20 and 1B–R2. As described in Paper II, the samples are both believed to be free of morphological bias. Our faint spectroscopic sample is not complete, but the galaxies observed are drawn at random from the photometrically defined sample.
The sample discussed here comprises 229 galaxies from our spectroscopic survey for which the formal errors on the Mg2, Fe and H indices are less than 0.04 magnitude, 1.5 Å and 1.5 Å respectively, and which did not show emission lines on visual inspection. Of these, 163 are in the central Coma 1 field and 66 in the Coma 3 field which is located to the southwest of the cluster center. described in Paper II. If more than one such spectrum was available then the line index values were combined with weighting proportional to the inverse of the variance on each line index. Because we require small errors in the indices for inclusion in the sample we discriminate against faint galaxies and in particular low surface brightness galaxies, for low surface brightness the signal-to-noise ratio of our spectra is often too poor for inclusion. Rejecting emission lines (which otherwise will dilute the Balmer indices in particular) discriminates against galaxies with ongoing star formation.
In this paper we examine the dependence of galaxy properties on the distance of the galaxy from the the cluster center, which has been taken to be at RA = 12h 59m 42.8s, Dec = 27∘ 58’ 14”, Equinox J2000.0, a position near the peak of the X-ray emission (White et al. 1993) and some 1.8 arcminutes East of NGC 4874. However we do not completely sample the azimuthal distribution at radii greater than 15 arcminutes. Our outer field is to the South West of the center, and includes NGC 4839 and the group of galaxies around it, which are believed to be falling into the Coma cluster (e.g. Neumann et al. 2001). The effect of the inclusion of this group in our sample is considered later in the paper.
3 Radial dependence of line indices

The Mg2 index (Figure 1) shows a clear trend with radius, galaxies in the outer part of the cluster have lower Mg2 indices than those in the core. There is a substantial scatter at all radii which is due to the strong trend of this index with galaxy magnitude (paper III); the fainter galaxies have weaker Mg2, and larger errors, because of the lower signal-to-noise of the spectra. The lines show weighted (dashed line) and unweighted (dot-dash line) least squares fits to the data, there is a large offset between the lines because the brighter galaxies which have stronger Mg2 have better signal-to-noise and hence lower errors and higher weights in the weighted fit. However both fits show the trend which is visible in the data; towards lower Mg2 at larger radii within the cluster.
In Table 1 we present the statistical properties of the fits, to show the significance of the correlations. The important statistics in this context are “Student’s” t, and P, the probability of obtaining a value of this high by chance in an uncorrelated sample.

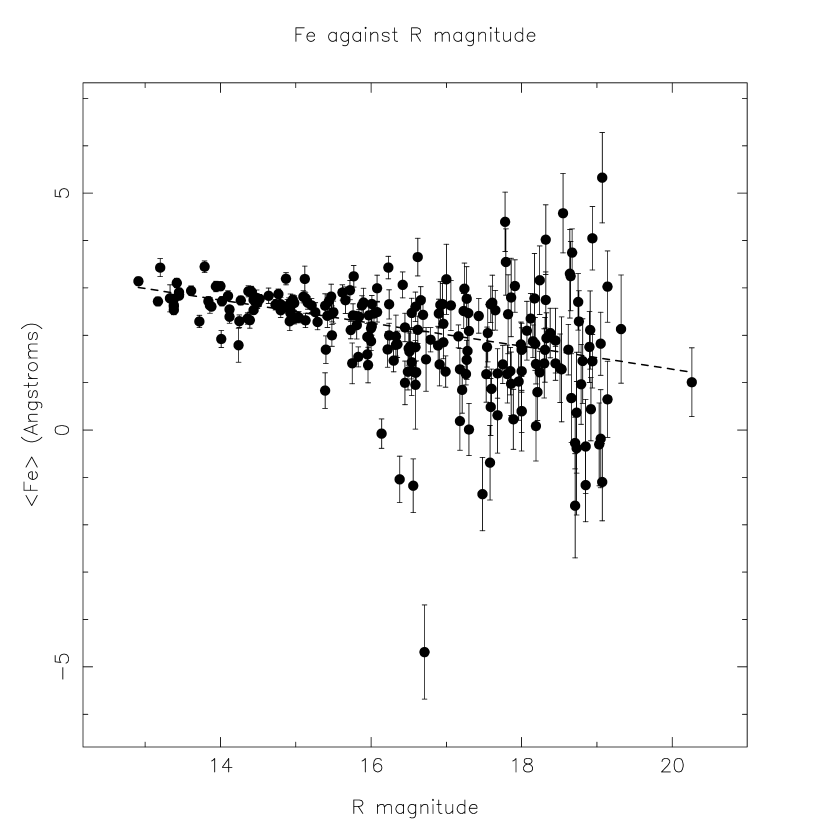
The equivalent plots for the Fe and H indices are shown in Figures 2 and 3 respectively, the Fe index shows a weaker gradient than Mg2, perhaps masked by higher errors, whereas H shows a marginal positive gradient.
| Fig | Ordinate | Abscissa | N | R | Slope | Intercept | t | P(%) | ||
|---|---|---|---|---|---|---|---|---|---|---|
| 1 | Mg2 | Radius | 229 | -0.22 | -6.51x10⁻⁴ | 1.91x10⁻⁴ | 0.229 | 6.03x10⁻³ | -3.41 | 0.08 |
| 2 | Fe | Radius | 229 | -0.08 | -2.14x10⁻³ | 1.69x10⁻³ | 2.627 | 0.054 | -1.26 | 20.7 |
| 3 | H | Radius | 229 | 0.19 | 6.05x10⁻³ | 2.03x10⁻³ | 1.649 | 0.064 | 2.99 | 0.31 |
| 4a | Mg2 | R mag | 229 | -0.74 | -3.58x10⁻² | 2.15x10⁻³ | 0.7385 | 3.16x10⁻² | -16.7 | |
| 4b | (Mg2) | Radius | 229 | -0.25 | -5.01x10⁻⁴ | 1.27x10⁻⁴ | 1.21x10⁻² | 4.00x10⁻³ | -3.95 | 0.01 |
| 5 | (B-R) | Radius | 229 | -0.45 | -4.22x10⁻³ | 5.63x10⁻⁴ | 0.1052 | 1.82x10⁻² | -7.51 | |
| 6a | Fe | R mag | 229 | -0.56 | -0.243 | 0.024 | 6.149 | 0.348 | -10.3 | |
| 6b | (Fe) | Radius | 229 | -0.07 | -1.37x10⁻³ | 1.40x10⁻³ | 3.34x10⁻² | 4.45x10⁻² | -0.98 | 33 |
| 7a | H | R mag | 229 | 0.31 | 0.159 | 0.032 | -0.541 | 0.475 | 4.94 | |
| 7b | (H) | Radius | 229 | 0.19 | 5.45x10⁻³ | 1.93x10⁻³ | -0.133 | 0.061 | 2.82 | 0.5 |
| 8 | Metallicity | Radius | 208 | -0.16 | -4.34x10⁻³ | 1.89x10⁻³ | -0.5028 | 0.0603 | -2.30 | 2.2 |
| 9a | Metallicity | R mag | 208 | -0.58 | -0.1967 | 0.0193 | 2.619 | 0.319 | -10.2 | |
| 9b | (Metallicity) | Radius | 208 | -0.11 | -2.46x10⁻³ | 1.55x10⁻³ | 6.06x10⁻² | 4.95x10⁻² | -1.59 | 11.4 |
| 11 | (Metallicity) | Radius | 143 | -0.22 | -4.20x10⁻³ | 1.58x10⁻³ | 9.39x10⁻² | 4.55x10⁻² | -2.66 | 8.8 |

Although Figure 3 shows marginal evidence for a positive gradient in H the statistical parameters in Table 1 show that this is not significant. In this Figure we do not see evidence for a concentration of Balmer line strong galaxies in the NGC 4839 region of the Coma cluster, as was proposed by Caldwell et al. (1993), although our survey area does cover this region. NGC 4839 is 41.7 arcminutes from our defined cluster center, and we see no concentration of H strong galaxies at this radius. Caldwell et al. measured H rather than H, which is less affected by emission. Emission line galaxies have been eliminated from our sample following visual inspection, although some low level of emission may remain (possibly giving rise to the negative outliers in Figure 3). Again, these galaxies appear to be distributed evenly throughout the cluster.
3.1 Correcting for the luminosity dependence of the indices


In Paper 3 we show a tight correlation between the metallicity derived from the Mg2 index and galaxy luminosity for our sample. Here we investigate whether this dependence alone is sufficient to explain the radial gradient that we see in Figure 1. In Figure 4a we plot Mg2 against R magnitude for the sample used here. This shows the well defined correlation between Mg2 and magnitude, which is discussed in Paper 3. To take this relationship out of the radial dependence, in Figure 4b we plot the residuals in the Mg2 index from a weighted least squares straight line fit against radius.
The correlation with radius is clearly still present in the residuals, and the scatter has been reduced, which shows that the correlation in Figure 1 is not entirely due to index-magnitude relation.
A similar effect is seen if we plot the residuals from the Color-Magnitude relation (paper I) against radius (Figure 5).

In Figures 6 - 7 we repeat this procedure for our measurements of the Fe and H indices, to see whether we can identify residual radial trends in these indices which may have been masked by the scatter introduced by the index-magnitude relations. Fe shows a strong dependence upon magnitude (Paper III and Figure 6a), and when this relation is taken out we see no dependence of the residual upon radius (Figure 6b).

This result is surprising given the strong gradient seen in Mg2, and if confirmed suggests a different radial dependence of the enrichment mechanisms for these two elements. However we have to consider the possibility that it is simply the larger scatter in Fe which masks a radial trend. Formally the slope in Figure 4b is -0.00050 0.00013 mag arcmin-1 and that in Figure 6b is -0.00137 0.00140 Å arcmin-1. If the slopes of the residual/radius relations were to be in the same ratio of the slopes of the index/magnitude relations for Mg2 and Fe (Figures 4a and 6a) then we would expect a slope in Figure 6b of -0.0034 Å arcmin-1, which is 1.4 away from the observed value.


There is a very small positive radial gradient in the H residual, amounting to only 0.4 Å over the entire radial range.
3.2 Metallicity or age as a driver of the radial dependence of the indices
In paper 3 we interpreted our measurements of Lick indices in terms of luminosity weighted stellar age and metallicity with the help of Single Stellar Population models described in that paper. The models show that the Mg2 index in particular is sensitive not only to the metallicity of the population, but that at high metallicity it is also sensitive to the age of the population. This problem is sometimes referred to as the “age-metallicity degeneracy”. However, if galaxies really did consist of a single age and metallicity population, then a pair of indices such as Mg2 and H would yield an unambiguous estimate of the age and metallicity of the population, subject to observational error and the correctness of a particular set of models such as those we use in Paper 3.
The problems with interpretation of the Lick indices are largely due to the uncertainties in the models. First, the models are only Single Stellar Population models, and a galaxy such as our own does not consist of stars with a single age and abundance. Second, our understanding of stellar evolution is as yet incomplete. The limitations of current models are most apparent from our lack of understanding of Galactic globular clusters. We still don’t know if age is the dominant second parameter affecting horizontal branch morphology (e.g. Chaboyer et al. 1996; Stetson et al 1999; Rich et al. 1997), and some authors claim that the age differences between clusters of similar metallicity are too small to explain their difference in HB morphology. A related problem is the embarrassing discrepancy between the spectroscopic and CMD ages for 47 Tuc (Gibson et al. 1999), though population synthesis models with improved physics reduce the discrepancy (Vazdekis et al. 2001) or possibly eliminate it completely (Schiavon et al. 2001). Certainly, if we cannot model the relatively simple globular clusters, which are coeval and chemically homogeneous, we will have little hope of understanding more complicated stellar systems such as galaxies.
Accepting these caveats, we use the models described in Paper III to investigate whether the radial gradients in the indices we observed are due to metallicity or age gradients, or a combination of the two.

In Figure 8 we plot the metallicity from the grids in the H/Mg2 diagram in Paper 3 against radius, there is a gradient of around 0.4 dex from the center of the cluster to 80 arcminutes radius.


In Figures 9a and 9b we again take out the dependence of metallicity upon luminosity, Figure 9a is the correlation between metallicity and R magnitude, and in Figure 9b we plot the residuals from the fit to this relation against radius. When the strong luminosity dependence is taken out we find a gradient log[Fe/H] -0.2 between the center of the cluster and 80 arcminutes radius. The significance of this gradient is not as well established as those in the raw indices, Table 1 shows an 11% probability of a gradient of this size arising by chance, i.e. it is established at the 89% confidence level. Further observations of a larger sample of galaxies are required to firm up this result.
A feature of Figure 9a is the lack of galaxies in the lower left quadrant of this plot, i.e. there are very few bright metal-poor galaxies, although there are rather more faint metal-rich ones, although our spectroscopic sample at R 16 is complete. This distribution, together with the very strong correlation observed in this diagram, suggests that processes which form smaller galaxies from larger ones (tidal stripping, fragmentation and harassment) were more important in the evolution of the cluster than processes which form bright galaxies out of faint ones (e.g. near equal-mass mergers), at least at times since the bulk of the stars were formed.
In Figure 10 we plot histograms of the derived luminosity weighted stellar age from the models in Paper III, divided into samples at projected radius greater than and less than 40 arcminutes. Our ages are derived from the right hand panel of Figure 5 of that paper. as pointed out there, many galaxies lie below the grid lines, i.e. at lower H strength than any models predict, these galaxies are allocated an age of 30 Gyr. The cause of this discrepancy is discussed in Paper III. Figure 10 shows that a higher proportion of the galaxies in the inner sample than in the outer lie below the grid. The ages attributed to these particular galaxies are not satisfactory for addressing the problem addressed in this paper, and because the significance of the difference in the age distributions outside and inside 40 arcminutes depends critically upon our treatment of these galaxies, we can only test such differences using non-parametric rank tests. Using the two-sample form of the Kolmogorov-Smirnov test, we test the samples against the null hypothesis that they are drawn from the same distribution. Taking at face value the rank of the ages of the galaxies in Figure 10, and using the two-sample form of the test, we find that the distributions differ at the 93% confidence level. However ignoring those galaxies placed at an age of 30 Gyr, we find that the age distributions for those galaxies with well established ages differ only at the 30% confidence level, i.e. those distributions are entirely consistent with each other.

Maraston & Thomas (2000) present composite population models using isochrones which reproduce the strong Balmer lines seen in old, metal-poor galactic globular clusters. Their models of early type galaxies consist of two old populations, one metal poor and one metal rich. They propose that these models can give rise to the observed scatter in cluster galaxy H strengths as a combination of different proportions of old metal poor and old metal rich populations without the need for a young population. If there were a metal poor population in the galaxies in our sample which became more important further out in the cluster, then this could mask an age gradient, but this age gradient would be in the sense that galaxies at the center of the cluster were younger. There is no firm evidence for such an effect, and although the work of Maraston & Thomas (2000) suggests that there may be galaxies in our sample for which we are deriving unrealistically young ages, these galaxies seem to be spread evenly throughout the cluster.
3.3 Dependence of the abundance gradient on the morphology and age
It is well known that there is a dependence of galaxy morphology upon environment within clusters (Dressler 1980a,b), so in this section we consider whether the metallicity gradient which we see is the same effect. At first sight this seems unlikely, as the processes which give rise to transformations between morphological types (ram pressure stripping, galaxy harassment) are unlikely to affect the galaxy metallicity, and any effects on the metallicity-magnitude relation will result from effects on the luminosity, and is second order to effects upon the luminosity function. Moreover the processes which determine the galaxy metallicity are either internal and depend primarily upon the galaxy mass (resulting in the metallicity-magnitude relation), or they are environmental and involve transfer of gas between the galaxies and the intracluster medium, and are unlikely to depend upon morphology.
Our sample consists largely of galaxies fainter than V=17, for which we have no objective or subjective morphological classification. Inevitably there will be some spiral and irregular galaxies in the sample. Terlevich et al. (2001) plot the (U-V) color-magnitude relation for galaxies of various morphological types in the Coma cluster (their Figure 6). The color - magnitude (CM) relation is driven mostly by the metallicity-mass relation (Faber 1973); Terlevich et al. find that most spiral, irregular and unclassified galaxies in their sample lie on the same CM relation as the E and S0 galaxies, although there are a few outliers on the blue side of the ridge line. However these outliers are very blue, around 1 magnitude bluer in (U-V) than the ridge line, which is likely to be due to ongoing star formation. Such galaxies would have emission lines, and would have been rejected from our sample.

Figure 11 shows the residuals in metallicity from the metallicity magnitude relation, plotted only for those galaxies with a well established mean stellar age greater than 6Gyr. There are only 143 galaxies in this plot, due to the uncertainties in the ages. However the correlation with radius is still clear, indeed it is stronger and more significant than in the complete sample (Figure 9b); Table 1, so the gradient is stronger in older galaxies, or at least galaxies with older stars.
4 Discussion
There is clear evidence for a metallicity gradient for the galaxies in the Coma cluster, this presents itself as a difference of -0.03 magnitude in the Mg2 index (Fig 4b) or -0.2 in log[Fe/H] (Fig 9b) between the value at the center of the cluster and that at 80 arcminutes radius.
There are good reasons to expect that there might be a gradient in the metallicity of galaxies within clusters. Although galaxies will have undergone several orbits or crossings within the cluster they will not be well mixed, so galaxies which form in the outer regions of a cluster will spend most of their time there. The metallicity-magnitude relation can be understood in terms of the loss of processed material in supernova driven outflows (Larson 1974, Vader 1984). This loss of the heavy elements is counteracted by the gravity of the galaxy, hence the metallicity-mass and metallicity-magnitude relation. But it can also be counteracted by external pressure of the intra-cluster medium (Silk et al. 1987). Galaxies formed in the densest parts of the cluster would be expected to retain more of their heavy elements. We only detect a significant gradient in Mg2, not Fe, so it is possible that the mechanism which constrained the processed material was more effective at a time when Supernovae Type II were the dominant source of processed material, early in the history of the cluster. This is also supported by the evidence of Figure 11, that the gradient is stronger in galaxies with an older stellar component.
This picture is complicated by the possible modification of the cluster membership by accretion of subclusters. There is some evidence from the X-ray morphology (Neumann et al. 2001) that the NGC 4839 group is being accreted by the cluster. Any such accretion would be expected to dilute any gradient existing in the cluster.
Guzmán et al. (1992), investigating the -Mg2 relation amongst the bright ellipticals in Coma, find an offset between a core sample and a halo sample in the sense that the halo ellipticals have weaker Mg2 for a given . These authors, having only one index, cannot distinguish between metallicity and age as an origin of this offset, they show that age is a possible origin. Rose et al. (1994), using different indices, conclude that there is a difference in stellar populations between galaxies in rich clusters and those in a field environment, in that the luminosity weighted mean stellar population is younger and more metal rich in low density environments. They attribute this difference to an additional intermediate age population in the low density environments. They do not investigate the difference between high- and low-density regions in the same cluster. We note that their dataset is heterogeneous, particularly in the detectors used to gather it, and includes not only CCD spectra but also some from older image tube based detectors. It is not clear whether the difference between their conclusions and ours results from different observational techniques, or different sample selection, or because the comparison between high- and low-density clusters is different from the comparison between regions of different density in the same cluster.
Terlevich et al. (2001) find a gradient in the (U-V) color residual from the CM diagram with radius, in the sense that galaxies in the outer part of the Coma cluster are bluer than those in the center. At 30 arcminutes radius, the galaxies are 0.03 magnitudes bluer in (U-V) than in the cluster center. Terlevich et al. (2001) attribute this gradient to a gradient in the mean stellar age of the galaxies, however (U-V) is also sensitive to metallicity (Wallerstein 1962; Faber 1973). The relationship between (U-V) and metallicity in single stellar population models is complicated (e.g. Vazdekis et al. 1996), and depends upon other parameters, and indeed differs by worrying amounts between models. Inspection of Figure 3 of Vazdekis et al. (1996) shows however that a gradient of -0.1 in log[Fe/H] between 0 and 30 arcminutes radius would be sufficient to produce the gradient in (U-V) seen by Terlevich et al. without the need for an age gradient.
Balogh et. al (2000) propose a model in which star forming galaxies fall into rich clusters at a fairly uniform rate over time, and their star formation is gradually quenched by ram pressure and tidal stripping removing their gas over a period of a few Gyr. Their model explains the observed gradients in star formation rate, as measured by spectroscopic indices in the CNOC cluster sample (Balogh et al. 1999). This mechanism would be expected to lead to an age gradient in our sample, indeed given the small sample and the uncertainties in the ages of a substantial number of galaxies in Figure 10 we cannot rule this out. However as galaxies further out in the cluster would have had their star formation truncated on average later than galaxies in the core, any effect on the metallicity gradient would be in the opposite sense to that which we see. We conclude that the metallicity gradient is not due to infall of galaxies.
5 Conclusions
We detect significant evidence for a negative radial gradient in the metallicity of the galaxies in the Coma cluster, as measured from pairs of indices including Mg2. Our Fe index measurements are less accurate, however the gradient that we find in this index is significantly shallower that we would deduce from the size of the Mg2 gradient. Evidence for a gradient in luminosity weighted stellar age is unclear, and we suggest that the gradient in (U-V) observed by Terlevich et al. (2001) and attributed by them to an age gradient could instead be driven by the metallicity gradient that we observe.
Our observations are most easily explained by models in which the pressure of the intracluster medium confines enriched material in supernova driven winds early in the history of the cluster. We find no firm evidence for a gradient in the mean stellar ages of galaxies with radius. Thus our observations support models in which the epoch of formation of the bulk of the stars in galaxies does not depend upon their location within the cluster.
References
- (1) Arnaud, M., Aghanim, N., Gastaud, R., Neumann, D.M., Lumb, D., Briel, U.G., Altieri, B., Ghizzardi, S., Mittaz, J.P.D., Sasseen, T.P., & Vestrand, W.T., 2001, A&A 365, L67.
- balogh (99) Balogh, M.L., Morris, S.L., Yee, H.K.C., Carlberg, R.G., & Ellingson, E., 1999, ApJ, 527, 54.
- (3) Balogh, M.L., Navarro, J.F., & Morris, S.L., 2000, ApJ, 540, 113.
- (4) Caldwell, N., Rose, J.A., Sharples, R.M., Ellis, R.S., & Bower, R.G., 1993, AJ, 106, 473.
- chaboyer (96) Chaboyer, B., Demarque, P., & Sarajedini, A. 1996, ApJ, 459, 558.
- colless (96) Colless, M.M., & Dunn, A.M., 1996, ApJ, 458, 435.
- colless (98) Colless, M.M., 1998, private communication.
- (8) De Grandi, S., & Molendi, S., 2001, ApJ, 551, 153.
- (9) Dressler, A., 1980a, ApJ, 236, 531.
- (10) Dressler, A., 1980b, ApJ suppl., 42, 565.
- dressler (97) Dressler, A., Oemler, A., Couch, W.J., Smail, I., Ellis, R.S., Barger, A., Butcher, H., Poggianti, B.M., & Sharples, R.M., 1997, ApJ, 490, 577.
- faber (73) Faber, S.M., 1973, ApJ, 179, 731.
- finoguenov (99) Finoguenov, A.& Ponman, T.J., 1999, MNRAS, 305, 325.
- finoguenov (00) Finoguenov, A., David, L.P., & Ponman, T.J., 2000, ApJ, 544, 188.
- gibson (99) Gibson, B.K., Madgwick, D.S., Jones, L.A., Da Costa, G.S., & Norris, J.E. 1999, AJ, 118, 1268.
- guzman (92) Guzmán, R., Lucey, J.R., Carter, D., & Terlevich, R.J., 1992, MNRAS, 257, 187.
- jorgensen (99) Jorgensen, I., 1999, MNRAS, 306, 607.
- (18) Komiyama, Y. et al., 2001, ApJ, in press (paper I).
- (19) Larson, R.B., 1974, MNRAS, 169, 229.
- (20) Maraston, C., & Thomas, D., 2000, ApJ, 541, 126.
- (21) Mobasher, B., Poggianti, B. M., Bridges, T. J., Carter, D. et al., 2001, ApJ, in press (paper II).
- (22) Neumann, D.M., Arnaud, M., Gastaud, R., Aghanim, N., Lumb, D., Briel, U.G., Vestrand, W.T., Stewart, G.C., Molendi, S., & Mittaz, J.P.D., 2001, A&A 365, L74.
- (23) Poggianti, B. M., Bridges, T. J., Mobasher, B., Carter, D. et al., 2001, ApJ, in press (paper III).
- rich (97) Rich, R.M., Sosin, C., Djorgovski, S. et al. 1997, ApJ, 484, L25.
- rose (94) Rose, J.A., Bower, R.G., Caldwell, N., Ellis, R.S., Sharples, R.M., & Teague, P.F., 1994, AJ, 108, 2054.
- (26) Schiavon, R.P., Faber, S.M., Rose, J.A., & Castilho, B.V. 2001, ApJ, submitted, (astroph/0109365).
- silk (87) Silk, J., Wyse, R.F., & Shields, G.A., 1987, ApJ Lett., 322 L59.
- stetson (99) Stetson, P.B., Bolte, M., Harris, W.E. et al., 1999, AJ, 117, 247.
- terlevich (99) Terlevich, A.I., Kuntschner, H., Bower, R.G., Caldwell, N., & Sharples, R.M., 1999, MNRAS, 310, 445.
- terlevich (01) Terlevich, A.I., Caldwell, N., & Bower, R.G., 2001, MNRAS, submitted (astro-ph/0106337).
- vader (84) Vader, J.P., 1984, ApJ, 305, 669.
- vazdekis (96) Vazdekis, A., Casuso, E., Peletier R.F., & Beckmann, J.E., 1996, ApJ suppl., 106, 307.
- vazdekis (01) Vazdekis, A., Salaris, M., Arimoto, N., & Rose, J.A., 2001, ApJ, 549, 274.
- wallerstein (62) Wallerstein, G., 1962, ApJ Suppl., 6, 407.
- white (93) White, S.D.M., Briel, U.G., & Henry, J.P., 1993, MNRAS, 261, L8.