Detection of Galaxy Spin Alignments in the PSCz Shear Field
Abstract
We report the first direct observational evidence for alignment of galaxy spin axes with the local tidal shear field. We measure quantitatively the strength of this directional correlation of disk galaxies from the Tully catalog with the local shear field reconstructed from PSCz galaxies. We demonstrate that the null hypothesis of random galaxy alignments relative to the shear frame can be ruled out more than confidence. The observed intrinsic correlation averaged over the censored samples that have detected non-zero signals is measured in terms of the alignment parameter , which includes only statistical errors of the censored data, but not the cosmic variance error. The reconstruction procedure is likely to underestimates systematically. Our result is consistent with the linear tidal torque model, and supports the idea that the present galaxy spins may be used as a probe of primordial tidal shear and mass density fields. The intrinsic alignments of galaxy spins dominate over weak gravitational lensing for shallow surveys such like SDSS, while it should be negligible for deeper surveys at .
1 INTRODUCTION
In the standard gravitational instability paradigm, the linear tidal torque theory explains the origin of the angular momentum of a galaxy as arising from its tidal coupling with the surrounding matter at the early proto-galactic stage (Hoyle, 1949; Peebles, 1969; Doroshkevich, 1970; White, 1984), and predicts a correlation of its spin axis with the intermediate principal axis of local shear (Dubinski, 1992; Catelan & Theuns, 1996; Lee & Pen, 2000). In this model, each component of the proto-galaxy angular momentum vector in the shear principal axis frame is represented by a difference of a pair of the three eigenvalues of the shear tensor, and thus the intermediate component proportional to the difference between the largest and the smallest eigenvalues of the shear tensor dominates the direction of the angular momentum. This correlation of proto-galaxy spin axis with the initial tidal shear field is intrinsic and local, and distinct from the weak gravitational lensing effect Crittenden et al. (2001).
An important question is whether the intrinsic alignments of proto-galaxy spins with the tidal shear fields remain till present or not. If so, it will have a considerable impact on weak lensing searches since the intrinsic shear effect on galaxy spins will play a role of systematic errors. Furthermore recently Lee & Pen (2000,2001) have shown that the relatively easily measurable galaxy spin field can be used to reconstruct the initial tidal shear and mass density fields provided that the effect of intrinsic shear on galaxy spins persist. Several numerical tests (Heavens et al., 2000; Porciani et al., 2001, 2001) and observational searches (Pen et al., 2000; Brown et al., 2000) have so far found some evidences for the existence of intrinsic spin alignments, but early attempts were all indirect.
The detection of intrinsic correlations between the tidal shear and galaxy spin fields from the observed universe requires independent measurement of the two fields. Here we attempt to measure the tidal shear and galaxy spin fields from two independent all-sky catalogs and measure the local directional correlations of the two fields directly.
2 FIELD MEASUREMENTS
One would like to measure the intrinsic shear in the initial Lagrangian field, which is, however, practically impossible to derive from present observational data. What one can do at most is to measure the evolved final Eulerian shear and approximate the Lagrangian shear to it. This approximation can be improved by applying a Wiener filter to the observational data.
For the measurement of shear, we have used the PSCz (a complete redshift survey from the IRAS Point Source Catalog) data, which provides a flux-limited all-sky catalog of 15500 galaxies detected by IRAS. It covers of the sky down to a flux limit of Jy at m. The remaining of the sky is a gap region containing the galactic plane and survey gaps excluded in the PSCz Saunders et al. (2000).
The flux-limited catalog is not a homogeneous sample since the fraction
of galaxies observed decreases with distance. For the measurement
of tidal shear, it is statistically simpler to use a volume-limited
sample where the fraction of galaxies is constant with distance.
We converted the flux limited PSCz catalog into volume-limited samples by
dividing the whole volume into the 7 spherical shells of distance
range ,,
and (in unit of Mpc) as in the previous
literature (Yahil et al., 1001; Szapudi et al., 2000)
and including only galaxies luminous enough to be above
the flux limit if placed at the outer edge of each volume. We
ended up with 7 volume-limited samples containing ,
and galaxies respectively.
We first measure the raw density field of a chosen PSCz sample (say, ), assuming that the mass density is proportional to the number density of galaxies: , where is the Dirac-delta function, and is the mean number density of galaxies of the sample . We calculate the raw density field of each sample separately as if there were no mass source outside the sample under consideration.
To minimize the shot noise due to the finite number of mass sources and optimize the approximation of the Lagrangian shear to the Eulerian shear, we convolve this density field with the Wiener filter, based on the standard power law correlation function for the galaxies. We find the Fourier space Wiener filter to be with . Here is the noise power spectrum derived from the Poissonian distribution. Note that each sample has a different Wiener filter distinguished by a different value of .
Since the Wiener filtered gravitational potential in Fourier space is , its real counter-part is written as where is a modified Wiener filter defined in Fourier space as .
Now we find the gravitational potential due to the mass density of the chosen sample at some field point :
| (1) | |||||
where and are the inner and outer radii of . The total gravitational potential at will be the super-positions of all the gravitational potentials calculated from the seven PSCz samples separately. The tidal shear field can be finally determined as the second derivative of the total gravitational potential such that .
There are, however, two sources of bias in the measurement of tidal shear: the existence of a gap region excluded in the PSCz and the redshift distortion effect on the orientation of the shear principal axes along the line of sight. To minimize these errors, first we compensate for the existence of the gap by adding the gap contribution to the total mass density, assuming a uniform mass distribution in the gap. Second, we cancel out the redshift distortion bias in the determination of shear by readjusting the shear principal axes to have a statistically isotropic distribution. Basically we force the angle between the shear principal axes of each shear and the line-of-sight direction to have a uniform distribution in the range of without changing its original ranking order. The most important intermediate axis has been adjusted first, the major axis as next, and finally the minor axis has been automatically determined from the orthogonality condition.
Note that these procedures minimize the systematic bias in the measurement of shear orientation but also lower the inferred strength of intrinsic shear effects since the shear axes may deviate further from the true orientations. Finally we renormalize the resulting shears into the unit traceless shear since our eventual interest is not in the magnitude but the axis orientation of the tidal shear.
Regarding the galaxy spin field, we consider the unit spins of 12122 Tully disk galaxies as used by Pen et al. (2001). Let us briefly review the work of Pen et al.. The unit spin vector of each disk galaxy is initially estimated from the major-minor axis ratio and the position angle, assuming that a disk galaxy is an infinitely thin disk with its spin axis perpendicular to the disk plane. The measured axis ratio and position angle of a disk galaxy determine the inclination and orientation angles of the disk. The inclination angle is only determined up to a sign ambiguity. We take into account this sign ambiguity in the determination of line-of-sight component of a unit spin, and construct two unit spin vectors at each Tully galaxy position. Therefore we end up with twice as many unit spins as Tully galaxies.
Real disk galaxies, however, are not infinitely thin disks. Their intrinsic thickness and deviation in shape from a perfect ellipse create biases in the statistical distribution of inclination angles. Although this statistical bias has a different source from the redshift distortions, its effect on the galaxy spin axis can be removed by the same procedure that we use for the adjustment of shear principal axis. We adjust to have a uniform distribution in range of , as would be the unbiased case.
This statistical bias might depend on both the galaxy distance and Hubble type (intrinsic morphology). We divide the Tully galaxies into the same distance bins, resulting in five non-zero samples. The number of the included galaxies, the distance range of each Tully sample are listed in the 1st and 2nd columns of Table 1. For each Tully sample, we carry out the uniform redistribution of galaxy inclination angles within each Hubble type separately.
Now that we have independently measured tidal shear and galaxy spin fields, we can estimate the strength of intrinsic correlations between the tidal shear and galaxy spin fields.
3 MEASUREMENTS OF INTRINSIC SHEAR EFFECTS
Lee & Pen (2000, 2001) have shown that the intrinsic shear effect on galaxy spins can be quantified by one dimensionless parameter, in range of , and derived its optimal estimation formula: where are the three eigenvalues of shear, and is the unit spin vector measured in the shear principal axis frame. The associated statistical uncertainty, , can be calculated as the standard deviation of assuming the null hypothesis that the orientations of galaxy spins are completely random with no intrinsic alignment: where is the total number of independent unit spin vectors Lee & Pen (2001). Each galaxy is used twice, once for each degenerate orientation. We have verified numerically that using given by twice the number of galaxies correctedly reproduces the standard deviation for an uncorrelated sample.
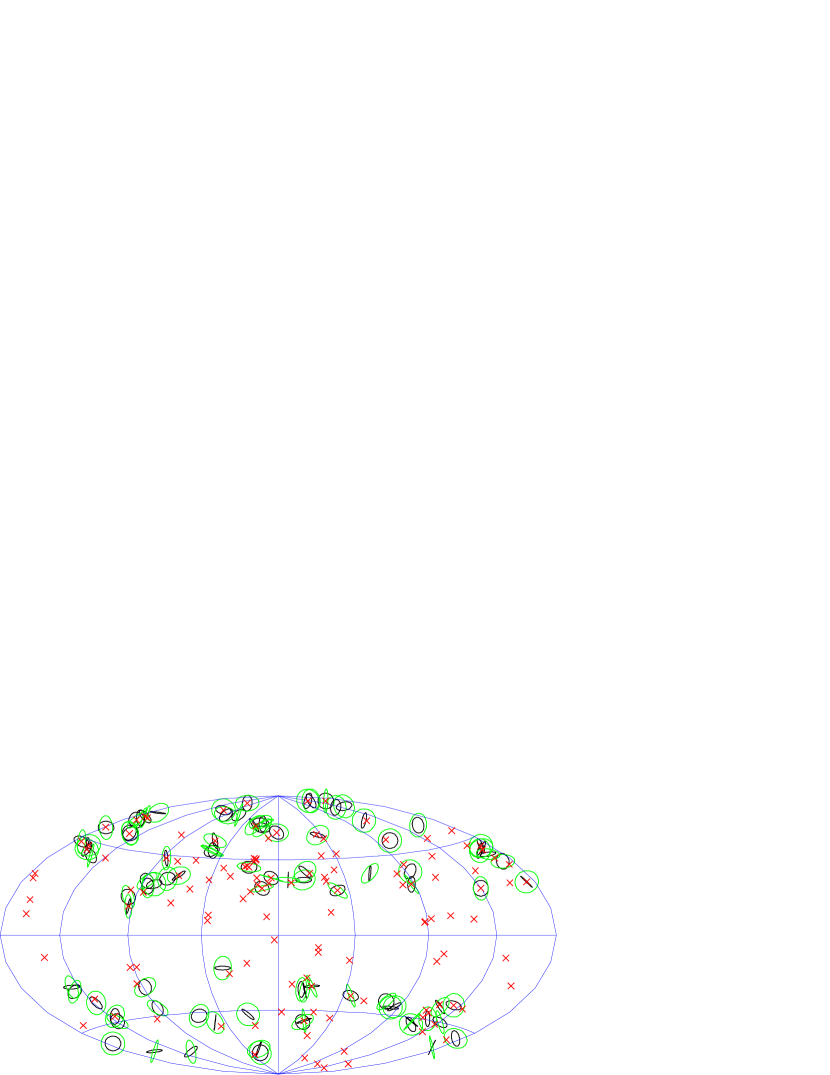
We calculate the values of at the positions of all Tully galaxies using this formula, and averaged them within each sample separately. Table 1 lists the observed signal of each sample in the 3rd column. We have also checked the effect of measurement errors in the axis ratios and position angles of Tully galaxies on the observed signal of intrinsic shear effect. Given the average mean errors of axis ratio and position angle de Vaucouleurs et al. (1991), we have calculated the propagation error due to measurement inaccuracy and found it to be small, less than of the signal for every sample. Fig. 1 illustrates a statistical sample of intrinsic shear effect on the Tully unit spins in the distance range Mpc.
The observed signal does not give the full strength of intrinsic shear effect. In our analysis the shear field has been convolved by the adaptive Wiener-filter to minimize noise, but the full strength of intrinsic shear effect should be measured from the shear field smoothed with a top-hat galactic radius. The observed signal, , can be rescaled to the full signal, , by . Here is the covariance between wiener filtered and top-hat filtered density fields (, respectively). Approximating the density power spectrum on galactic scales as a power law , and using a top-hat radius of Mpc which corresponds to the typical size of a galaxy halo Bardeen et al. (1986), we rescale the observed signals from each sample separately and find the full signal of intrinsic shear effect, which are listed in the 4th column of Table 1. This results from each Tully sample except for the 1st one are consistent with one another, detecting a nonzero signal of a few percent. Therefore, the null hypothesis that the orientations of galaxy spin axes in the local shear frame are completely random with no intrinsic alignment can be safely abandoned.
In the null hypothesis, the distribution of the correlation parameter for each sample is Gaussian with zero mean. The non-zero value of () of the Tully sample would just be statistical fluctuations with standard deviation . Treating each sample as independent, we define five independent variables, as . In the null hypothesis each is a random variable, uniformly distributed in the range . The probability of the null hypothesis, that is, the probability that the Tully sample doe not detect intrinsic alignments of galaxy spins is given as the cumulative probability, with . One can show that this probability is given as . From the results of Table 1, we find and , which rules out the null hypothesis at the confidence level higher than .
Finally we compute the weighted average of the signals by and . Excluding the inconsistent result from the 1st sample, and we find , which is a 25% accurate measurement of the intrinsic shear alignment effect.
4 DISCUSSIONS AND CONCLUSIONS
We have presented an observational evidence for the existence of intrinsic shear effect on present-day galaxy spin orientations. We have used current observational data (the PSCz and the Tully galaxy catalogs) to measure the tidal shear and the galaxy spin fields independently, and measured the strength of intrinsic shear effect directly. We have used five samples in different distant range and measured the signal of each sample separately. All the samples except for the innermost one have produced non-negligible signal of intrinsic shear effects on galaxy spins, and thus we have been able to rule out the null hypothesis that galaxy spins are randomly aligned in the tidal shear field at a confidence level higher than . The mean strength of the signal averaged over the four samples except for the innermost one has been shown to be . The reconstruction procedure is likely to systematically underestimate .
Yet, there are two statistical problems in the measurement of , which we would like to address before concluding. The first concern is about excluding the 1st sample. When combining the samples that have high signal-to-noise ratio, we should give each sample a weight proportional to its volume. In such a weighting, the 1st Tully sample has the smallest weight. Furthermore, structures are coherent on scales of many Mpc, so that the “cosmic variance”is expected to be large in the small sample. Our estimator for assumed that the shear is known without any errors, i.e. we neglected“cosmic variance”. This first sample has a small statistical error, but it is not clear how to include this sample when we in fact know that the shear field is not known to nearly such good accuracy. Cosmic shear has a correlation length comparable to the size of this bin, so the coherent errors in this bin are expected to be large. Hence, given the potentially large contributions of cosmic variance, we exclude it in the calculation of .
Excluding the 1st sample, however, is the simplest way to treat the effects of cosmic variance on . For a more realistic treatment, one should include the cosmic variance error, assuming a particular relation between the sample size and the value of , and use a maximum likelihood analysis for . The second concern is about the assumed statistical model for . Here we have assumed a null hypothesis of equal zero, and have shown that alignments are not random at the level. If cosmic variance is indeed the origin for the small apparent signal in the first bin, the estimate of has an additional uncertainty from cosmic variance. The quantitative estimate of the cosmic scatter, however, is beyond the scope of this letter.
We finally conclude that the null hypothesis of no intrinsic alignment is very safely ruled out, and the resulting signal represents the average strength of intrinsic shear effect from the galaxy samples that have consistent nonzero signals. Our result is consistent with the linear tidal torque model based on the gravitational instability. It also hints that the present galaxy spin field might be used as a probe to measure the initial tidal shear and mass density fields, and eventually map the three dimensional matter distribution of the universe (Lee & Pen, 2001). Applying the results of (Crittenden et al., 2001), we conclude that weak lensing surveys are strongly contaminated by this effect at low redshift, but only negligibly at high redshift.
References
- Bardeen et al. (1986) Bardeen, J. M., Bond, J. R., Kaiser, N., & Szalay, A. S. 1986, ApJ, 304, 15
- Brown et al. (2000) Brown, M. L., Taylor, A. N., Hambly, N. C., & Dye, S. 2000, MNRAS, preprint (astro-ph/0009499)
- Catelan & Theuns (1996) Catelan, P., & Theuns, T. 1996, MNRAS, 282, 436
- Crittenden et al. (2001) Crittenden, R. G., Natarajan, P., Pen, U., & Theuns, T. 2001, ApJ, 559, 552
- de Vaucouleurs et al. (1991) de Vaucouleurs, G., de Vaucouleurs, A., Corwin, H. G., Jr., Buta, R. J., Patuerl, G., & Fouque, P. 1991, Third Referece Catalogue of Bright Galaxies (New York: Springer) (RC3)
- Doroshkevich (1970) Doroshkevich, A. G. 1970, Astrofisika, 6, 581
- Dubinski (1992) Dubinski, J. 1992, ApJ, 401, 441
- Hoyle (1949) Hoyle, F. 1949, in Problems of Cosmical Aerodynamics (Dayton : Central Air Documents Office), p. 195
- Heavens et al. (2000) Heavens, A., Refregier, A., & Heymans, C. 2000, MNRAS, 319, 649
- Lee & Pen (2000) Lee, J., & Pen, U. 2000, ApJ, 532, L5 (LP00)
- Lee & Pen (2001) Lee, J., & Pen, U. 2001, ApJ, 555, 106
- Peebles (1969) Peebles, P. J. E., 1969, ApJ, 155, 393
- Pen et al. (2000) Pen, U., Lee, J., & Seljak, U. 2000, ApJ, 543, L107 (PLS00)
- Porciani et al. (2001) Porciani, C., Dekel, A., & Hoffman, Y. 2001a, preprint (astro-ph/0105123)
- Porciani et al. (2001) Porciani, C., Dekel, A., & Hoffman, Y. 2001b, preprint (astro-ph/0105165)
- Saunders et al. (2000) Saunders, W. et al. 2000, MNRAS, 281, 436
- Strauss & Willick (1995) Strauss, M. A., & Willick, J. A. 1995, Phys. Rept. 261, 271
- Szapudi et al. (2000) Szapudi, I. et al. 2000, MNRAS, 318, L45
- White (1984) White, S. D. M. 1984, ApJ, 286, 38
- Yahil et al. (1001) Yahil, A. 1991, ApJ, 372, 380
| # of galaxies | |||
|---|---|---|---|
| (Mpc) | |||
| 5727 | 0-50 | ||
| 3336 | 50-75 | ||
| 1940 | 75-100 | ||
| 898 | 100-125 | ||
| 221 | 125-150 |
Note: has been found to be . The signal of the first sample was not used in the calculation of , since its statistical weight should be dominated by cosmic variance.