Near-infrared micro-variability of radio-loud quasars.
Abstract
We observed three AGN from the Parkes Half-Jansky Flat-spectrum Sample at near-infrared (NIR) wavelengths to search for micro-variability. In one source, the blue quasar PKS 2243123, good evidence for NIR micro-variability was found. In the other two sources, PKS 2240260 and PKS 2233148, both BL Lacertae objects, no such evidence of variability was detected. We discuss the implications of these observations for the various mechanisms that have been proposed for micro-variability.
1 Astrophysics group, School of Physics, University of Melbourne,
Victoria 3010, Australia
mwhiting,aoshlack,rwebster@physics.unimelb.edu.au
Keywords: quasars: individual (PKS 2243123) — BL Lacertae objects: individual (PKS 2240260, PKS 2233148)
1 INTRODUCTION
One of the distinctive features of blazar AGN is rapid flux variability, which is seen in every region of the electro-magnetic spectrum (Wagner & Witzel 1995). This variability can be on time-scales as short as hours to minutes – in this case, it is termed “micro-variability”. In the optical, these variations can be of the order of mag per night (see the review by Miller & Noble 1996). While some radio-quiet quasars have been shown to exhibit micro-variability (Jang & Miller 1997), it is seen most commonly in radio-loud (mostly blazar-type) AGN. The duty cycle111The fraction of time that an object in a given class is variable. This figure is determined observationally by taking the ratio of the time for which objects of a given class are variable to the total observing time for objects in that class. for radio-loud AGN is (Romero et al. 1999) and the figure may be even higher () for radio-selected BL Lacs (Heidt & Wagner 1996).
For radio-quiet AGN, the situation is less clear. Romero et al. (1999) found a low duty cycle of . Gopal-Krishna et al. (2000), in their extensive study of micro-variability of radio-quiet QSOs, found that about 31% of the objects showed evidence for variability. They suggest that radio-quiet QSOs are less likely to exhibit micro-variability in a given time-span than radio-loud AGN, and that the character of the variations in the two classes tend to be different. However, de Diego et al. (1998), in a comparative study of radio-loud and radio-quiet quasars found that micro-variations may be as common in radio-quiet quasars as radio-loud quasars. While the micro-variations in radio-loud objects are thought to be due to shocks within the jet, the existence of similar variability in radio-quiet objects indicates that the accretion disk may also be important in producing the variations.
We are conducting an on-going study of the optical and near-infrared emission from objects from the Parkes Half-Jansky Flat-spectrum Sample (PHFS, Drinkwater et al. 1997), with the data and modelling already presented in Francis, Whiting & Webster (2000, hereafter FWW) and Whiting, Webster & Francis (2001, hereafter WWF) respectively. Based on the above estimates for micro-variability duty-cycles, it is reasonable to expect to see micro-variability in quasars and BL Lacs from the PHFS. This paper contains an investigation into the existence of micro-variability in three such sources. We choose three objects from the PHFS to search for micro-variability at near-infrared wavelengths – a wavelength region that has rarely been used for such a study. With the above figures, if three objects are observed there is a probability of of seeing micro-variability in at least one source. We also choose objects with different optical/NIR spectra, so that we have both jet-dominated and accretion disk-dominated sources. This will enable a comparison of the two ideas for the production of micro-variability.
2 OBSERVATIONS
On the night of the 3rd of August, 1999, three AGN from the PHFS were observed multiple times in three NIR filters over the course of hours, in an attempt to detect short time-scale micro-variability. The observations were made in the near-infrared with the CASPIR InSb array camera (McGregor et al. 1994) on the Australian National University’s 2.3m telescope, at Siding Spring Observatory, NSW. The images were taken using the fast camera with 0.5′′/pixel, and thus the entire detector spans a little over 2 arcmin.

The three objects chosen were the following:
-
•
PKS 2243123: A quasar, , that was described as optically variable by Shen et al. (1998), although they did not give a reference for this classification (it possibly comes from the description as variable in Hewitt & Burbidge (1993)). It has a blue optical/NIR spectral energy distribution (SED) from FWW, with . WWF modelled the SEDs of many PHFS sources by fitting a combination of a blue power law plus a synchrotron model with a turn-over. This source was best fit with a power law of the form , and showed no evidence for synchrotron emission in its optical/NIR SED. The optical spectrum of the source shows strong broad Balmer lines and [O iii] lines of small equivalent width (Tadhunter et al. 1993).
-
•
PKS 2240260: A BL Lac object at . It has a redder optical/NIR SED ( from FWW, and is fitted by WWF with a strong synchrotron component). High optical polarisation has been observed in this source (, Wills et al. (1992)), and only weak, if any, emission lines have been seen. This object was seen to exhibit optical intra-day variability by Heidt & Wagner (1996).
-
•
PKS 2233148: A candidate for a BL Lac (according to Padovani & Giommi (1995)), at . (The redshift of quoted in Johnston et al. (1995) and on NED222The NASA/IPAC Extragalactic Database, http://nedwww.ipac.caltech.edu/ appears to be due to a mis-reading of a table in Schmidt & Green (1983).) This has a similar optical/NIR SED to PKS 2240260, also dominated by synchrotron emission.
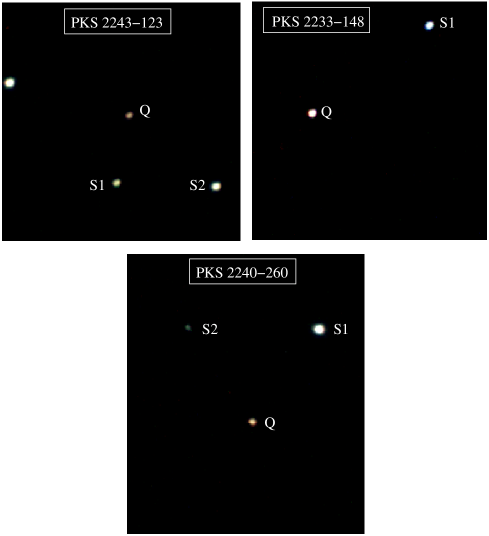
The multi-wavelength (radio – X-ray) SED for each source is shown in Fig. 1, while three-colour images of each of the sources are shown in Fig. 2, indicating the location of the source, as well as nearby stars that were used in the analysis (see Section 3 for details).
These sources were chosen primarily on the basis of their position on the sky (to enable constant observations for the second half of a night, and to minimise the time required for the telescope to move between each source), and also to examine the potential for micro-variability in both BL Lacs (PKS 2240260 and PKS 2233148) and blue radio-loud quasars (PKS 2243123).
These objects were observed in three filters: , and . Each source was observed eight times in each filter. Each of the images is comprised of dithered 60 second images, each made up of twelve averaged 5 sec exposures in , six averaged 10 sec exposures in , and two averaged 30 sec exposures in . The flat field was created from the difference of dome exposures with the lamps on and off – this removes any telescope emission, improving greatly the photometric accuracy. The sky emission was removed by using a median of the four dithered images of the same band taken at the same time. The four images were then aligned and combined using the median (to remove any residual errors). The photometry was done with the apphot package in iraf, using circular apertures with the sky background level determined by the median flux in an annulus around the source. Several different sizes of aperture were used to make sure the underlying host galaxy was not affecting the observed variability. No significant difference was seen for the different aperture sizes – the results presented here use an aperture of 5′′. The seeing varied from over the course of the night. The errors in the photometry shown on the light-curves are purely the random errors from the photometry calculations.
3 MEASURING THE VARIABILITY
In order to construct light-curves for each of the sources, the differential magnitude of the quasar is measured relative to comparison stars in the same field. This differential magnitude is given by , where and are the magnitudes of the quasar and the comparison star respectively. This differential magnitude is then compared to the comparison differential magnitude , where is the magnitude of a second comparison star in the same field. This second differential magnitude acts as a check – a change in flux in the quasar will change but not , while a change that occurs in both will not be intrinsic to the quasar. The light-curves are presented in Figs. 3–5. For clarity, they are offset from each other and plotted with their own vertical scale, relative to the initial point. The zero points for these scales are given in Table 1.


| Source | Band | QS1 | QS2 | S1S2 |
|---|---|---|---|---|
| PKS 2243123 | 0.65 | 1.86 | 1.21 | |
| PKS 2243123 | 0.79 | 1.73 | 0.93 | |
| PKS 2243123 | 0.51 | 1.32 | 0.81 | |
| PKS 2240260 | 2.61 | |||
| PKS 2240260 | 2.16 | |||
| PKS 2240260 | 1.49 | |||
| PKS 2233148 | 0.37 | – | – | |
| PKS 2233148 | 0.07 | – | – | |
| PKS 2233148 | – | – |
It must be noted here that PKS 2233148 did not have a second comparison star in the small () field of view of CASPIR. This means that the full variability analysis cannot be done for this source. However, a light-curve for is presented (Fig. 5), using the one available star.
To determine whether a given source is variable, we use the 99% criterion from Jang & Miller (1997) and Romero et al. (1999). We define the variability confidence level , where and are the standard deviations of the target (quasar–star) and comparison (star–star) light-curves. The variability criterion requires that, for a source to be variable, . Note that these standard deviations merely come from the point-to-point fluctuations in the light curve, and bear no relationship to the error bars displayed in Figs 3-5.
If a source is found to be variable, we also define (in a manner similar to that of Romero et al. (1999)) the variability amplitude of each light-curve by
where and are the minimum and maximum of the differential light-curve respectively. Unlike the amplitude define in Romero et al. (1999), this amplitude is measured in magnitudes, and thus avoids the dependence that a relative amplitude (i.e. as a percentage) has on the normalisation of the light-curve. Table 2 shows the values for for each source with respect to each comparison star, as well as the confidence level and, when the source is variable, the amplitude of that light-curve.
| Source | Band | Comp. | ||||
|---|---|---|---|---|---|---|
| Name | (mag) | Star | (mag) | (mag) | ||
| PKS 2243123 | 0.011 | 1 | 0.048 | 4.56 | 0.15 | |
| 2 | 0.053 | 4.99 | 0.18 | |||
| PKS 2243123 | 0.017 | 1 | 0.063 | 3.59 | 0.21 | |
| 2 | 0.066 | 3.77 | 0.21 | |||
| PKS 2243123 | 0.052 | 1 | 0.100 | 1.90 | (0.28) | |
| 2 | 0.071 | 1.37 | (0.24) | |||
| PKS 2240260 | 0.081 | 1 | 0.022 | 0.27 | – | |
| 2 | 0.092 | 1.13 | – | |||
| PKS 2240260 | 0.125 | 1 | 0.015 | 0.12 | – | |
| 2 | 0.121 | 0.97 | – | |||
| PKS 2240260 | 0.173 | 1 | 0.026 | 0.15 | – | |
| 2 | 0.168 | 0.97 | – | |||
| PKS 2233148 | – | 1 | 0.023 | – | – | |
| PKS 2233148 | – | 1 | 0.064 | – | – | |
| PKS 2233148 | – | 1 | 0.065 | – | – |
4 CONCLUSIONS
4.1 RESULTS
Near-infrared micro-variability is detected in one source, PKS 2243123. There is significant variability in both and bands, while at band, despite both the curves showing variability (with a greater than the other two bands), there is also significant noise present in the comparison light-curve, making it impossible to say at 99% confidence that the quasar itself is varying. It is also worth noting that we see different variability patterns in the different bands (e.g. compare the and light-curves). A possible cause for this is very fast time-scale flickering that affects the different bands differently (since the observations for the various bands are not exactly simultaneous). These observations, nonetheless, demonstrate the additional information acquired when multi-colour data is used in variability analysis (something that is rarely done).
The results for the other two sources are more equivocal. Firstly, the lack of a second comparison star for PKS 2233148 means no conclusions can be drawn about the significance of its fluctuations, although we do note that the values of in the and bands are comparable to those of PKS 2243123.
Secondly, the analysis of PKS 2240260 is compromised by comparison star 2. Since both the and curves show the same variability, it is clear that the origin of this variability is with this star, and not the BL Lac. However, even the light-curve shows little variability, with the values being less than half those of PKS 2243123, indicating that the source is most likely not varying. Since this source was observed to be variable by Heidt & Wagner (1996), our observation indicates that we caught the source in a non-variable period. We do note however that the data from Heidt & Wagner (1996) consisted of 41 observations over 6.39 days, so they were more likely to observe variability.
We can perform a similar analysis on Star 2 (which has the designation 0600-44255475 in the USNO-A2.0 Catalogue333See http://vizier.u-strasbg.fr/vizier/VizieR/pmm/usno2.htx), to quantify the degree of its variability. The results of this analysis are given in Table 3, with the curve acting as the comparison light-curve (i.e. the source of the value). Clearly, this object is exhibiting strong micro-variability. What kind of source is this? We took a noisy spectrum of this source with the ANU 2.3m DBS, and it indicates the source is roughly a late K-type star. This is consistent with the colours of the star in both the optical and near-infrared (taken from the images from FWW). We do note that it is thus too red to be an RR Lyrae star, which would have accounted for the rapidity of its variations. We tentatively suggest it is instead a flare star.
| Source | Band | Comp. | ||||
|---|---|---|---|---|---|---|
| Name | (mag) | Object | (mag) | (mag) | ||
| PKS 2240260 S2 | 0.022 | Q | 0.092 | 4.22 | 0.34 | |
| S1 | 0.081 | 3.72 | 0.30 | |||
| PKS 2240260 S2 | 0.015 | Q | 0.121 | 8.21 | 0.44 | |
| S1 | 0.125 | 8.45 | 0.45 | |||
| PKS 2240260 S2 | 0.026 | Q | 0.168 | 6.50 | 0.43 | |
| S1 | 0.173 | 6.70 | 0.44 |
4.2 INTERPRETATION
The origin of optical and NIR micro-variability in blazar AGN is not very well understood. There are two main types of models that have been developed to explain the observations. Firstly, there are models that use a shock-in-jet setup. This type of model has been used to explain the radio variability seen in blazars (Marscher & Gear 1985). To produce the optical micro-variability, a thin relativistic shock within a jet encounters a feature, such as a bend in the jet or an inhomogeneity in the density, which causes an enhancement of the observed jet emission (see, for example, Gopal-Krishna & Wiita (1992) or Qian et al. (1991)).
A second suggestion for the cause of micro-variability moves away from the jet and looks instead at the accretion disk. Perturbations or instabilities on the surface of an accretion disk (such as “hot-spots” – regions of high temperature and/or density) can create micro-variations in the emission (see Mangalam & Wiita (1993) and references therein). It is likely that both models are important for micro-variability in AGN, and the relative importance for individual sources depends on the relative strengths of the jet and disk emission.
The quasar PKS 2243123 has a blue optical/NIR SED (the photometry from these observations gives the same NIR slope as the photometry presented in FWW, and is modelled in WWF by a blue power law). It thus shows no evidence for synchrotron emission in its optical spectrum (a fact also supported by its observed strong emission lines). Hence, it is unlikely that fluctuations in the jet emission will cause the observed micro-variations, unless the jet is present at a very low level and experiences relatively large fluctuations. It seems then that the micro-variability in this source is more likely to be explained by the accretion disk instability model.
To test this statement, we can take the model fitting from WWF to an extreme, so that a synchrotron component is fit along with a very blue () power law. This generates the maximum amount of synchrotron flux according to this model. The amount of synchrotron as a proportion of total flux in the near-infrared ranges from 3.4% (at band) to 5.4% (at band). If we assume that the synchrotron component is the only component that is varying, then to produce the observed fluctuations, the synchrotron component must vary in flux by a factor of at least 7 (on a time-scale of about an hour). The accretion disk instability model allows us to avoid such extreme variability, and is consistent with observations of micro-variability in radio-quiet quasars (e.g. Gopal-Krishna et al. 2000).
Finally, since the observations presented here were limited in scope (due to the time available), a follow-up study would be quite worthwhile. Such a study should involve selecting a small sample of quasars (and BL Lacs) that has some sources with synchrotron dominated SEDs (this part of the sample would contain the BL Lacs, based on the modelling in WWF), and some with blue power law SEDs (in the manner of PKS 2243123). The observations would ideally cover a greater period of time than that described in this paper, to increase the probability of seeing variability. This would also enable a better determination of the nature and structure of the variability. The relative amounts of micro-variability in the two types of sources could then be gauged accurately, particularly in light of our detection of micro-variability in the blue quasar. This would hopefully give an indication of how important each model is for micro-variability in all types of radio-loud AGN.
Acknowledgements
We wish to thank the two anonymous referees for their helpful comments, and the MSSSO TAC for granting us the time on the 2.3m telescope.
References
de Diego, J.A. et al. 1998 ApJ 501, 69
Drinkwater, M.J. et al. 1997, MNRAS 284, 85
Francis, P.J., Whiting, M.T. and Webster, R.L. 2000, PASA 17, 1, 56 (FWW)
Gopal-Krishna et al. 2000 MNRAS, 314, 815
Gopal-Krishna and Wiita, P.J. 1992, A&A 259, 1992
Heidt, J. and Wagner, S.J. 1996, A&A 305, 42
Hewitt, A. and Burbidge, G. 1993, ApJSS 87, 451
Jang, M. and Miller, H.R. 1997, AJ 114, 565
Johnston, K.J. et al. 1995, AJ, 110, 880
Kovalev, Y.Y. et al. 1999, A&AS 139, 545
Mangalam, A.V. and Wiita, P.J. 1993, ApJ 406, 420
Marscher, A.P. and Gear, W.K. 1985, ApJ 298, 114
McGregor, P., Hart, J., Downing, M., Hoadley, D., and Bloxham, G. 1994, in Infrared Astronomy with Arrays: The Next Generation, ed. McLean, I.S. (Dordrecht: Kluwer), p.299
Miller, H.R. and Noble, J.C. 1996, in Blazar Continuum Variability, ed. Miller, H.R., Webb, J.R. and Noble, J.C., ASP Conference Series vol.110, 17
Padovani, P. and Giommi, P. 1995, MNRAS 277, 1477
Qian, S.J. et al. 1991, A&A 241, 15
Romero, G.E., Cellone, S.A. and Combi, J.A. 1999, A&AS 135, 477
Schmidt, M. & Green, R.F. 1983, ApJ, 269, 352
Shen, Z. et al. 1998, AJ 115, 1357
Siebert J. et al. 1998, MNRAS 301, 261
Tadhunter, C.N. et al. 1993, MNRAS 263, 999
Wagner S.J. and Witzel, A. 1995, ARA&A 33, 163
Whiting, M.T., Webster, R.L. and Francis, P.J. 2001, MNRAS, 323, 718 (WWF)
Wills, B.J. et al. 1992, ApJ 447, 139