Absolute dimensions of the M-type eclipsing binary YY Geminorum (Castor C): a challenge to evolutionary models in the lower main-sequence11affiliation: Some of the observations reported here were obtained with the Multiple Mirror Telescope, a joint facility of the Smithsonian Institution and the University of Arizona.
Abstract
We present new spectroscopic observations of the detached late-type double-lined eclipsing binary YY Gem ( days), a member of the Castor sextuple system and one of the benchmarks for the comparison between observations and stellar evolution theory in the lower main-sequence. In addition, we have re-analyzed existing light curves in several passbands using modern techniques that account for the conspicuous presence of spots. This, combined with the spectroscopy, has yielded a very precise determination of the absolute dimensions of the components, which are virtually identical to each other. We obtain for the mean mass, radius, and effective temperature the values M☉, R☉, and K. Both the mass and the radius determinations are good to better than 1%, which in the case of the radius represents a fourfold improvement over previous results and significantly enhances the value of this quantity for testing the models. We discuss the importance of systematic effects in these measurements, by comparison with another high-precision determination of the mass by Ségransan et al. (2000). A re-analysis of the Hipparcos transit data for Castor AB that accounts for the relative motion of the pair in its 467 yr-period orbit has yielded an improved parallax for the system of mas. With this, we have estimated the age (370 Myr) and metal abundance ([Fe/H] ) of YY Gem from isochrone fits to Castor A and B under the assumption of a common origin. This, along with the other physical properties, allows for an unusually stringent test of the models for low-mass stars. We have compared the observations of YY Gem with a large number of recent theoretical calculations, and we show that all models underestimate the radius by up to 20%, and most overestimate the effective temperature by 150 K or more. Both of these trends are confirmed by observations of another similar system in the Hyades cluster (V818 Tau). Consequently, theoretical ages for relatively low-mass objects such as T Tauri stars derived by placing them on the H-R diagram may be considerably biased. If the radius is used directly as a measure of evolution, ages could be underestimated by as much as a factor of 10 in this mass regime. In view of these discrepancies, absolute ages from essentially all current models for the lower main sequence must be viewed with at least some measure of skepticism. Finally, we derive a new and very accurate ephemeris based on all available times of eclipse, and we lay to rest previous claims of sudden changes in the orbital period of the binary, which we show to be spurious.
Subject headings:
binaries: eclipsing — binaries: spectroscopic — stars: fundamental parameters — stars: individual (YY Geminorum)1. Introduction
The validation of theoretical models of stellar structure and stellar evolution relies heavily upon the accurate determination of the absolute dimensions of stars in detached eclipsing binary systems. For main-sequence stars in the mass range from about 1 to 10 M☉ the models are now reasonably well constrained by the observations, with some four or five dozen systems available that have the required precision of 1–2% in the masses and radii (see Andersen 1991; 1997). The situation in the lower main sequence, however, is far less satisfactory. Despite the ubiquity of K and M stars in the Galaxy, known cases of detached eclipsing binary systems in which one or both components are of low mass are extremely rare because of observational limitations (the stars are fainter and therefore more difficult to study). For decades, only two systems composed of M-type stars were known: CM Dra (M4.5 Ve, mass 0.25 M☉; Lacy 1977; Metcalfe et al. 1996) and YY Gem (M1.0 Ve, mass 0.6 M☉; Bopp 1974; Leung & Schneider 1978). Very recently a third example has been found, CU Cnc (M3.5 Ve; Delfosse et al. 1999), with component masses that are intermediate between the other two systems111In addition to these, two other eclipsing systems with M-type components have been discovered by the OGLE microlensing project (Udalski et al. 1993) in the direction of the Galactic bulge: BW3 V38 (Maceroni & Rucinski 1997) and BW5 V173 (Maceroni & Rucinski 1999). The first of these is a very tight binary that may or may not be detached. The second appears well detached. However, both are very faint ( and 20.5, respectively), which makes them exceedingly difficult to study.. All three binaries are flare stars.
YY Gem (Castor C, Gliese 278C, BD, , , J2000, ) belongs to a remarkable sextuple system in which the brightest member is Geminorum (Castor). Gem itself is a visual binary with a current angular separation of about 39. The components of Castor orbit each other with a period of 467 yr (Heintz 1988). Each of them, in turn, is a single-lined spectroscopic binary: Castor A ( Gem, HD 60179; the brighter star) has a period of 9.21 days, and Castor B ( Gem, HD 60178) has a period of 2.93 days (Vinter-Hansen 1940). YY Gem is separated from these two by , it is at the same distance and has the same proper motion, and it is a double-lined spectroscopic binary with a period of 0.814 days (19.5 hours). Its duplicity was discovered spectroscopically in 1916 by Adams & Joy (1920), and the first spectroscopic orbit was reported by Joy & Sanford (1926). Almost simultaneously van Gent (1926) discovered eclipses, and presented a light curve based on photographic observations. Numerous studies since then have established that the orbit is essentially circular and that the components are very similar in all their properties. Modern photoelectric observations were obtained by Leung & Schneider (1978, hereafter LS78), and showed a complication that earlier observers had also noted, namely, irregularities or distortions in the light curve attributed to the presence of surface inhomogeneities (spots) that are common in this class of stars. These have been generally dealt with by a variety of ad-hoc rectification procedures. YY Gem is in fact the first star, other than the Sun, on which these maculation effects were validated (Kron 1952). The spectroscopic study by Bopp (1974), which until now has set the limit on the precision of the masses at approximately 4% (see Andersen 1991), has very recently been superseded by a new study by Ségransan et al. (2000; hereafter S00) reporting formal errors as small as 0.2%.
Considerable progress has been made in recent years in the modeling of low-mass stars (see, e.g., Saumon, Chabrier & Van Horn 1995; Chabrier & Baraffe 1997; Hauschildt, Allard & Baron 1999, and references therein), with significant improvements in the model atmospheres that are now applied as boundary conditions to the interior equations, as well as in the opacities, the equation of state, and other ingredients. Because of the paucity of suitable binaries in this regime, the accuracy as much as the precision of the fundamental properties derived for the stars in the three known low-mass eclipsing systems are particularly important if the comparison with theory is to be helpful. At the level of 1% in the uncertainties, as required for such tests, the data must be examined very carefully for systematic errors that might bias the results (particularly the masses, which hinge on the spectroscopy), since these often represent the dominant contribution to the uncertainty.
The spectroscopic study by S00 certainly meets the demands for high precision in the masses. In this paper we present our own spectroscopic investigation of YY Gem based on new observations made at the Harvard-Smithsonian Center for Astrophysics, yielding masses with formal uncertainties also under 1%. Thus, two completely independent spectroscopic studies with similarly small errors are now available for YY Gem, a rare occurrence for eclipsing binaries in general, and unprecedented for the lower main sequence. This presents us with a unique opportunity to evaluate the consistency between internal and external mass errors in this key system.
Accurate determinations of the radii, a sensitive indicator of evolution, also contribute critical information for the comparison with theory. In addition to our new mass determinations, we have re-analyzed existing light curves from the literature with modern methods in order to obtain improved estimates of the size of the stars in YY Gem that are also good to better than 1%.
As we discuss in §6, our results provide particularly strong constraints on evolutionary tracks and suggest rather significant shortcomings in recent model calculations that require careful attention. The impact of these shortcomings is felt especially in the field of young stars, where the theoretical ages deduced for T Tauri stars and other objects occupying the lower regions of the H-R diagram may be seriously biased.
The motivation for this paper is thus fourfold: () To establish accurate masses for the components of YY Gem from our new radial-velocity observations, with a detailed discussion of potential systematic errors intrinsic to our study and also compared to other studies; () to improve the radii by re-analyzing existing light curves with modern techniques that can model spots simultaneously with the other parameters of the light curve, and which were not available at the time the original photometric studies were made; () to carry out a detailed comparison with recent stellar evolution models for low-mass stars in order to evaluate competing calculations and to test the physical assumptions involved; () to investigate unconfirmed claims of changes in the orbital period of YY Gem that are quite unexpected for a system of its characteristics, and have remained unexplained.
2. Spectroscopic observations and reductions
YY Gem was observed at the Harvard-Smithsonian Center for Astrophysics (CfA) from 1996 October to 1998 January. We used three nearly identical echelle spectrographs on the 1.5-m Wyeth reflector at the Oak Ridge Observatory (Harvard, Massachusetts), the 1.5-m Tillinghast reflector at the F. L. Whipple Observatory (Mt. Hopkins, Arizona), and on the Multiple Mirror Telescope (also Mt. Hopkins, Arizona) prior to its conversion to a monolithic 6.5-m mirror. A single echelle order centered at 5187 Å was recorded using intensified photon-counting Reticon detectors, giving a spectral window of about 45 Å. The resolving power of these instruments is , and the signal-to-noise (S/N) ratios achieved for YY Gem range from about 10 to 40 per resolution element of 8.5 km s-1. A total of 90 spectra were obtained. The stability of the zero-point of our velocity system was monitored by means of exposures of the dusk and dawn sky, and small systematic run-to-run corrections were applied in the manner described by Latham (1992).
Radial velocities were derived with the two-dimensional cross-correlation algorithm TODCOR (Zucker & Mazeh 1994), which uses a combination of two templates, matched to each of the components of the binary. This method is ideally suited to our low S/N observations, and has the important advantage that it minimizes potential errors caused by “peak pulling” in the standard one-dimensional correlations of composite spectra. By this we refer to systematic shifts in the velocities due to blending between the two main correlation peaks, or between either peak and the sidelobes of the other peak. The second of these problems can be significant in correlations over a narrow wavelength window such as ours, where only a limited number of spectral lines are available (see Latham et al. 1996).
The selection of templates for the components of YY Gem presents a special challenge given the low temperatures of the stars and the demands on high accuracy for this particular system. In regular binary work at CfA on systems of earlier spectral type the templates for the correlations are usually selected from an extensive library of synthetic spectra computed for us by J. Morse, that are based on model atmospheres by R. L. Kurucz222Available at http://cfaku5.harvard.edu.. These synthetic spectra provide an excellent fit to the real observations, and have the advantage that they can be computed over a wide range of effective temperatures (), metallicities ([m/H]), surface gravities (), and projected rotational velocities (), specifically for the resolution and wavelength region of our observed spectra (J. A. Morse & R. L. Kurucz 2002, in preparation; see also Nordström et al. 1994). However, for temperatures much cooler than about 4000 K, which is precisely the case for YY Gem, the match to the spectra of real stars is degraded mainly because the models do not incorporate some key molecular opacity sources that become important in this regime. Consequently, there is the potential for systematic errors in the radial velocities and in the derived masses. As an alternative, templates based on real spectra taken with the same instrumental setup may be used, but these present complications of their own, not the least of which is the limited choice of sufficiently bright single stars with precisely the right spectral type. For example, the overlap in wavelength with the spectra of YY Gem will generally be reduced somewhat depending on the Doppler shift of the star selected as the template (in addition to the difference in heliocentric velocities), whereas the synthetic spectra described above were calculated over a wider wavelength range precisely to accommodate relative Doppler shifts. We have performed extensive series of tests with both kinds of templates, as described in more detail below.
Given the similarity of the components in YY Gem, initially we selected synthetic templates with an effective temperature of 3750 K for both stars, based on preliminary estimates derived from photometry. The surface gravity was set to , and we adopted the solar metallicity. To determine the appropriate rotational broadening we ran grids of cross-correlations with TODCOR for a wide range of values of separately for each template. We selected the combination giving the highest correlation, averaged over all exposures and weighted by the corresponding S/N ratio of each observation.
For historical reasons, and to avoid confusion in the identification of the nearly identical components, we follow in this paper the naming convention adopted by van Gent (1931) based on the appearance of the light curve. The star eclipsed at the slightly deeper minimum (phase 0.0, Min I) is referred to as the “primary”, or star “A”, in the standard photometric usage. The epoch of this minimum is given in §3, and differs only by an integer number of cycles from the original epoch reported by van Gent. As it turns out, the mass of star A is formally smaller than that of the other component, though only marginally so.
Residual systematic errors in the velocities resulting from the narrow spectral window were checked by means of numerical simulations as discussed in detail by Latham et al. (1996). Briefly, we generated a set of artificial binary spectra by combining the primary and secondary templates in the appropriate ratio and applying velocity shifts for both components as computed from a preliminary orbital solution at the actual times of observation of each of our spectra. These artificial spectra were then processed with TODCOR in exactly the same way as the real observations, and the resulting velocities were compared with the input (synthetic) values. The differences (TODCOR minus synthetic) are shown in Figure 1 as a function of velocity and also orbital phase, and are clearly seen to be systematic in nature. They reach values as large as at the phase of maximum velocity separation, or about 1.5% of the velocity semi-amplitudes (120 km s-1). This translates into a 5% effect in the masses, which is very significant. These differences were applied as corrections to the velocities measured from the real spectra of YY Gem.
Experiments were carried out using the spectrum of a real star as the template, instead of calculated spectra. For this we chose Gliese 908 (BD4774, HIP 117473), which has a spectral type of M1 Ve (Henry, Kirkpatrick & Simons 1994), matching that of YY Gem. A strong exposure of Gliese 908 was obtained for this purpose with our instrumentation at the Multiple Mirror Telescope. The spectrum of the star was rotationally broadened by various amounts, and grids of correlations were run in the same way as above to determine the values that best match each component of YY Gem. Radial velocities were obtained with TODCOR as before, and corrections were determined by creating artificial composite spectra based on Gliese 908. The results were generally not as satisfactory as with the synthetic spectra. Correlation values were typically lower, the residuals from the orbital solution were somewhat larger and showed systematic trends, and the corrections for systematic effects based on simulations were some 3 times larger. The latter suggested to us that the use of this observed template carries a higher risk of residual systematic errors. In addition, the light ratio came out significantly smaller than unity, a rather unexpected result for stars of nearly equal temperature and mass (see below).
Based on these experiments we chose to adopt synthetic templates for the cross-correlations, with final parameters adjusted slightly to K and for both stars. The temperature of the mean component is based on a number of photometric indices (see §5), while the projected rotational velocity is the average of the individual determinations (formally 36.4 km s-1 and 37.8 km s-1 for star A and B, respectively, with estimated uncertainties of 2.0 km s-1). Templates with these parameters were calculated by interpolation in our library of synthetic spectra. We repeated the procedure described above to derive the corrections for systematic errors due to the narrow spectral range, which changed very little.
The light ratio was obtained from our spectra following the procedure outlined by Zucker & Mazeh (1994). Numerical simulations analogous to those described above were carried out to correct for systematic effects that result as the spectral lines of the components shift in and out of the spectral window as a function of phase. These errors reach a maximum of about 15% at the phases of maximum velocity separation between the components. The value we obtained, after corrections, is . Strictly speaking, this is the ratio at the mean wavelength of our spectra (5187 Å), but, because the stars are so similar, for all practical purposes it can be considered to be the same in the visual band.
The final heliocentric radial velocities we obtained, including corrections, are listed in Table 1. As will be seen later in §4, the stars in YY Gem are so nearly spherical that the effects of tidal and rotational distortions on the measured radial velocities are negligible for this system.
Our spectroscopic orbital solution is shown graphically in Figure 2, along with the observations. The ephemeris adopted here is that of §3, based on an analysis of all available times of minimum. The elements of the orbit are given in Table 2, and the residuals for each velocity are listed with the observations in Table 1. Tests allowing for a non-circular orbit indicated an eccentricity that was not significantly different from zero (), in agreement with evidence described later from the times of minimum (§3) and from the light curve (§4). Consequently, we adopted a circular orbit.
In a very recent paper S00 reported new spectroscopic observations of YY Gem obtained with the ELODIE spectrograph (Baranne et al. 1996), a high-precision instrument used for extrasolar planet searches. Due to the relatively rapid rotation of the components, the formal uncertainty of a single observation of YY Gem in this new study is degraded with respect to the normal performance of that instrument for sharp-lined stars, so that the precision of an individual radial velocity measurement turns out to be roughly the same as ours. However, the orbital fitting procedure adopted by S00 is different from ours in that they incorporate the one-dimensional cross-correlation profiles directly, rather than first deriving radial velocities and then solving for the orbital elements. The velocity semi-amplitudes that they obtain333The values reported originally by S00 are incorrect, as we describe in more detail in §5.1. The semi-amplitudes we give here are the result of a more sophisticated adjustment and are to be preferred (Forveille 2001, priv. comm.) ( and ), which ultimately set the masses, are nevertheless quite similar to ours (see Table 2). The main difference is that those values are systematically larger than ours by about , a discrepancy of . We discuss the significance of this difference for the mass determinations in §5. Their mass ratio () is very similar to the value we derive.
3. The orbital period of YY Gem
Numerous photometric and spectroscopic studies of the system over the years have been based on a period identical to or close to that derived by van Gent (1931) in his original photographic investigation of YY Gem, which is days. No evidence of any change in this period was reported in the literature until the study by LS78, who observed the star photoelectrically in 1971 and carried out a detailed light-curve analysis. These authors claimed that the classical period did not fit their data, and derived a much longer period of days from four times of minimum based on their own observations (one primary minimum and three secondary minima). This very significant change in the period (5.5) is difficult to understand for normal main-sequence stars that are not interacting, and prompted Mallama (1980a) to investigate the issue. He concluded that the LS78 period was most likely in error, probably because of the very short baseline of those observations (only six days, with the eclipse timings spanning only four days). Kodaira & Ichimura (1980) also studied the problem, and again dismissed the period of LS78 as erroneous, ascribing it to irregularities in the 1971 light curve due to spots, which could have affected the times of minimum derived by Leung & Schneider. Neither of these explanations is very easy to accept given the relatively high quality and completeness of the observations by LS78, and this discrepancy in the period has remained something of a mystery ever since.
We have re-examined the issue here, in an effort to provide an accurate understanding and a new determination of the period of YY Gem for our own re-analysis of the LS78 and other light curves in §4. In Table Absolute dimensions of the M-type eclipsing binary YY Geminorum (Castor C): a challenge to evolutionary models in the lower main-sequence11affiliation: Some of the observations reported here were obtained with the Multiple Mirror Telescope, a joint facility of the Smithsonian Institution and the University of Arizona. we have collected from the literature all available times of minimum in order to look for any trends suggesting changes in the period. Excluding the four measurements by LS78, there are 57 determinations for the primary and 55 for the secondary spanning more than 73 years, obtained using a variety of methods. One of them (a secondary minimum indicated in parenthesis in Table Absolute dimensions of the M-type eclipsing binary YY Geminorum (Castor C): a challenge to evolutionary models in the lower main-sequence11affiliation: Some of the observations reported here were obtained with the Multiple Mirror Telescope, a joint facility of the Smithsonian Institution and the University of Arizona.) gave an unusually large residual, and was rejected. We performed a least-squares fit for a linear ephemeris using these data, with errors adopted from the original sources when available. Most determinations have no published errors, however, and we determined these iteratively based on the mean residuals for each type of observation (photographic, visual, and photoelectric) from preliminary fits. The adopted uncertainties for each method are days, days, and days, respectively. No unusual patterns were seen in the residuals. The ephemeris derived is
| (1) |
in which the period is nearly identical to that by van Gent (1931), but two orders of magnitude more precise. Thus, there is no evidence of any significant change in the period from the eclipse timings prior to, or following those of LS78.
The photoelectric observations by LS78 were obtained in 1971 January 13-19 at the Kitt Peak National Observatory. The authors list the heliocentric Julian date and magnitude of YY Gem in the filters for each of their measurements. Using the new ephemeris above we have confirmed the claim by Leung & Schneider that their light curve is not well fit by the classical period, and that the longer value they report is clearly better for their data. Barring a sudden change in period with a subsequent return to the previous value —a highly unlikely scenario— this indicates that the problem must lie in the times of observation recorded by LS78.
The average residual of their four times of minimum from the new ephemeris is 0.0038 days. Though somewhat larger than typical for photoelectric determinations, a more serious concern is a systematic trend clearly visible over the four consecutive nights such that the first residual is 0.0012 days and the last is 0.0079 days, unacceptably large for the photoelectric technique. In an attempt to understand this we reconstructed the circumstances of each photometric observation (time during the night, hour angle, air mass, etc.) based on the Julian dates tabulated by LS78. In doing so we noticed that, for the date of these measurements, the Universal Time (from which the fractional Julian dates are computed) is numerically very similar to the Local Mean Sidereal Time. A confusion between these two would explain why the period by LS78 is longer than the true value, since its units would then be sidereal days instead of mean solar days. Correcting the LS78 period by the appropriate factor brings it into agreement with our value in eq.(1) within about 1.5. Thus, it appears quite plausible that all Julian dates by LS78 are indeed affected by this error.
Once the four eclipse timings of LS78 are corrected, the increasing trend we noted above in the residuals from the new ephemeris disappears completely. However, the average residual is even larger than before (0.0126 days), pointing perhaps to some other problem. The fact that this difference is approximately twice the value of the heliocentric correction for these dates (which happens to be near its maximum) may not be entirely a coincidence, and it is conceivable that LS78 mistakenly applied the correction with the wrong sign. Under this assumption we tentatively corrected all the original times of observation, and the average residual of the four times of minimum was reduced to 0.0016, or about 2 minutes. This is now essentially the same as the mean error found above for photoelectric eclipse timings from other sources.
With the original LS78 times of observation corrected for these two effects, the scatter at the minima in their light curves when folded with the period in eq.(1) is now marginally smaller than when using their own period determination. That this is a fortunate coincidence seems very unlikely, and while the confusion with the sign of the heliocentric correction is perhaps debatable, it seems clear that the long-standing mystery of the discrepancy in the period of YY Gem is adequately explained by the inadvertent use by Leung & Schneider of local sidereal times instead of universal (mean solar) times.
Because of lingering uncertainties about the second of the corrections applied to these data, we have chosen not to use the times of minimum by LS78 as modified above in our final period determination. Their inclusion has a minimal effect in any case. Nevertheless, we list them in Table Absolute dimensions of the M-type eclipsing binary YY Geminorum (Castor C): a challenge to evolutionary models in the lower main-sequence11affiliation: Some of the observations reported here were obtained with the Multiple Mirror Telescope, a joint facility of the Smithsonian Institution and the University of Arizona. for completeness, with the residuals in parentheses.
The ephemeris in eq.(1) was derived assuming a circular orbit for YY Gem. An independent fit of the times of eclipse allowing for an eccentric orbit indicated that the secondary minimum occurs at phase , essentially consistent with zero eccentricity. This agrees with the evidence from spectroscopy (§2), and similar indications from the light curve solutions described below. Additional fits for separate orbital periods based on the primary and secondary minima indicated no detectable apsidal motion: days, days, with a difference at the 1.5 level.
4. Photometric observations and analysis
Light curves for YY Gem have been obtained by a number of authors using a variety of techniques since its discovery as an eclipsing binary. In nearly all cases they have been found to be affected to some extent by distortions and irregularities that are most likely due to spots. Among the most complete and precise series of observations published are those by Kron (1952) and LS78. In both cases the original investigators rectified the light curves prior to the analysis by removing the effect of the spots empirically, since the computational methods available at the time did not allow the irregularities to be taken into account as an integral part of the analysis. Modern computer codes have improved considerably over the years incorporating better physical models, model atmospheres, and also the ability to solve for the parameters describing the effects of spots on the light curves simultaneously with the rest of the light elements. These improvements can potentially have some effect on the determination of the radius and other parameters, and have motivated us to re-analyze the original data sets in an effort to extract the most accurate results possible.
The data by Kron (1952) consist of 251 photoelectric observations made with a 0.3-m refractor at the Lick Observatory from February to April of 1948, at an effective wavelength of 5200 Å. Distortions in the light curve due to spots are quite obvious and appear to affect all phases. Observations were also obtained in the near infrared ( Å), but unfortunately those measurements were never published. The data by LS78 comprise some 790 photoelectric observations in each of the Johnson filters obtained on a 0.9-m telescope at the Kitt Peak National Observatory during six nights in January of 1971. The precision (mean error) of an individual measurement is quoted as being 0.012 mag, 0.009 mag, and 0.009 mag in the visual, red, and infrared bands, respectively. Once again the light curves show obvious distortions, particularly in the vicinity of the secondary minimum, which is slightly asymmetric. Close inspection also showed certain phase intervals with significantly larger scatter. Further investigation revealed that the photometric observations on some nights were pursued to very high airmass (approaching 3 in the most extreme case). After careful evaluation of the agreement among the different nights, we chose to reject observations acquired at airmasses larger than 1.8, at which we begin to see obvious distortions. In addition, a few isolated measurements that appeared markedly discrepant were eliminated. The number of photometric observations selected for further analysis was reduced to 640, 635, and 634 for , respectively. The ephemeris used to phase all light curves is that given by eq.(1), and in the case of LS78 the published times of observation were corrected before use as described in §3.
The fits to the light curves were performed using an improved version of the Wilson-Devinney program (Wilson & Devinney 1971; hereafter WD) that includes a model atmosphere routine developed by Milone, Stagg & Kurucz (1992) for the computation of the stellar radiative parameters, based on the ATLAS9 code by R. L. Kurucz. A detached configuration, as suggested by the shape of the light curve (i.e., relatively narrow and similar eclipses) was chosen for all solutions. Both reflection and proximity effects were taken into account, even though the light curves do not show strong evidence for these. The bolometric albedo was initially fixed at the canonical value of 0.5 for stars with convective envelopes. The gravity-brightening coefficient was set to a value of 0.2, following the theoretical results of Claret (2000) for stars with the effective temperature of YY Gem. For the limb darkening we used a logarithmic law as defined in Klinglesmith & Sobieski (1970), with first- and second-order coefficients interpolated at each iteration for the exact and of each component from a set of tables computed in advance using a grid of Kurucz model atmospheres. Negligible differences were seen in the results when using linear, quadratic, or square-root limb-darkening approximations for the temperature and surface gravity regime of YY Gem.
A mass ratio of was adopted from the spectroscopic solution, and the temperature of the primary component (eclipsed at phase 0.0) was set to 3820 K, as discussed in §5. The iterations in the WD code were carried out in an automatic fashion until convergence, and a solution was defined as the set of parameters for which the differential corrections suggested by the program were smaller than the internal probable errors on three consecutive iterations. As a general rule, several sets with different starting parameters were used to test the uniqueness of the solutions and to make more realistic estimates of the uncertainties.
The solutions to the light curves of Kron and LS78 were run independently because of the conspicuous changes in the location and geometry of the surface inhomogeneities. We discuss first the analysis of the light curves of LS78, which span a wider wavelength range and display better phase coverage.
4.1. Fits to the light curves of Leung & Schneider (1978)
Simultaneous WD fits to the light curves were carried out using the mean error of a single measurement quoted by LS78 as the relative weight, , of each passband (WD “curve-dependent” weighting scheme). For the weighting of the individual measurements within each passband we experimented with three different schemes: equal weights for all observations, double weight to observations within the eclipse (to emphasize the phases that contain the most information), and photon-noise dependent weights. Our tests yielded nearly identical solutions (to within 0.2%) regardless of the weighting scheme used, and in the end we adopted equal weights for simplicity and objectiveness.
In our initial WD solutions we solved for the following light curve parameters: the orbital inclination (), the temperature of the secondary (or in practice the ratio ), the gravitational potentials ( and ), the luminosity of the primary (), a phase offset (), and the spot parameters. Consistent with earlier indications, the eccentricity was set to zero to begin with. Numerous test solutions revealed early on that the ratio of the radii of the components (, where and are the fractional radii in units of the separation) was poorly constrained. This is not at all unexpected in systems like YY Gem, with very similar components that undergo partial eclipses. In such cases the solutions are often degenerate because the light curve residuals are insensitive to variations in . To evaluate this effect using WD we ran a number of solutions in which we fixed to values between 6.75 and 7.80 and solved for (probing values of between and ). A plot of the residuals as a function of is shown in Figure 3. As can be seen, the total weighted sum of residuals squared, , hardly changes for in the range between and , leaving the solution essentially dominated by numerical noise. The rest of the orbital and physical properties of the system (, , the sum of the fractional radii, etc.) remained nearly constant within this interval. Thus, the photometry for YY Gem is unable to discriminate between the sizes of the components.
An alternative is to use the light ratio from spectroscopy as an external constraint. However, as we discuss below, the light ratio in this system is not well defined either, due to the presence of spots. Under these circumstances, and given that the two stars have nearly identical masses (to within 0.5%), we chose to adopt (i.e., identical radii) for all light curve solutions. In practice, the ratio is not one of the parameters considered explicitly in the WD code. Instead, it is the surface potentials of the stars (which, along with , control the sizes) that can be fixed or left free. To circumvent this problem we ran solutions by fixing to different values and leaving free until the resulting fractional radii were the same. We found that this occurred for , which leads to a solution with . For the remainder of the solutions we fixed to this value of .
It is quite obvious from the sinusoidal shape of the light curves outside of eclipse that at least one of the components, or perhaps both, have surface inhomogeneities. This is consistent with the level of activity displayed by the system (see, e.g., Moffett & Bopp 1971; Ferland & Bopp 1976), but it complicates the analysis significantly. We describe the details of our spot analysis below.
4.1.1 Spot modeling
The WD program incorporates a simple spot model with circular spots that are described by four parameters, namely, the longitude, latitude, angular radius, and temperature ratio (spot relative to photosphere). As is well known, the effects of some of these parameters on the light curves are typically rather similar so that they can rarely be separated on the basis of the photometric observations alone, unless the quality of the curves is superb and the wavelength coverage is very broad. For example, the latitude of a spot is very weakly constrained by the light curves, and the radius and the temperature ratio are very strongly correlated. Furthermore, the addition of these new parameters generally makes convergence more problematic, and one is often forced to consider multiple parameter subsets in order to render the problem manageable (see Wilson & Biermann 1976).
To facilitate the analysis, we have used external constraints to fix some of the spot parameters. Doppler imaging is a powerful technique that employs fits to stellar lines to map asymmetries on the stellar surface. This technique was successfully applied to YY Gem by Hatzes (1995) using echelle spectroscopy obtained during late 1992 and early 1993. The results of Hatzes’ analysis indicate that the spot activity is located within a band centered at a latitude of about on both components (although symmetry about the equator arises for systems with the high inclination of YY Gem). In addition, the temperature difference between the coolest regions and the photosphere was found to be between 300 K and 500 K, with the spots being cooler (dark). Since YY Gem is a fairly active star we cannot assume that the spot parameters (including spot size and longitude) remain constant over the 22-year span between the epoch of the LS78 photometry and the time of Hatzes’ (1995) spectroscopy. It seems justified, however, to assume the temperature contrast of the active regions and their marked confinement in latitude to be more intimately related to the nature of YY Gem. There is, in fact, theoretical evidence that this may be the case. Granzer et al. (2000) have modeled the dynamics of magnetic flux tubes in stars with masses between 0.4 M☉ and 1.7 M☉, and studied the emergence patterns of star spots at the stellar surface. For stars with the mass, rotation rate, and evolutionary state of YY Gem they predict spot emergence at intermediate latitudes, just as observed by Hatzes (1995). Thus, for the light curve analyses in this paper we have placed the spots at a fixed latitude of and assumed them to be about 400 K cooler than the photosphere (i.e., )444In principle bright spots (plages) could also explain the observed distortions in the light curves, and in fact Kron’s (1952) original analysis called for bright patches in addition to darker regions. However, it is generally not possible to discriminate unambiguously between the two kinds of spots solely on the basis of a light curve. Even the Doppler imaging technique has similar difficulties unless the spectroscopic observations are supported by simultaneous multi-wavelength light curves (see, e.g., Rice & Strassmeier 2000). In any case, the effect on the geometric parameters of the system is very small. For this reason, and because the features considered in most previous analyses and also modeled tomographically by Hatzes (1995) are dark, we assume here that the spots are cooler than the photosphere.. The only spot parameters left to determine are therefore the size and longitude.
We initially attempted to fit the light curves by considering the simplest model of a single spot on one of the components. The solutions converged towards a spot of in radius which transits the meridian at phase 0.656. However, the light curve fits displayed obvious systematic patterns in the residuals along the phases where the spot is in view. Further analysis indicated that the systematics were a consequence of the inability of the adopted spot model to fit a wave that extends for almost three quarters of a period. Intuitively one would expect a small-sized spot to be able to account for a wave spanning roughly half a period. When both the latitude of the spot and the temperature contrast were allowed to vary, the solution tended towards a larger spot (radius of approximately ) at lower latitude () and with a temperature only 90 K cooler than the photosphere. This (somewhat unphysical) combination of parameters was the code’s best attempt to account for the phase extent of the wave with a single spot, but resulted in a fit that was rather unsatisfactory. Tests with the spot located on either component were run, but no noticeable differences were seen; the information contained in the light curves is insufficient to tell which component the spot is located on.
Given the residual trends seen with a single-spot model, a better and perhaps more realistic approach to reproducing the observed light curves would be to consider an elongated spot distribution, especially since the features actually observed by Hatzes (1995) are in fact extended in longitude. This was done by adopting two spots in the WD model located at the same latitude, but at different longitudes and allowing also for different sizes. Tests were first run by assuming both spots to be located on the photometric secondary (more massive) component. The fit yielded spot radii of and , with meridian transits at phases 0.733 and 0.594 (i.e., apart in longitude), respectively. This spot configuration provides a rather good fit to the out-of-eclipse wave in all filters. Further tests with one spot on each star gave a marginally better fit (total sum of residuals squared of 0.3095 vs. 0.3118). The best-fitting spots have radii of and , with meridian transits at phases 0.733 and 0.587, located on the primary and secondary components, respectively.
Interestingly, a spectroscopic study of YY Gem by Bopp (1974) recorded a number of flares from both components, one of which occurred just three weeks after the observations by LS78. Various geometrical restrictions allowed Bopp to constrain the location of the flaring region to be within in longitude of phase 0.63. This active region was found to be on the surface of the secondary star. Although a direct connection between this flaring event and the dark spot we find on the secondary component from our own light curve analysis is difficult to demonstrate, we note that their phase locations (0.63 and 0.59) are strikingly similar and are at least consistent with association.
The need for two spots to adequately reproduce the shape of the out-of-eclipse region around phase 0.65 seems justified from the discussion above. Subsequent inspection of the residuals from the fit, however, revealed the presence of residual systematic deviations near the first quadrature (0.25) that suggested the presence of yet another spot. Solutions with a second dark spot on the primary component indicated that the fit did in fact improve somewhat (total weighted sum of residuals squared of ), and gave a smaller spot with a radius of that transits the meridian at phase 0.25. Although the statistical significance of this additional spot on the primary is weaker, once again there is independent evidence from flaring activity that may support its reality. Bopp (1974) reported a series of flare events during late March 1971 and concluded that they originated from the surface of the primary star in a region centered around phase 0.22, very close to the location of the dark spot suggested by the light curves. Based on this we have retained the spots described above in all subsequent fits of the LS78 light curves. A graphical representation of the location of these surface features is presented later in §4.2, for comparison with the configuration seen 23 years earlier in the Kron (1952) observations.
As a final comment on the spot fitting procedure it should be pointed out that the fitting of the out-of-eclipse wave is, in a sense, an aesthetic exercise that does not really affect the physical and orbital properties of the YY Gem system in any significant way (changes are typically within 1). This partly explains the strong degeneracy between some of the spot parameters and the ambiguity as to which component the spot(s) are located on. The proper fitting of the branches of the minima (particularly at the secondary eclipse) is somewhat more important. But spot adjustment is not without the risk of over-interpreting the data. The spot distribution that we have finally adopted is supported to some extent by evidence from flare studies and provides excellent fits to the light curves. The solution is not unique, however, and other configurations may be equally valid from a strictly numerical point of view. In general, one should not expect a perfect fit to all the “bumps and wiggles” of the light curve because the spot model adopted is extremely simplified. It is obvious, even from observations of the Sun, that dark spots are neither homogeneous nor circular. Nevertheless, the surface features suggested by our analysis are interesting in themselves because of the complementary and near-simultaneous evidence reported by other investigators.
4.1.2 Photometric solutions including spots
For our final light curve solutions of YY Gem we adopted the three-spot model described above. The rms residuals from the fit were 0.013 mag, 0.011 mag, and 0.009 mag for the passbands, respectively, in very good agreement with the individual uncertainties quoted by LS78. The resulting best-fitting parameters are listed in Table 4. The uncertainties given in this table were not adopted from the (often underestimated) formal probable errors provided by the WD code, but instead from numerical simulations and other considerations. Several sets of starting parameters were tried in order to explore the full extent of the parameter space. In addition, the WD iterations were not stopped after a solution was found, but the program was kept running to test the stability of the solution and the geometry of the function near the minimum. The scatter in the resulting parameters from numerous additional solutions yielded estimated uncertainties that we consider to be more realistic, and are generally several times larger than the internal errors. The fitted light curves are shown in Figure 4, with the photometric residuals at the bottom. As mentioned earlier, both eclipses are partial and approximately 78% of the light of each star is blocked at the corresponding minimum.
As can be seen in Table 4, the star that is slightly more massive (photometric secondary) also appears to be slightly cooler. The physical significance of this result is marginal because the components are almost identical, and in fact evolutionary considerations would predict the opposite situation. The most plausible explanation for this has to do with the chromospheric activity of the components. Despite our best attempts to model the main surface features of YY Gem, in reality it may well be that the spot filling factor is such that there are no pristine areas of the photosphere. Large areas of unresolved spots on one star would make the photosphere appear darker (cooler) as a whole compared to the other star. A similar phenomenon may occur with plages. This is likely to change with time, one additional consequence being that the deeper eclipse at phase 0.0 in one epoch may become shallower than the other minimum at a different epoch. This has in fact been observed in YY Gem, e.g., as reported by Butler, Doyle & Budding (1996). In performing light curve solutions such situations would most likely be interpreted as a reversal in the surface brightness (or effective temperature) of the components.
Additional WD solutions were run to test the effect of other parameters not considered above. One of these is third light (), which could potentially be significant due to the proximity of YY Gem to the bright star Gem (combined , at an angular separation of ), if the background was not properly subtracted from the photometric observations. Solutions for in all three passbands were slow to converge due to the larger number of free parameters and the inherent difficulty in fitting for third light. The best fit was obtained for a fraction of third light of %, %, and %, for , respectively. Negative values can only result if the background measurements, rather than those of YY Gem itself, are contaminated by light from Castor, but this appears to be ruled out by indications by LS78 that they were very careful in making the sky readings. Furthermore, from the early A spectral type of Castor one would expect the contribution to be essentially “white” light, and given the magnitudes of YY Gem this corresponds to fractional contributions of 1.00 : 0.32 : 0.14 for , , and . Thus, our solution with free appears to be unphysical. Tests with fixed values of third light of 2%, 5%, and 10% in , scaled properly to the other bands, led to residuals from the fits that increased with increasing . We conclude that the best solution is obtained without third light contribution.
Tests were also run by including the eccentricity () and longitude of periastron () among the free parameters. The resulting values, and , are marginally significant. The value of (related to the separation between the primary and secondary minima) is essentially zero, indicating that the secondary eclipse lies exactly at phase 0.5 as seen earlier in §3. The term , related to the difference in width between the two eclipses, is found to be different from zero at the 2 level. Rather than being the result of an eccentric orbit, it is more likely that this is due to imperfections in the modeling of the star spots or small systematics in the observations themselves. The secondary eclipse would be the most affected. We conclude that the orbit is circular within the errors, in agreement with earlier evidence and with the expectation from theory for a system with a period a short as that of YY Gem.
Further tests were run to explore the sensitivity to changes in the adopted mass ratio and primary temperature (upon which the limb-darkening coefficients depend rather strongly). No perceptible changes were seen in the results, indicating in particular that possible inaccuracies in the Kurucz model atmosphere fluxes do not affect the fitted light curve despite the fact that the temperature regime at which we are operating is near the lower limit of the validity of those models. Finally, additional WD runs with a range of values for the bolometric albedo and the gravity-brightening coefficient indicated that the solution cannot be improved by adopting values different from those predicted by theory.
4.2. Fits to the light curve of Kron (1952)
As mentioned earlier, the photometry of YY Gem obtained by Kron (1952) is available for a single passband centered near the band. Because of the poorer quality of the measurements, their smaller number, and the narrow wavelength coverage, the parameters from this light curve are less reliable than those resulting from the analysis described above. Nevertheless, a re-analysis of this material allows us to compare with the physical properties of the stars inferred from the LS78 data, which we regard as an important check on the external accuracy of the radii. In addition, it enables us to study the activity level of the system at a different epoch.
The WD solutions described in the previous section were used as a starting point, with all parameter settings being identical to those used for the LS78 light curves except for the spot properties and the fixed value of . A systematic search was carried out to find a value for that yields a ratio of the radii of unity when fitting the light curve. Because of the intrinsic scatter of the photometric measurements, the surface potentials that lead to are not necessarily identical for the LS78 and Kron light curves. Indeed, we found that needed to be increased to a value of for the fit to yield components of identical radii.
Regarding the surface inhomogeneities, the shape of the Kron light curve suggests the presence of at least two major active regions, one centered at the phase of the secondary eclipse and another one near phase 0.8. WD fits considering only one dark spot proved to be unsatisfactory. Tests were run to attempt to establish on which star the active regions are located. The results were inconclusive, although a marginally better fit was obtained with both spot regions on the secondary component (as suggested also by Kron 1952 in his original analysis). The solution we adopted has two large spots with meridian transiting phases of 0.516 and 0.836, and radii of and , respectively. The sizes of these active regions are significantly larger than those found from the analysis of the light curves of LS78. This is not an unexpected result, since the activity wave in Kron’s light curve clearly has a greater amplitude, approaching 0.1 mag. This is shown in Figure 5, where the photometric effect of the surface features after subtracting out a light curve without spots is displayed for both epochs. Figure 6 shows the location of the spots on the surface of the stars, for comparison with the distribution at the epoch of the LS78 observations.
As before, the best-fitting spot parameters presented here represent only one of the possible configurations. Other combinations of spot locations and sizes may yield similarly good fits, but the physical properties of the components are essentially unaffected.
The observations along with the theoretical light curves are shown in Figure 7, and the resulting photometric parameters from the adjustments are listed in Table 4. The rms residual of the fit was found to be 0.020 mag, and the diagram shows no significant systematic trends, indicating that the shape of the out-of-eclipse variation has been sufficiently well modeled (to the extent permitted by the photometric accuracy and the model assumptions). As can be seen, the agreement between the orbital and stellar properties derived from the analysis of the two light curve sets (Kron and LS78) is very good. Both the inclination angle and the mean fractional radius, the two key geometric parameters, are found to be identical at the 1 level. The only slightly discrepant property is the temperature of the secondary star, which appears to be marginally greater than that of the primary component from the analysis of Kron’s observations. This is an interesting result providing an illustration of our previous argument that changes in the distribution of the spots related to the activity can produce noticeable differences in the apparent effective temperatures of the components. In this case, the temperature derived for the secondary (more massive) component is consistent with what is expected from the mass-luminosity relation.
5. Absolute dimensions
For the final geometric properties of YY Gem we have adopted the weighted average of our determinations from the light curves of Kron and LS78. A comparison with the original solutions by those authors reveals small differences both in the mean radius and in the inclination angle. Our value for the mean relative radius () is % larger than that of Kron, and our inclination angle () is about smaller than his555We note that Kron’s (1952) original analysis was based on a combination of his visual and infrared data, whereas our results use only the visual observations., while the differences with LS78 are % and , respectively.
The absolute masses and radii of the components of YY Gem, along with other physical parameters, follow from the spectroscopic results in Table 2 along with the photometric solutions in Table 4. While the absolute masses we derive for the two stars are formally different ( M☉ and M☉), the difference is statistically insignificant. Similarly, the radii of the components are so close that the observations are unable to distinguish their ratio from a value of unity. The departure from a perfectly spherical shape is also very small. Consistent with the equal masses and radii, the difference in the effective temperatures (a quantity usually best determined from the light curves) is so small that it is completely masked by the unavoidable distortions in the photometry due to spots, as described earlier. For all practical purposes the two stars are therefore virtually identical in all their properties. Accordingly, the physical quantities listed in Table 5 are the average of the formal results for the two components.
The absolute value of the effective temperature for eclipsing binaries is generally based on photometric calibrations external to the light curves. For cool stars such as YY Gem this has always been problematic. Few dwarfs with truly fundamental temperature determinations are available, and many of the calibrations actually rely on the photometric properties of giants for this temperature regime, or even on a blackbody approximation. Others based on the infrared flux method are model-dependent to some extent. Significant advances have been made in recent years in the modeling of the photospheres of M dwarfs, used to compute synthetic colors (e.g., Hauschildt, Allard & Baron 1999), and efforts to establish a temperature scale for these stars have improved the situation considerably (see, e.g., Kirkpatrick et al. 1993; Leggett et al. 1996; Bessell, Castelli & Plez 1998; Krawchuk, Dawson & De Robertis 2000). Nevertheless, some discrepancies still remain between calculated colors and observed colors (see Baraffe et al. 1998). For the present work we have relied mostly on empirical calibrations available for a number of different color indices. YY Gem has been well observed photometrically from the ultraviolet to the infrared, in a variety of systems. These measurements have been transformed to a uniform system following Leggett (1992), averaged, and collected in Table Absolute dimensions of the M-type eclipsing binary YY Geminorum (Castor C): a challenge to evolutionary models in the lower main-sequence11affiliation: Some of the observations reported here were obtained with the Multiple Mirror Telescope, a joint facility of the Smithsonian Institution and the University of Arizona.. The calibration used for each index is also indicated in the table. In addition, Bopp, Gehrz & Hackwell (1974) extended the infrared observations to 10 m, and obtained another estimate of from the spectral energy distribution (SED) of the star. There is good agreement between all of these estimates. However, the formal error of the average, K, does not reflect systematic errors that may be present in the calibrations. These are rather difficult to quantify, and we have thus adopted a more realistic value of K for both components. This is the temperature we have used consistently for our spectroscopic and photometric analyses.
Table 5 also lists the average that we measure for the stars in YY Gem, which is very close to the value expected for synchronous rotation () given the very short period of the system. We note also that the spot distortions in the LS78 light curves are seen to occur at the same phases from cycle to cycle on consecutive nights, again consistent with synchronous rotation (assuming the spots are fixed on the stellar surface). The luminosity and absolute bolometric magnitudes are given in Table 5 as well, based on the effective temperature and radius. Because of the uncertainty in the bolometric corrections (BC) for cool stars, the mean absolute visual magnitude, , is more accurately determined in this case from the apparent visual magnitude of the system and the Hipparcos parallax (corrected as described in the Appendix). This value of along with the radius, in turn, provides a check on the temperature for an adopted table of bolometric corrections. Using the BC scale by Flower (1996), we obtain consistency with the radius and for a temperature of 3840 K and BC . This temperature is only 20 K higher than our mean estimate from color indices. On the other hand, if we adhere to our temperature of 3820 K, the bolometric correction required by the observations (radius, ) is BC , whereas the value from Flower (1996) for this temperature is BC .
Consistent with the poorly-determined difference in the temperatures of the components of YY Gem, the luminosity ratio in the visual band is also rather uncertain. The three values for derived in this paper are all different: (Kron light curve), (LS78 light curve), and (spectroscopy; §2). This is most likely another manifestation of the activity of the stars, and under these circumstances the safest assumption is that they are equally bright.
5.1. Evaluation of systematic errors in the masses
The paucity of good mass and radius determinations in the lower main sequence makes it especially important to examine these estimates critically to ensure that they are as free as possible from systematic errors, which could compromise the comparison with theoretical models. This is particularly true for the mass, which is the most fundamental of all the stellar properties. The uncertainties given above for our mass determinations (0.8%) are strictly internal errors. Even though we have made every effort to minimize systematics in our radial velocity measurements, residual errors affecting the accuracy are bound to remain at some level.
One example of such errors is due to the spots present on one or both stars. Distortions in the spectral lines produced as spots transit the visible disk of a star can cause noticeable changes in the measured Doppler shifts. In Figure 8 we show the effect that the spots had on the radial velocities at the epoch of the photometric observations by Kron (1952) and by LS78, as computed with the WD code based on the light curve fits in §4.1 and §4.2. The magnitude of the perturbation in the velocities is relatively small, and it is unclear whether the velocities we have measured here by cross-correlation are affected by the full amplitude of these corrections, but presumably they could be biased to some extent. As a test we have applied these corrections to our measured velocities to estimate the impact on the mass determinations. The primary and secondary masses change by up to 0.2%, which is smaller than our internal errors.
The very recent study by S00 provides a valuable opportunity to test the external accuracy of the mass determinations for YY Gem, given that both studies have formal errors under 1%. S00 obtained 37 spectroscopic observations of the binary with good phase coverage, and solved for the orbital elements by an elegant method that uses the correlation profiles directly, instead of deriving radial velocities in the standard way, as we have done. Those authors pointed out that their technique greatly reduces the effective number of free parameters of the least-squares adjustment, and results in a significant improvement in the accuracy of the orbital elements (although, strictly speaking, we believe they were probably referring to the precision of the elements). Their published masses are M☉ and M☉ for the photometric primary and secondary, respectively, which are approximately 0.9% and 1.0% larger than ours. These differences are not much larger than our formal errors, and in principle they suggest good agreement. The uncertainties reported by S00, on the other hand, are 0.2%. At this level, the variety of systematic effects that can find their way into the mass estimates is enough of a concern that we believe such a small error may be too optimistic for this system.
During the refereeing process for this paper a number of issues regarding the S00 results emerged that are relevant for our discussion of systematic errors in the masses. For example, we learned that their current best fit to the observations that includes an iterative correction for the effect of the sidelobes of the correlation function (not accounted for in their original analysis) gives masses that are slightly but noticeably larger than the results they reported earlier. The nature of this effect is analogous to the bias that we described in §2, and which we addressed for our own data by using TODCOR coupled with numerical simulations. The new values they obtain, which supersede the original results, are M☉ and M☉ (Forveille 2001, priv. comm.). These represent an increase of 0.8% and 0.7% over the published masses, or approximately 4 in terms of the internal errors. The updated S00 masses are 1.7% larger than ours, a 2 difference. Subtle effects such as this illustrate the great care required to avoid potentially significant systematic errors at the 1% level.
Another example is the well-known Rossiter effect666This effect is caused when the star that is in front partially occults the approaching or receding limb of its companion. This results in a loss of symmetry so that the Doppler shift of the star behind, when integrated over the visible part of its disk, no longer corresponds to its center-of-mass velocity. (Rossiter 1924; McLaughlin 1924), which affects the line profiles in spectra obtained during eclipse. For YY Gem the distortion in the measured radial velocity can amount to 6 km s-1. Such observations are best avoided, as we have done here, unless the distortions are explicitly included in the modeling of the velocity curves. A handful of the observations used by S00 do indeed fall within the eclipse phases. However, the analysis technique they use, which bypasses the velocities altogether, is apparently immune to this effect, at least in the case of YY Gem (Forveille 2001, priv. comm.).
As shown above, the effect of the spots on the mass determinations is at the level of the uncertainties quoted by S00. By coincidence, though, their observations are virtually simultaneous with ours so that the surface features are not likely to affect the difference between our mass determinations and theirs. But they cannot be completely ignored as a potential source of systematic errors in the absolute masses at the 0.2% level.
Finally, it is worth pointing out that for the highest accuracy in mass determinations, even an issue as trivial as the numerical constant in the classical formula for the masses of a spectroscopic binary cannot be overlooked777The relevant quantity in this constant is the product between the Newtonian gravitational constant () and the mass of the Sun (), referred to as the “Heliocentric gravitational constant”. We note that and occur only as a product in the modeling of solar system dynamics, and do not appear separately. The value of adopted in this paper is that recommended by the IAU (e.g., The Astronomical Almanac 2002; see also Standish 1995), and leads to a numerical constant in the formula for the masses of , when the period is expressed in days and the velocity semi-amplitudes are given in.. The difference between the value we have adopted (; see footnote) and the time-honored value (e.g., Batten, Fletcher & MacCarthy 1989) is once again at the 0.2% level. A slight inconsistency we noticed between the velocity semi-amplitudes published for YY Gem by S00 ( and in their Table 2) and the absolute masses they reported (Table 3) originally led us to suspect a problem of a similar nature. As it turns out, however, the numerical constant they used is nearly identical to ours, and the explanation for the inconsistency is even more trivial888Due to a clerical error, the orbital elements reported in Table 2 by S00 actually correspond to an earlier orbit that was adjusted to radial velocities, rather than to the full correlation profiles (Forveille 2001, priv. comm.). The mass values in their Table 3, on the other hand, do correspond to the final orbit from their original analysis. The semi-amplitudes that were used to compute the updated masses given above (including sidelobe corrections) are and ..
The message we wish to convey to the reader with the arguments presented in this section is the difficulty in reaching accuracies (as opposed to a precision) in the absolute masses much better than 1% for a system with the characteristics of YY Gem. It is entirely possible that some of the astrophysical effects mentioned above, such as spottedness, may ultimately set the limit for stars of this class.
6. Discussion
The considerable importance of the YY Gem system is illustrated by the fact that, over the last three decades, it has been used on numerous occasions together with CM Dra to help establish the empirical mass-luminosity (M-L) relation and the absolute calibration of the temperature scale for M-type stars. Because they are eclipsing (and hence the radii are directly measurable), these two systems have provided by far the strongest constraints on models of stellar structure and evolution in the lower main sequence. For the most part, recent comparisons have concluded that there is reasonably good agreement between the models and the observations (see, e.g., Chabrier & Baraffe 1995; Luhman & Rieke 1998; Palla & Stahler 2001). The number of model calculations reaching down to the mass of YY Gem that have become available and are in current use is large enough, however, that the situation has become rather complex. Statements regarding the consistency of a particular set of models with the observations are not necessarily true for others, given that they all make different assumptions regarding issues such as convection, the equation of state, boundary conditions, the helium abundance, etc. Many of these calculations are intended specifically for the pre-main sequence phase. With our new and improved determinations for the mass, radius and temperature of YY Gem we have taken the opportunity to revisit this in more detail. We have considered essentially all of the models that are most often used in the current literature for chemical compositions near solar, and we compare them not only with YY Gem but also against each other.
6.1. Comparison with stellar evolution models
The mass of the mean component of YY Gem is conveniently very nearly equal to 0.6 M☉, which is one of the mass values tabulated in all model calculations. In addition, as we show below, the metallicity of YY Gem is probably not far from the solar value, also the standard reference point for abundances. Figure 9 displays evolutionary tracks for this mass in the vs. diagram from seven different model calculations for solar composition, along with our determinations from Table 5. The vertical section of the curves corresponds to the contraction phase prior to the main sequence. At first glance several of the tracks appear consistent with the observations, within the error bars. We note, however, that they span a broad range in effective temperature, and there are also important displacements in the vertical direction. The latter have a significant impact on the age deduced for the object from a diagram such as Figure 9, since isochrones in this plane are roughly perpendicular to the tracks, sloping only slightly from the upper right to the lower left. The triangles on each of the tracks indicate the locus for an age of 100 Myr, for reference. If one were to use these models and the associated isochrones to estimate the age of YY Gem, much in the way this is commonly done in the H-R diagram, the results would range from 30 Myr to 85 Myr, with most of the values falling in the 30–50 Myr range. Laying aside for the moment the disagreement in the mass, one would conclude that the system is very young, and that it is perhaps still in the pre-main sequence phase. This possibility has in fact been advanced by Chabrier & Baraffe (1995), who pointed out that a star of this mass takes approximately 300 Myr to reach the main sequence, according to their calculations. As we show below, however, the age of this system is almost certainly considerably larger than the isochrones seem to indicate, which points to a rather serious discrepancy in all the models.
The discrepancies between the different models can be traced in most cases to the physical assumptions, as mentioned earlier, but these assumptions come in such a bewildering variety of combinations that it is often difficult or impossible for the typical user to choose the most realistic set of calculations for all applications. In recent years the models by Baraffe et al. (1998) have emerged as one of the most commonly used in this mass regime. Compared to other calculations, they incorporate a more sophisticated treatment of the boundary conditions for the interior equations based on the “NextGen” model atmospheres by Hauschildt, Allard & Baron (1999), which has been found to have a significant effect on the temperature profile for cool stars. The evolutionary tracks by Siess, Forestini & Dougados (1997) also use a non-grey approximation for the boundary conditions, based on analytical fits to the model atmospheres by Plez (1992) for cool stars. Nevertheless, even these two sets of calculations show important differences, as seen in Figure 9, and predict ages for YY Gem that differ by almost a factor of two.
The comparison in the vs. plane makes use of three observable quantities: the mass, the radius, and the effective temperature. Though important, these are insufficient for critical tests of stellar evolution theory in the sense defined by Andersen (1991), i.e., tests that allow one to rule out at least some of the calculations. This is because there are still several free parameters left in the models that can be adjusted to improve the fit, most notably the age and metallicity. Furthermore, for YY Gem we do not have the added constraint that both components in the binary must fit the same isochrone, because the stars are virtually identical and reduce to a single point for all practical purposes.
In this particular case, however, the fact that YY Gem is a companion to Castor A and B, altogether forming a sextuple system, gives additional information that we use in the next section to provide much tighter constraints on the models. Not only can we estimate the metallicity of the system, but also the age, which is not normally one of the known parameters in other binaries. Isochrone fits to Castor A and B using a number of current models give an age of roughly 370 Myr and a heavy element abundance of approximately (very nearly the same as the solar abundance). These estimates are supported by other analyses in the literature and an independent spectroscopic study. Details of these important determinations and a more complete description of the Castor system, including the evidence that its components are physically bound, are given in Appendix A.
6.2. A more stringent comparison with the models
With the mass, radius, temperature, absolute visual magnitude, and now also the metallicity and age of YY Gem known to various degrees of accuracy, a far more demanding test of stellar evolution models can be carried out that is usually not possible for other eclipsing binaries in the general field and is probably unique among the low-mass stars. In this section we have considered nine different sets of theoretical calculations that include essentially all of the models that are most often used or that are available for the mass regime of YY Gem: Swenson et al. (1994), D’Antona & Mazzitelli (1997), Siess et al. (1997) (see also Siess, Dufour & Forestini 2000), Baraffe et al. (1998) (Lyon group), Palla & Stahler (1999), Charbonnel et al. (1999) (Geneva group), Girardi et al. (2000) (Padova group), Yi et al. (2001) (Yale-Yonsei collaboration), and Bergbusch & VandenBerg (2001)999A preliminary extension of these models to metallicities higher than [Fe/H] was kindly provided to us by P. Bergbusch (2001, priv. comm.).. Whenever possible we have interpolated isochrones from all of these models for an age of 370 Myr and , as determined from the fits to Castor mentioned above. For the Palla & Stahler (1999) models the heavy element abundance is solar and the oldest age available is 100 Myr, but these limitations do not affect the isochrones for YY Gem or our conclusions significantly.
A detailed comparison of the physical and numerical assumptions of each set of calculations is beyond the scope of this paper. Some of these models do not focus specifically on the lower main-sequence although they do nominally reach small masses, and thus they may be expected to be less successful in reproducing the observed properties of these stars. As mentioned earlier, the models by Siess et al. (1997) and Baraffe et al. (1998) implement a more sophisticated treatment of the boundary conditions for cool stars through the use of non-grey model atmospheres, and also use a more elaborate equation of state that includes non-ideal effects such as pressure ionization and Coulomb shielding. Because of this they might be expected to give a more realistic representation of the real properties of low-mass stars. Thus, we have considered these two models separately in the comparison with the observations.
Figure 10 shows this comparison on different planes, for all low-mass models except the two mentioned above. The mass is the best determined of the four observable quantities (, , , and ), followed by the radius. These two are of a more fundamental nature than the temperature, since they do not depend on external calibrations. Thus we begin by considering the mass as the independent variable.
The mass-radius diagram in Figure 10a clearly shows that all models underestimate the radius, by as much as 15% in some cases. The Swenson model comes closer to reproducing the observed radius (5% difference), although the discrepancy actually corresponds to more than 5.
In Figure 10b most of the models are seen to predict temperatures that are too hot for the mass of YY Gem, whereas the Swenson et al. (1994) isochrone shows good agreement with the observations. The overall spread in the predicted temperatures in this diagram, for a mass equal to that of YY Gem, is nearly 200 K (5%). Theoretical calculations start to diverge towards lower temperatures, where most of the assumptions become more critical and begin to break down.
Figure 10c shows the familiar M-L relation. The models that fare the best are those by D’Antona & Mazzitelli (1997) and Swenson et al. (1994). All the others appear to overestimate the flux in the visual band by up to 0.6 mag, probably as a consequence of differences in the opacities and other physical assumptions.
Finally, the H-R diagram in the bottom panel suggests that all models overestimate the temperature at the absolute magnitude of YY Gem, with the one exception once again of the Swenson et al. (1994) isochrone, which appears to provide an excellent fit. However, the better agreement in this case, as in Figure 10b and Figure 10c, is not necessarily an indication of more sound physical assumptions. In fact, the equation of state adopted in this model, which relies on the tabulation by Eggleton, Faulkner & Flannery (1973), is rather simple by today’s standards, and, in addition, the boundary conditions are treated within the grey approximation. In retrospect, Figure 10 shows that this model tends to stand out compared to all the others, in all four planes. The same is seen in Figure 9.
Among the eclipsing binaries with well-determined component masses under 1 M☉, UV Psc (HD 7700) and V818 Tau (HD 27130) have secondaries that are only slightly more massive than YY Gem, and might serve to confirm the trends seen in Figure 10. Both have M☉. UV Psc is apparently an old and somewhat evolved object (see Popper 1997) of unknown metallicity and is therefore not as useful here. On the other hand V818 Tau is a member of the Hyades cluster, which happens to have a composition ([Fe/H]; Boesgaard & Friel 1990) not far from what we have estimated for Castor. The well-known age (600 Myr) is somewhat older than that of YY Gem, but this difference has a negligible effect on the properties of stars of this mass. By combining the light-curve solutions for V818 Tau by Schiller & Milone (1987) with the spectroscopic analysis of that system by Peterson & Solensky (1988) we obtain the absolute dimensions listed in Table 7. The effective temperatures are based on the light curve results by Schiller & Milone (1987), their derived color indices in several passbands, and the same color-temperature calibrations used for YY Gem in Table Absolute dimensions of the M-type eclipsing binary YY Geminorum (Castor C): a challenge to evolutionary models in the lower main-sequence11affiliation: Some of the observations reported here were obtained with the Multiple Mirror Telescope, a joint facility of the Smithsonian Institution and the University of Arizona.. For the absolute visual magnitude we have adopted the Hipparcos parallax of the star.
In Figure 11 we show the observations for YY Gem and also V818 Tau B, along with the isochrones by Siess et al. (1997) and by Baraffe et al. (1998). Models for the exact composition of V818 Tau B, which is slightly higher than solar, show only a very small difference in these diagrams, and have no effect on the conclusions.
Figure 11a indicates, as before, that the predicted radii are too small, by 10% for Baraffe et al. (1998) and nearly 20% for Siess et al. (1997). This represents more than 10 and 20 times the uncertainty in the measure radii, and is therefore highly significant. The explanation for the age discrepancy pointed out in reference to Figure 9 is now obvious: YY Gem appears too large compared to predictions, and the models therefore require it to be at an earlier stage of evolution, still contracting towards the main sequence101010A much later stage of evolution (post-main-sequence) is also able to match the observed radius, but only at an age of several tens of Gyr that is totally inconsistent with the main-sequence status of Castor A and B. Also, the predicted temperature for YY Gem would be some 500 K hotter than observed..
The agreement between the two isochrones themselves in the -mass plane (Figure 11b), the mass-luminosity diagram (Figure 11c), and the H-R diagram (Figure 11d) is moderately good except at the low-mass end. From the first and third of these, however, it would appear that, although the slope of the models seems correct, both isochrones tend to overestimate the effective temperature by roughly 150 K at a constant mass or a constant , if the empirical color-temperature calibrations are to be relied upon. For each star the discrepancy is admittedly only at the level of 1-1.5, but the fact that it is in the same direction for both is suggestive, and may become more significant if additional systems in this mass regime confirm the trend. The modest match between the observations and the theoretical mass-luminosity relation in Figure 11c is similar to that found in the visual band by Delfosse et al. (2000) from a larger sample of astrometric binaries, and may indicate that the model luminosities are somewhat overestimated, as mentioned earlier. Those authors also showed that the agreement in the passbands tends to be better.
The discrepancy in the radii for main-sequence stars below 1 M☉ has occasionally been pointed out before in the literature (e.g., Chabrier & Baraffe 1995; Lastennet et al. 1999) but its importance has often been downplayed because of the additional degrees of freedom in the models (mainly age and metallicity) or the low precision of the observations. Both of these shortcomings are removed in the present paper so that the disagreement is now more obvious. The problem was expressed in terms of ages by Popper (1997), who noticed that the secondary stars in eclipsing binaries in the 0.7-1.1 M☉ range with components differing appreciably in mass and radius appear systematically older than their primaries by factors of two or more. Clausen et al. (1999) added more data and reinterpreted the deviations in terms of the radii, as we have done here.
This result emphasizes the importance of having the radii as a sensitive indicator of evolution, and the need for the stellar evolution models to satisfy all observational constraints simultaneously in order to pass the test. As we see in the system discussed here, the temperature and radius discrepancies tend to cancel each other out to some degree and lead to luminosities that are not too far off, at least compared to some models. So, for example, if only the mass-luminosity diagram is considered (Figure 11c, or Fig. 3 by Delfosse et al. 2000), one might be led to believe that the agreement is perhaps satisfactory within the errors and that no action is required on the theoretical side to improve the fit. Unfortunately this is very often the situation for the lower main-sequence, largely because of a lack of other observational data (particularly radius or surface gravity determinations). The perception in the community that all is well because the fit to the M-L relation is tolerably good, within observational errors, is not uncommon. In YY Gem the discriminating power of the mass, radius, and temperature determinations is further enhanced by the fact that the metallicity and even the age can be estimated independently, which makes the test much more demanding. A common practice in the field of star formation to estimate absolute ages and masses for T Tauri stars is to place the objects on the H-R diagram, if the distance is known. In the particular case of YY Gem or V818 Tau this procedure leads to masses that are not far off from their true values because the evolutionary tracks happen to be mostly horizontal so that the temperature errors have little effect. The ages, however, are still underestimated by factors of 5 and 10, respectively, which highlights the limitations of this popular analysis tool for low-mass stars.
Another issue that we view as equally important is the need to test more than one set of models, given the fact that the assumptions are so varied that all models are different. This is the motivation for our efforts to collect and compare a large number of the most often used theoretical calculations from the recent literature (nine) for the mass regime of YY Gem. Figures 10 and 11 show that all models fail this very strict comparison with YY Gem, even the ones considered to be more realistic. Furthermore, this conclusion is supported by a second object of nearly the same metallicity (V818 Tau) with similarly good determinations of , , and . Thus, it is clear that the physics of low-mass stars is not as well understood as one may gather from some recent claims.
The reason for the failure of the models to reproduce the radii (and temperature) of stars of this mass is not easy to pinpoint. One obvious candidate is the treatment of convection. Most models use the standard mixing-length prescription (Böhm-Vitense 1958) with a mixing length parameter in the range 1.5-2.0, close to that required for the Sun. As pointed out by Chabrier & Baraffe (1995) this parameter can have a significant effect in stars like YY Gem, which develop radiative cores extending more than 70% in radius. Compared to other calculations their models use a considerably lower value of , yet an even smaller value would be required to fit the observed radius, which they view as unrealistic. In addition, much lower values of appear to disagree with results from recent hydrodynamical calculations (Freytag, Ludwig & Steffen 1999). An alternative scheme for convection is the “Full Spectrum of Turbulence” prescription (Canuto & Mazzitelli 1991). Of all the models tested here it has been implemented only in the D’Antona & Mazzitelli (1997) calculations, and tends to predict higher temperatures than the standard theory. The equation of state, which largely determines the mechanical structure of stars in the low-mass regime, may also be in need of improvement. Very recent work by Mullan & MacDonald (2000) even explores the effect of magnetic fields on the structure of low-mass stars. Their models show that calculations that do not incorporate magnetic fields tend to predict radii that are too small and effective temperatures that are too high, exactly as seen above for YY Gem. Though this finding is very encouraging, most likely the observed discrepancies with the observations in this mass range will turn out to be due to a combination of several model ingredients. A careful investigation of lower-mass systems such as CM Dra would probably shed some light on these issues, since convection becomes less important for smaller stars while the denser structure and cooler temperatures should highlight possible deficiencies in the equation of state.
The interesting question of whether or not YY Gem has already reached the Zero Age Main Sequence (ZAMS), raised earlier, is more complicated to answer than would appear. According to Chabrier & Baraffe (1995) a 0.6 M☉ star of solar metallicity arrives on the main sequence at an age of 300 Myr. Palla & Stahler (1999), on the other hand, give an age of only 85 Myr. The ZAMS computed by Siess et al. (2000) that does not include convective core overshooting suggests that the age for this mass is much older (600 Myr). When overshooting is accounted for, their models give an even older age of 1 Gyr. A closer investigation reveals that the definitions adopted for the ZAMS by each group, which are arbitrary to some extent, are not the same. For example, Palla & Stahler (1999) defined the ZAMS to be the point where the luminosity released through gravitational contraction falls to 3% of the total. Siess et al. (2000) define it as the point when 0.1% of the central hydrogen mass fraction has been burnt (Siess 2001, priv. comm.). If a definition similar to that by Palla & Stahler based on the fraction of gravitational energy is adopted for the Siess models that include overshooting, the result is 100 Myr. The ZAMS is thus not a very clearly defined concept, or at least there seems to be no consensus on a practical definition. This, along with the discrepancies noted above in the comparison with the observations, makes it virtually impossible to decide on the exact evolutionary status of YY Gem.
7. Final remarks
The lower main sequence is one of the areas of the H-R diagram where stellar evolution models are least constrained by the observations. YY Gem (along with CM Dra) remains one of the key systems in this mass regime. Our new spectroscopic observations have yielded masses for the virtually identical components good to better than 1%, differing by 2 (1.7%) from another recent determination by S00 (updated as reported in §5.1) with formal errors also under 1%. Our emphasis in this paper has been on understanding the systematic errors, perhaps the most insidious component of the total uncertainty at this level of precision.
A re-analysis of existing light curves with more sophisticated techniques than available at the time of the original studies has allowed us to derive the radius of the mean component to a precision also better than 1%, nearly a factor of 4 improvement over the value listed in the compilation by Andersen (1991). The radius is one of the crucial stellar properties because of its sensitivity to evolution. The difference with the original determinations is 1-2%, but the errors are now much better characterized.
To strengthen the comparison with the models we have made use of the fact that YY Gem is a member of the Castor sextuple system. The assumption of a common origin, and therefore of a common age (370 Myr) and metal abundance () provides important constraints that are not normally available in other eclipsing binaries. The observations for YY Gem show quite convincingly that all current stellar evolution models underestimate the radius of stars of this mass by up to 20%, and also that they tend to overestimate the temperature. A remarkably similar trend seen for V818 Tau, another well-observed eclipsing binary in which the secondary is only slightly more massive, makes these results even more compelling. As a direct consequence of the radius problem, ages for stars of these characteristics are underestimated by factors of 4 to 10, depending on the model.
This discrepancy is a matter of some concern, given that many of these models are commonly used to estimate absolute ages for young open clusters, or even to date individual T Tauri stars in the H-R diagram. It is possible that offsets in temperature and radii cancel each other out to some extent in the classical H-R diagram or in the mass-luminosity diagram for certain mass regimes, but we believe that such ages must still be viewed with suspicion. It may well be that for ages much younger than that of YY Gem the deviations are not as important, but until this is shown to be the case, caution is advised.
The theory of stellar evolution in the lower main-sequence has made great strides in the last decade or so, and our current state of knowledge represents quite a significant achievement given the complexity of the physics. But it is clear that adjustments are still needed, and despite the impression one may receive from some studies in the recent literature that focus only on the H-R diagram or the M-L diagram, the ability to reproduce all of the observations simultaneously is nowhere near that of the models for higher-mass stars, where suitable eclipsing binaries are much more numerous and provide greater constraints. In fact, our use of the latter models to set the age and metallicity of Castor gives the tests described in this paper for YY Gem a differential character, in a sense. To the extent that we trust the higher-mass models, the comparison with the observations highlights the deficiencies in the theory of low-mass stars.
Favorable systems for critical tests of the models are unfortunately still very few in this mass regime, but thanks to the efforts by Popper (1996) and others, good progress is being made in the identification of additional candidates (see, e.g., Clausen et al. 1999). Follow-up spectroscopic and photometric studies of these objects should contribute greatly to the advancement in this field.
Appendix A Appendix: Castor as a sextuple system
We describe here the details of the determination of the age and the heavy element abundance of Castor. These are two of the key properties that we use in §6.2 to further constrain stellar evolution models for YY Gem, by virtue of the physical association (also discussed below) of the eclipsing system with the two brighter stars.
As mentioned in §1, both Castor A and Castor B are single-lined spectroscopic binaries so that the secondary components do not contribute any significant light and the photometry of each system corresponds to that of the primaries. Their position in the H-R diagram ( or , and ) may therefore be used to estimate their physical properties by comparison with theoretical calculations.
The Castor AB system was observed and resolved by the ESA astrometry mission Hipparcos. The Double and Multiple Systems Annex to the Hipparcos catalog (ESA 1997) lists magnitudes of and for Castor A and B, respectively, along with a trigonometric parallax of mas. These are the main ingredients needed to compute the luminosities of the stars. In deriving these parameters Castor A and Castor B were assumed to have the same parallax (a valid assumption), but they were also assumed to have a common proper motion, which is not necessarily true due to the orbital motion of the pair. In fact, according to the elements by Heintz (1988) the relative motion over the 3-year interval in which the object was observed by Hipparcos is 345 mas, a non-negligible amount given the typical precision of 1 mas for the satellite measurements. The parallax is thus suspect, and the magnitudes may be affected as well. To remedy this situation we have re-reduced the Hipparcos transit data accounting for the orbital motion of the visual binary. The relative motion predicted by Heintz’s orbit over the interval of observation is essentially linear: the deviation from a linear trajectory is only 1 mas in Right Ascension and 0.5 mas in Declination. For all practical purposes, therefore, it is sufficient to allow the two stars to have a different proper motion in the new solution. The parallax resulting from this new fit is mas, with an error only half as large as before. The difference with the old value represents a change of 2.6 (3.6 mas). We discuss the implication of this below.
The magnitudes also change slightly in our new fit. The new values are and for Castor A and B, respectively. We transformed these to standard Johnson magnitudes by making use of Table 1.3.5 of the Hipparcos catalog Volume 1 (Introduction and Guide to the Data). This table provides differences between and as a function of (in the Cousins system). Unfortunately, no individual measurements of this color index are available for the components of Castor. To circumvent the problem, we used the spectral type of the components as a first approximation and then checked for consistency with the final set of temperatures and color indices. The most recent and thorough spectral classification of the individual components of Castor is that of Edwards (1976). He classified Castor A as A1 V and Castor B as A5 Vm (note that the combined system was assigned a spectral type of A2 Vm, which has been a source of some confusion in later references and even in the SIMBAD database). Following the calibration by Bessell (1979), these spectral types translate into and for Castor A and B, respectively. The transformed magnitudes with estimated uncertainties are therefore and .
The trigonometric parallax of Castor has been measured from the ground numerous times prior to the Hipparcos mission. The most recent compilation of ground-based values (Yale Catalogue; van Altena, Lee & Hoffleit 1995) lists 16 entries, but does not distinguish which are for Castor itself and which are for YY Gem, and simply averages all determinations. The matter of the physical association between the eclipsing binary and the two bright stars is of considerable interest here because of our assumption that they have a common physical origin. As it turns out, this is actually corroborated by other evidence, as described in more detail below. Referring back to the original sources for the trigonometric parallaxes we find that 6 of the measurements are for YY Gem, and the remainder are for Castor A, Castor B, or their average. The weighted means for YY Gem and for Castor are statistically indistinguishable from each other, as well as from the average of all 16 measurements (which is mas). This, however, is significantly larger (by 3) than the value we determined above based on a re-analysis of the Hipparcos transit data ( mas). There is a rather large scatter among the individual measurements from the Yale Catalogue, which in the case of Castor is to be expected due to the brightness and close proximity of the visual pair. Recent studies of YY Gem by Ségransan et al. (2000) and Delfosse et al. (2000) have adopted the mean parallax from the Yale Catalogue. We have preferred to rely here on the more precise determination based on the Hipparcos mission, a choice that translates into a non-negligible difference in the distance modulus of mag, making the stars intrinsically brighter. With this, the absolute magnitudes for Castor A and B are and , respectively, in excellent agreement with the expected absolute magnitudes of dwarf stars of these spectral types (see Schmidt-Kaler 1982). Using bolometric corrections taken from the calibration by Flower (1996) the absolute luminosities are and .
An estimate of the effective temperatures can be obtained from the spectral type–luminosity class–temperature calibrations of de Jager & Nieuwenhuijzen (1987). This yields values of K and K for Castor A and B, respectively. An independent determination based on color indices would be valuable, but again, no individual color indices for the components are available in the literature. Only combined values of and have been published by Nicolet (1978), and by several earlier sources giving nearly identical results. Individual indices can be derived from the joint photometry if the luminosity ratio between the components at each passband is known. The luminosity ratio in the band, , follows directly from the difference in the apparent magnitudes: (secondary/primary). To estimate the luminosity ratios in the and passbands we made use of synthetic photometry computed from Kurucz ATLAS9 models normalized according to the luminosity ratio in , and adopting also effective temperatures of 9500 K and 8250 K, solar metallicity, and . Tests indicated a negligible dependence of the computed luminosity ratios on the adopted metallicity and . The ratios obtained were and , which lead to the following individual colors:
Effective temperatures for the components from the Johnson broad-band color indices were derived using several empirical calibrations: Popper (1980), Böhm-Vitense (1981), Schmidt-Kaler (1982), Flower (1996), and Bessell et al. (1998). An average of all determinations gives values of K and K for Castor A and B. These temperatures are in good agreement with the preliminary estimates from the spectral types, which ensures that the analysis described herein is fully self-consistent.
The metallicity and age of Castor may now be estimated by comparison with theoretical isochrones, a number of which are available for this mass regime. Isochrone fitting based on an observed luminosity and temperature for a given star, or even for two stars as in this case, does not generally give a unique answer. There are still several free parameters in the models that can be adjusted to produce equally good fits, such as the mixing length parameter, convective core overshooting, the helium abundance, etc. In practice, however, these parameters are fixed by the authors of the models to some particular value deemed to be reasonable, and so the result of the fit to the observations will depend to some extent on those assumptions. It will also depend on the particular calibration chosen for the conversion from color indices to effective temperatures, typically built into the published isochrone tables, and to a lesser degree on the scale of the bolometric corrections. To provide some sense for the range of ages and metallicity estimates () that one can obtain for Castor from isochrone fitting, Table Absolute dimensions of the M-type eclipsing binary YY Geminorum (Castor C): a challenge to evolutionary models in the lower main-sequence11affiliation: Some of the observations reported here were obtained with the Multiple Mirror Telescope, a joint facility of the Smithsonian Institution and the University of Arizona. collects our determinations based on five of the most commonly used models.
For several of them we list more than one determination, which illustrates the effect of a difference in the bolometric corrections adopted (“BC” heading in column 1). For the color/temperature conversion we rely on an average of various calibrations, as described above, and thus we compare theoretical and observational temperatures directly, without making use of the calibrations built into the isochrones. The effect of a difference in helium abundance () is tested using the models by Claret & Giménez (1998), which allow a choice for this parameter (in all other models is set by the enrichment law adopted). A lower helium abundance leads to an older age and a lower metal abundance.
The ages for the first four models in Table Absolute dimensions of the M-type eclipsing binary YY Geminorum (Castor C): a challenge to evolutionary models in the lower main-sequence11affiliation: Some of the observations reported here were obtained with the Multiple Mirror Telescope, a joint facility of the Smithsonian Institution and the University of Arizona. range from 333 Myr to 410 Myr, a representative value being 370 Myr. The models by Siess et al. (1997) consistently give somewhat younger ages (along with larger masses) because they do not account for convective core overshooting, which has the effect of prolonging the hydrogen-burning phase. A slightly lower value for the age ( Myr) was derived in a study by Barrado y Navascués (1998) on the basis of the kinematics of Castor as well as lithium abundances, isochrone fitting, and activity indicators for a number of putative members of the Castor moving group.
The metallicities in Table Absolute dimensions of the M-type eclipsing binary YY Geminorum (Castor C): a challenge to evolutionary models in the lower main-sequence11affiliation: Some of the observations reported here were obtained with the Multiple Mirror Telescope, a joint facility of the Smithsonian Institution and the University of Arizona. that best fit Castor are all seen to be quite near the solar value, for a range of values of . We adopt a representative abundance given by . Direct observational support for this is scarce. Despite its brightness, Castor has rarely been studied spectroscopically at high dispersion to determine the abundance because of the close separation of the visual pair. The work by Smith (1974) appears to be the only source available, and gives [Fe/H] (average for the two stars) relative to Vega, although with a large error. Twenty-one independent determinations of the metallicity of Vega are listed in the latest edition of the catalogue of [Fe/H] determinations by Cayrel de Strobel et al. (1997). The scatter is quite large, but the more recent values cluster around [Fe/H] . The observed metallicity of Castor relative to the Sun is therefore [Fe/H] , consistent with the results from our isochrone fitting.
Table Absolute dimensions of the M-type eclipsing binary YY Geminorum (Castor C): a challenge to evolutionary models in the lower main-sequence11affiliation: Some of the observations reported here were obtained with the Multiple Mirror Telescope, a joint facility of the Smithsonian Institution and the University of Arizona. includes also the mass and radius inferred for the visible components of Castor A and B (referred to as “Aa” and “Ba”) from the best-fitting isochrones. Three of the isochrones that also reach the lower main-sequence are shown in Figure 12, and agree by construction with the main components of Castor but show some differences for cooler temperatures. The observational point for YY Gem is also shown.
The physical association between Castor AB and YY Gem has been studied by Anosova, Orlov & Chernyshev (1989) and Anosova & Orlov (1991). They used all available kinematic information (positions, proper motions, radial velocities, and distances), and concluded that the total energy of the visual triple is negative, so that Castor A, B, and C are gravitationally bound to each other and most likely share a common origin. It is reasonable to assume, therefore, a common age and metallicity, which removes these degrees of freedom from the comparison between the observations for YY Gem and the models and provides for a much stronger test of theory.
It is interesting to note that the masses of all six components of the Castor multiple system can be inferred. Those of the two brighter stars (for which we adopt averages of M☉ and M☉; Table Absolute dimensions of the M-type eclipsing binary YY Geminorum (Castor C): a challenge to evolutionary models in the lower main-sequence11affiliation: Some of the observations reported here were obtained with the Multiple Mirror Telescope, a joint facility of the Smithsonian Institution and the University of Arizona.) depend upon stellar evolution models. From the orbital properties of the AB pair (, yr; Heintz 1988) combined with the revised Hipparcos parallax, the total mass of this system is 4.83 M☉. The fractional mass () by Heintz then leads to total masses for Castor A and B of 2.72 M☉ and 2.11 M☉, respectively. By subtraction, we obtain the masses of the unseen companions of the two bright stars (albeit with a rather large uncertainty) as M☉ and M☉. These are therefore also model-dependent. Because the spectroscopic orbits for the two close single-lined binaries are known, their mass functions ( M☉ and M☉, respectively; Vinter-Hansen 1940) allow one to estimate roughly what the inclination angles of both orbits are. A summary of the physical and orbital properties of the sextuple system is given in Table 9. Finally, the apparent separation between Castor AB and YY Gem translates into a projected linear separation of about 1060 AU, which implies a minimum orbital period of approximately yr for the observed total mass of the sextuple system of M☉.
References
- (1)
- (2) Adams, W. S., & Joy, A. H. 1920, PASP, 32, 158
- (3)
- (4) Agerer, F., & Hübscher, J. 1999, IBVS, 4711
- (5)
- (6) Andersen, J. 1991, A&A Rev., 3, 91
- (7)
- (8) Andersen, J. 1997, in Fundamental Stellar Properties: The Interaction between Observation and Theory, IAU Symp. 189, eds. T. R. Bedding, A. J. Booth & J. Davis (Dordrecht: Reidel), 99
- (9)
- (10) Anosova, J. P., Orlov, V. V., & Chernyshev, M. V. 1989, Sov. Astron. Let., 15, 237
- (11)
- (12) Anosova, J. P., & Orlov, V. V. 1991, A&A, 252, 123
- (13)
- (14) Arribas, S., & Martínez Roger, C. 1989, A&A, 215, 305
- (15)
- (16) Baraffe, I., Chabrier, G., Allard, F., & Hauschildt, P. H. 1998, A&A, 337, 403
- (17)
- (18) Baranne, A., Queloz, D., Mayor, M., Adrianzyk, G., Knispel, G., Kohler, D., Lacroix, D., Meunier, J.-P., Rimbaud, G., & Vin, A. 1996, A&A, 119, 373
- (19)
- (20) Barnes, T. G., Evans, D. S., & Moffett, T. J. 1978, MNRAS, 183, 285
- (21)
- (22) Barrado y Navascués, D. 1998, A&A, 339, 831
- (23)
- (24) Batten, A. H., Fletcher, J. M., & MacCarthy, D. G. 1989, Eighth Catalogue of the Orbital Elements of Spectroscopic Binary Systems, Publ. DAO Vol. XVII
- (25)
- (26) Bergbusch, P. A., & VandenBerg, D. A. 2001, ApJ, in press
- (27)
- (28) Bertelli, G., Bressan, A., Chiosi, C., Fagotto, F., & Nasi, E. 1994, A&AS, 106, 275
- (29)
- (30) Bessell, M. S. 1979, PASP, 91, 589
- (31)
- (32) Bessell, M. S., Castelli, F., & Plez, B. 1998, A&A, 333, 231
- (33)
- (34) Binnendijk, L. 1950, Bull. Astron. Inst. Netherlands, 11, 203
- (35)
- (36) Boesgaard, A. M., & Friel, E. D. 1990, ApJ, 351, 467
- (37)
- (38) Böhm-Vitense, E. 1958, Z. Astrophys., 46, 108
- (39)
- (40) Böhm-Vitense, E. 1981, Ann. Rev. Astron. Astrophys., 19, 295
- (41)
- (42) Bopp, B. W. 1974, ApJ, 193, 389
- (43)
- (44) Bopp, B. W., Gehrz, R. D., & Hackwell, J. A. 1974, PASP, 86, 989
- (45)
- (46) Braune, W., & Hübscher, J. 1979, BAV Mitt., 29
- (47)
- (48) Braune, W., & Hübscher, J. 1987, BAV Mitt., 46
- (49)
- (50) Braune, W., & Mundry, E. 1981, BAV Mitt., 32
- (51)
- (52) Braune, W., & Mundry, E. 1982, BAV Mitt., 34
- (53)
- (54) Budding, E. 1975, Tokyo Astron. Bull., 2nd Ser., 240, 2019
- (55)
- (56) Butler, C. J., Doyle, J. G., & Budding, E. 1996, in Cool Stars, Stellar Systems, and the Sun, ASP Conf. Ser., 109, eds. R. Pallavicini & K. Dupree (San Francisco: ASP), 589
- (57)
- (58) Canuto, V. M., & Mazzitelli, I. 1991, ApJ, 370, 295
- (59)
- (60) Cayrel de Strobel, G., Soubiran, C., Friel, E. D., Ralite, N., & François, P. 1997, A&AS, 124, 299
- (61)
- (62) Chabrier, G., & Baraffe, I. 1995, ApJ, 451, L29
- (63)
- (64) Chabrier, G., & Baraffe, I. 1997, A&A, 327, 1039
- (65)
- (66) Charbonnel, C., Däppen, W., Schaerer, D., Bernasconi, P. A., Maeder, A., Meynet, G., & Mowlavi, N. 1999, A&AS, 135, 405
- (67)
- (68) Claret, A. 2000, A&A, 359, 289
- (69)
- (70) Claret, A., & Giménez, A. 1998, A&AS, 133, 123
- (71)
- (72) Clausen, J. V., Baraffe, I., Claret, A., & VandenBerg, D. A. 1999, in Theory and Tests of Convection in Stellar Structure, ASP Conf. Ser., 173, eds. A. Giménez, E. F. Guinan & B. Montesinos (San Francisco: ASP), 265
- (73)
- (74) Clausen, J. V., Helt, B. E., & Olsen, E. H. 1999, in Theory and Tests of Convection in Stellar Structure, ASP Conf. Ser., 173, eds. A. Giménez, E. F. Guinan & B. Montesinos (San Francisco: ASP), 321
- (75)
- (76) D’Antona, F., & Mazzitelli, I. 1997, Mem. Soc. Astr. It., 68, 807
- (77)
- (78) Delfosse, X., Forveille, T., Mayor, M., Burnet, M., & Perrier, C. 1999, A&A, 341, L63
- (79)
- (80) Delfosse, X., Forveille, T., Ségransan, D., Beuzit, J.-L., Udry, S., Perrier, C., & Mayor, M. 2000, A&A, 364, 217
- (81)
- (82) Diethelm, R. 1972, BBSAG Bull., 3
- (83)
- (84) Diethelm, R. 1973a, BBSAG Bull., 8
- (85)
- (86) Diethelm, R. 1973b, BBSAG Bull., 9
- (87)
- (88) Diethelm, R. 1974, BBSAG Bull., 13
- (89)
- (90) Diethelm, R. 1975a, BBSAG Bull., 19
- (91)
- (92) Diethelm, R. 1975b, BBSAG Bull., 20
- (93)
- (94) Diethelm, R. 1975c, BBSAG Bull., 21
- (95)
- (96) Diethelm, R. 1977, BBSAG Bull., 31
- (97)
- (98) Diethelm, R. 1978, BBSAG Bull., 36
- (99)
- (100) Diethelm, R. 1980a, BBSAG Bull., 46
- (101)
- (102) Diethelm, R. 1980b, BBSAG Bull., 47
- (103)
- (104) Diethelm, R. 1981, BBSAG Bull., 53
- (105)
- (106) Diethelm, R. 1985, BBSAG Bull., 76
- (107)
- (108) Diethelm, R. 1988, BBSAG Bull., 87
- (109)
- (110) Edwards, T. W. 1976, AJ, 81, 245
- (111)
- (112) Eggen, O. J. 1968, ApJS, 16, 49
- (113)
- (114) Eggleton, P., Faulkner, J., & Flannery, B. P. 1973, A&A, 23, 325
- (115)
- (116) ESA 1997, The Hipparcos and Tycho Catalogues, ESA SP-1200
- (117)
- (118) Etzel, P. B. 1981, in Photometric and Spectroscopic Binary Systems, eds. E. B. Carling and Z. Kopal (Dordrecht: Reidel), 111
- (119)
- (120) Ferland, G., & Bopp, B. W. 1976, PASP, 88, 451
- (121)
- (122) Flower, P. J. 1996, ApJ, 469, 355
- (123)
- (124) Freytag, B., Ludwig, H.-G., & Steffen, M. 1999, in Theory and Tests of Convection in Stellar Structure, ASP Conf. Ser., 173, eds. A. Giménez, E. F. Guinan & B. Montesinos (San Francisco: ASP), 225
- (125)
- (126) Gadomski, J. 1934, Circ. Warszaw, 12, 5
- (127)
- (128) Geyer, E. H., & Kamper, B.-C. 1985, IBVS, 2819
- (129)
- (130) Girardi, L., Bressan, A., Bertelli, G., & Chiosi, C. 2000, A&AS, 141, 371
- (131)
- (132) Granzer, T., Schüssler, M., Caligari, P., & Strassmeier, K. G. 2000, A&A, 355, 1087
- (133)
- (134) Green, E. M., Demarque, P., & King, C. R. 1987, The Revised Yale Isochrones and Luminosity Functions (New Haven: Yale Univ. Obs.)
- (135)
- (136) Haisch, B. M., Schmitt, J. H. M. M., Rodonò, M., & Gibson, D. M. 1990, A&A, 230, 419
- (137)
- (138) Hatzes, A. P. 1995, in Stellar Surface Structure, IAU Symp. 176, ed. K. G. Strassmeier (Viena: Institut für Astronomie), 90
- (139)
- (140) Hauschildt, P. H., Allard, F., & Baron, E. 1999, ApJ, 512, 377
- (141)
- (142) Heintz, W. D. 1988, PASP, 100, 834
- (143)
- (144) Henry, T. J., Kirkpatrick, J. D., & Simons, D. A. 1994, AJ, 108, 1437
- (145)
- (146) Hilditch, R. W., & Hill, G. 1975, MmRAS, 79, 101
- (147)
- (148) Hübscher, J., & Agerer, F. 1996, BAV Mitt., 93
- (149)
- (150) Hübscher, J., Agerer, F., Busch, H., Goldhahn, L., Hassforther, B., & Dahm, M. 1999, BAV Mitt., 122
- (151)
- (152) Hübscher, J., Agerer, F., & Wunder, E. 1991, BAV Mitt., 59
- (153)
- (154) Hübscher, J., Agerer, F., & Wunder, E. 1992, BAV Mitt., 60
- (155)
- (156) Hübscher, J., Lichtenknecker, D., & Meyer, J. 1987, BAV Mitt., 43
- (157)
- (158) Hübscher, J., Lichtenknecker, D., & Wunder, E. 1990, BAV Mitt., 56
- (159)
- (160) de Jager, C., & Nieuwenhuijzen, H. 1987, A&A, 177, 217
- (161)
- (162) Johnson, H. L. 1965, ApJ, 141, 170
- (163)
- (164) Joy, A. H., & Sanford, R. S. 1926, ApJ, 64, 250
- (165)
- (166) Kenyon, S. J., & Hartmann, L. 1995, ApJS, 101, 117
- (167)
- (168) Kirkpatrick, J. D., Kelly, D. M., Rieke, G. H., Liebert, J., Allard, F., & Wehrse, R. 1993, ApJ, 402, 643
- (169)
- (170) Klinglesmith, D. A., & Sobieski, S. 1970, AJ, 75, 175
- (171)
- (172) Kodaira, K., & Ichimura, K. 1980, PASJ, 32, 451
- (173)
- (174) Krawchuk, C. A. P., Dawson, P. C., & De Robertis, M. M. 2000, AJ, 119, 1956
- (175)
- (176) Kron, G. E. 1952, ApJ, 115, 301
- (177)
- (178) Kron, G. E., Gascoigne, S. C. B., & White, H. S. 1957, AJ, 62, 205
- (179)
- (180) Kundera, T. 2001, Eclipsing Binaries Minima Database,http://www.oa.uj.edu.pl/ktt/
- (181)
- (182) Lacy, C. H. 1977, ApJ, 218, 444
- (183)
- (184) Lastennet, E., Valls-Gabaud, D., Lejeune, Th., & Oblak, E. 1999, A&A, 349, 485
- (185)
- (186) Latham, D. W. 1992, in IAU Coll. 135, Complementary Approaches to Double and Multiple Star Research, ASP Conf. Ser. 32, eds. H. A. McAlister & W. I. Hartkopf (San Francisco: ASP), 110
- (187)
- (188) Latham, D. W., Nordström, B., Andersen, J., Torres, G., Stefanik, R. P., Thaller, M., & Bester, M. 1996, A&A, 314, 864
- (189)
- (190) Leggett, S. K. 1992, ApJS, 82, 351
- (191)
- (192) Leggett, S. K., Allard, F., Berriman, G., Dahn, C. C., & Hauschildt, P. H. 1996, ApJS, 104, 117
- (193)
- (194) Lejeune, T., Cuisinier, F., & Buser, R. 1998, A&AS, 130, 65
- (195)
- (196) Leung, K.-C., & Schneider, D. P. 1978, AJ, 83, 618 (LS78)
- (197)
- (198) Luhman, K. L., & Rieke, G. H. 1998, ApJ, 497, 354
- (199)
- (200) Maceroni, C., & Rucinski, S. M. 1997, PASP, 109, 782
- (201)
- (202) Maceroni, C., & Rucinski, S. M. 1999, ApJ, 118, 1819
- (203)
- (204) Mallama, A. D. 1980a, PASP, 92, 468
- (205)
- (206) Mallama, A. D. 1980b, ApJS, 44, 241
- (207)
- (208) Mallama, A. D., Skillman, D. R., Pinto, P. A., & Krobusek, B. A. 1977, IBVS, 1249
- (209)
- (210) McLaughlin, D. B. 1924, ApJ, 60, 22
- (211)
- (212) Metcalfe, T. S., Mathieu, R. D., Latham, D. W., & Torres, G. 1996, ApJ, 456, 356
- (213)
- (214) Milone, E. F., Stagg, C. R., & Kurucz, R. L. 1992, ApJS, 79, 123
- (215)
- (216) Moffett, T. J., & Bopp, B. W. 1971, ApJ, 168, L117
- (217)
- (218) Mullan, D. J., & MacDonald, J. 2001, ApJ, 559, 353
- (219)
- (220) Nicolet, B. 1978, A&AS, 34, 1
- (221)
- (222) Nordström, B., Latham, D. W., Morse, J. A., Milone, A. A. E., Kurucz, R. L., Andersen, J., & Stefanik, R. P. 1994, A&A, 287, 338
- (223)
- (224) Olsen, E. H. 1984, A&AS, 57, 443
- (225)
- (226) Palla, F., & Stahler, S. W. 1999, ApJ, 525, 772
- (227)
- (228) Palla, F., & Stahler, S. W. 2001, ApJ, 553, 299
- (229)
- (230) Peter, H. 1972, BBSAG Bull., 3
- (231)
- (232) Peterson, D. M., & Solensky, R. 1988, ApJ, 333, 256
- (233)
- (234) Plez, B. 1992, A&AS, 94, 527
- (235)
- (236) Popper, D. M. 1980, Ann. Rev. Astron. Astrophys., 18, 115
- (237)
- (238) Popper, D. M. 1996, ApJS, 106, 133
- (239)
- (240) Popper, D. M. 1997, AJ, 114, 1195
- (241)
- (242) Press, W. H., Teukolsky, S. A., Vetterling, W. T., & Flannery, B. P. 1992, Numerical Recipes, (2nd. ed.; Cambridge: Cambridge Univ. Press), 650
- (243)
- (244) Rice, J. B., & Strassmeier, K. G. 2000, A&AS, 147, 151
- (245)
- (246) Rossiter, R. A. 1924, ApJ, 60, 15
- (247)
- (248) Saumon, D., Chabrier, G., & Van Horn, H. M. 1995, ApJS, 99, 713
- (249)
- (250) Schaller, G., Schaerer, D., Meynet, G., & Maeder, A. 1992, A&AS, 96, 269
- (251)
- (252) Schiller, S. J., & Milone, E. F. 1987, AJ, 93, 1471
- (253)
- (254) Schmidt-Kaler, Th. 1982, Landolt-Börnstein: Numerical Data and Functional Relationships in Science and Technology, eds. K. Schaifers & H. H. Voigt, (Springer-Verlag: Berlin), VI/2b
- (255)
- (256) Ségransan, D., Delfosse, X., Forveille, T., Beuzit, J.-L., Udry, S., Perrier, C., & Mayor, M. 2000, A&A, 364, 665 (S00)
- (257)
- (258) Siess, L., Dufour, E., & Forestini, M. 2000, A&A, 358, 593
- (259)
- (260) Siess, L., Forestini, M., & Dougados, C. 1997, A&A, 324, 556
- (261)
- (262) Smith, M. A. 1974, ApJ, 189, 101
- (263)
- (264) Sowell, J. R., Hughes, S. B., Hall, D. S., & Howard, B. A. 2001, AJ, 122, 1965
- (265)
- (266) Standish, E. M. 1995, in Highlights of Astronomy, Vol. 10, ed. I. Appenzeller (Dordrecht: Kluwer), 180
- (267)
- (268) Swenson, F. J., Faulkner, J., Rogers, F. J., & Iglesias, C. A. 1994, ApJ, 425, 286
- (269)
- (270) The Astronomical Almanac 2002, (Washington: USNO)
- (271)
- (272) Udalski A., Szymanski M., Kaluzny J., Kubiak M., Krzeminski W., Mateo M., Preston, G. W., & Paczynski B. 1993, Acta Astr. 43, 289
- (273)
- (274) van Altena, W. F., Lee, J. T., & Hoffleit, E. D. 1995, The General Catalogue of Trigonometric Stellar Parallaxes, (4th ed.; New Haven: Yale Univ. Obs.)
- (275)
- (276) van Gent, H. 1926, Bull. Astron. Inst. Netherlands, 3, 121
- (277)
- (278) van Gent, H. 1931, Bull. Astron. Inst. Netherlands, 6, 99
- (279)
- (280) Veeder, G. J. 1974, AJ, 79, 1056
- (281)
- (282) Vinter-Hansen, J. M. 1940, Lick Obs. Bull., 19, 89
- (283)
- (284) Wilson, R. E., & Biermann, P. 1976, A&A, 48, 349
- (285)
- (286) Wilson, R. E., & Devinney, E. J. 1971, ApJ, 166, 605 (WD)
- (287)
- (288) Yi, S., Demarque, P., Kim, Y.-C., Lee, Y.-W., Ree, C. H., Lejeune, T., & Barnes, S. 2001, ApJ, in press
- (289)
- (290) Zsoldos, E. 1986, IBVS, 2860
- (291)
- (292) Zucker, S., & Mazeh, T. 1994, ApJ, 420, 806
- (293)

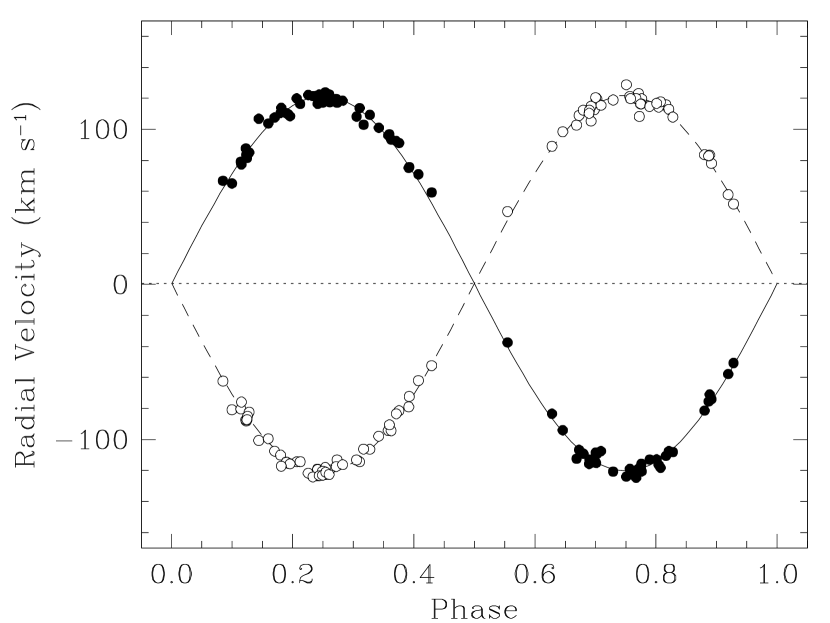


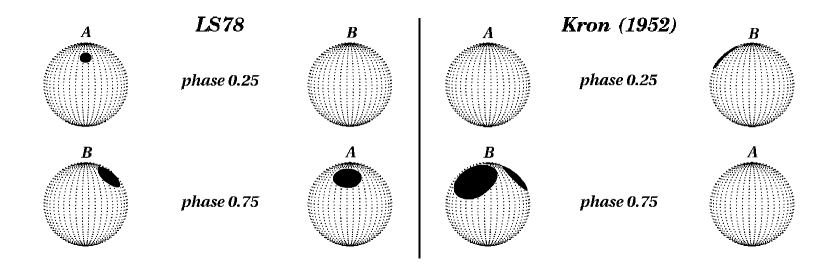


| HJD | RVA | RVB | (O-C)A | (O-C)B | |
|---|---|---|---|---|---|
| (2,400,000) | PhaseaaReferred to the time of eclipse given in the text (eq.[1]). | ( km s-1) | ( km s-1) | ( km s-1) | ( km s-1) |
| 50388.7556 | 0.673 | 108.89 | 106.53 | 1.19 | 0.51 |
| 50403.8862 | 0.254 | 122.31 | 119.75 | 1.72 | 1.26 |
| 50407.8678 | 0.144 | 100.42 | 106.76 | 5.72 | 11.51 |
| 50409.9510 | 0.702 | 119.48 | 109.13 | 3.18 | 5.45 |
| 50415.8348 | 0.928 | 51.76 | 50.64 | 1.76 | 1.50 |
| 50420.8603 | 0.100 | 80.65 | 65.08 | 10.16 | 6.10 |
| 50436.8784 | 0.771 | 122.97 | 118.65 | 2.31 | 0.26 |
| 50438.8941 | 0.247 | 119.84 | 120.52 | 0.77 | 0.50 |
| 50439.8135 | 0.376 | 81.36 | 91.03 | 3.44 | 5.62 |
| 50440.8755 | 0.680 | 112.34 | 108.93 | 2.20 | 0.48 |
| 50441.8847 | 0.919 | 57.85 | 57.77 | 1.58 | 0.25 |
| 50442.9609 | 0.241 | 118.98 | 120.83 | 1.46 | 0.02 |
| 50443.8319 | 0.311 | 114.27 | 113.58 | 2.30 | 1.14 |
| 50443.8978 | 0.391 | 78.87 | 75.03 | 3.04 | 1.47 |
| 50446.9365 | 0.123 | 87.88 | 83.51 | 3.70 | 1.29 |
| 50448.8145 | 0.430 | 52.27 | 59.24 | 0.91 | 7.08 |
| 50456.8140 | 0.254 | 120.98 | 121.63 | 0.37 | 0.61 |
| 50460.8356 | 0.192 | 115.11 | 109.70 | 2.33 | 3.53 |
| 50462.7592 | 0.555 | 47.03 | 37.36 | 5.66 | 2.70 |
| 50467.7616 | 0.698 | 112.50 | 112.22 | 2.81 | 1.37 |
| 50469.7291 | 0.114 | 80.16 | 79.12 | 0.99 | 0.69 |
| 50472.7437 | 0.816 | 115.76 | 110.48 | 4.44 | 0.86 |
| 50474.7172 | 0.240 | 123.13 | 121.55 | 2.73 | 0.74 |
| 50481.7527 | 0.880 | 83.50 | 81.33 | 0.09 | 0.54 |
| 50483.6753 | 0.241 | 119.27 | 116.35 | 1.18 | 4.52 |
| 50485.6715 | 0.693 | 105.25 | 113.22 | 8.71 | 0.97 |
| 50485.7188 | 0.751 | 128.69 | 123.82 | 6.97 | 3.86 |
| 50486.5903 | 0.821 | 112.82 | 107.42 | 2.99 | 0.72 |
| 50492.6584 | 0.273 | 113.04 | 116.99 | 6.31 | 2.79 |
| 50493.4989 | 0.305 | 113.09 | 108.08 | 0.29 | 5.75 |
| 50494.6927 | 0.771 | 119.26 | 119.44 | 1.36 | 0.57 |
| 50495.6047 | 0.891 | 77.98 | 73.99 | 1.05 | 1.44 |
| 50495.7929 | 0.123 | 87.16 | 87.67 | 3.34 | 3.23 |
| 50495.7974 | 0.128 | 82.21 | 85.03 | 4.58 | 2.36 |
| 50495.9059 | 0.261 | 119.41 | 117.38 | 0.92 | 3.36 |
| 50496.6755 | 0.206 | 114.23 | 119.85 | 1.90 | 3.28 |
| 50497.8476 | 0.646 | 98.46 | 93.88 | 1.75 | 1.21 |
| 50499.8666 | 0.125 | 84.78 | 84.18 | 0.57 | 1.78 |
| 50500.8001 | 0.272 | 117.25 | 119.51 | 2.25 | 0.41 |
| 50502.7780 | 0.701 | 117.19 | 114.98 | 1.21 | 0.73 |
| 50503.6378 | 0.757 | 121.12 | 118.79 | 0.49 | 1.07 |
| 50503.6537 | 0.776 | 119.62 | 120.45 | 0.46 | 2.12 |
| 50504.7441 | 0.115 | 75.68 | 77.36 | 4.10 | 3.06 |
| 50507.7246 | 0.776 | 116.37 | 115.63 | 3.79 | 2.78 |
| 50510.6167 | 0.327 | 106.24 | 109.17 | 0.38 | 2.06 |
| 50514.6515 | 0.282 | 116.10 | 118.30 | 2.04 | 0.27 |
| 50515.7804 | 0.669 | 102.70 | 112.19 | 3.56 | 7.60 |
| 50521.5605 | 0.767 | 119.84 | 124.51 | 1.18 | 5.24 |
| 50523.6368 | 0.317 | 106.03 | 102.84 | 4.03 | 7.69 |
| 50525.5846 | 0.709 | 115.42 | 107.33 | 2.31 | 8.66 |
| 50530.6164 | 0.888 | 83.37 | 70.94 | 4.68 | 6.23 |
| 50531.7052 | 0.226 | 121.52 | 122.04 | 2.31 | 2.41 |
| 50532.6553 | 0.392 | 72.17 | 75.55 | 3.13 | 0.41 |
| 50534.5933 | 0.772 | 108.19 | 119.05 | 12.33 | 0.28 |
| 50536.5972 | 0.233 | 123.94 | 121.42 | 3.97 | 1.03 |
| 50538.5472 | 0.628 | 89.05 | 83.23 | 1.18 | 3.07 |
| 50540.5477 | 0.085 | 62.16 | 66.77 | 1.12 | 4.99 |
| 50541.6248 | 0.408 | 61.92 | 70.87 | 4.00 | 4.23 |
| 50543.5521 | 0.774 | 116.19 | 118.57 | 4.10 | 0.03 |
| 50550.5521 | 0.371 | 83.30 | 92.27 | 3.97 | 4.40 |
| 50554.6000 | 0.342 | 97.76 | 100.83 | 3.14 | 0.59 |
| 50565.5499 | 0.789 | 114.71 | 112.88 | 3.31 | 3.41 |
| 50566.6741 | 0.170 | 107.29 | 107.54 | 1.63 | 1.39 |
| 50566.6821 | 0.180 | 109.89 | 110.58 | 0.83 | 1.05 |
| 50566.6898 | 0.189 | 114.38 | 110.43 | 2.45 | 1.96 |
| 50569.5426 | 0.693 | 114.87 | 113.97 | 0.90 | 1.71 |
| 50571.5514 | 0.160 | 99.28 | 103.78 | 2.38 | 1.60 |
| 50580.5514 | 0.212 | 114.14 | 116.26 | 3.13 | 1.44 |
| 50584.5512 | 0.124 | 87.01 | 81.47 | 2.16 | 3.99 |
| 50589.5422 | 0.254 | 117.93 | 123.74 | 2.67 | 2.72 |
| 50795.9108 | 0.690 | 112.24 | 112.76 | 0.97 | 1.26 |
| 50796.8181 | 0.804 | 114.22 | 116.23 | 0.53 | 3.19 |
| 50800.9569 | 0.887 | 82.74 | 75.43 | 3.20 | 2.59 |
| 50802.8367 | 0.196 | 115.58 | 108.42 | 1.97 | 5.64 |
| 50803.7832 | 0.358 | 94.08 | 95.93 | 0.24 | 1.53 |
| 50804.9232 | 0.758 | 119.70 | 120.27 | 1.87 | 0.45 |
| 50811.8377 | 0.249 | 120.25 | 117.09 | 0.38 | 3.96 |
| 50816.8156 | 0.363 | 94.29 | 93.13 | 2.77 | 1.04 |
| 50824.8106 | 0.181 | 116.98 | 113.83 | 7.51 | 3.89 |
| 50827.7634 | 0.807 | 117.60 | 118.11 | 3.67 | 5.90 |
| 50828.5942 | 0.828 | 107.84 | 107.98 | 0.27 | 2.09 |
| 50828.9332 | 0.244 | 123.14 | 122.29 | 2.59 | 1.33 |
| 50828.9376 | 0.249 | 122.88 | 121.69 | 2.25 | 0.64 |
| 50828.9419 | 0.255 | 120.93 | 122.29 | 0.35 | 1.29 |
| 50828.9462 | 0.260 | 122.45 | 122.43 | 2.05 | 1.62 |
| 50835.8190 | 0.700 | 120.45 | 108.32 | 4.60 | 5.81 |
| 50839.8816 | 0.689 | 110.27 | 115.55 | 2.79 | 4.20 |
| 50840.7282 | 0.729 | 118.85 | 120.53 | 1.83 | 1.60 |
| 50843.6844 | 0.360 | 90.45 | 96.58 | 2.58 | 2.98 |
| 50845.6723 | 0.801 | 116.65 | 112.75 | 1.07 | 1.11 |
| Element | Value |
|---|---|
| Adjusted quantities | |
| (days)aaAdopted from the ephemeris in §3, and held fixed. | 0.814282212 |
| ( km s-1) | 0.26 |
| ( km s-1) | 121.18 0.42 |
| ( km s-1) | 120.51 0.42 |
| bbCircular orbit adopted (see text). | 0 |
| Min I (HJD2,400,000)aaAdopted from the ephemeris in §3, and held fixed. | 49,345.112327 |
| Derived quantities | |
| (M☉) | 0.5938 0.0046 |
| (M☉) | 0.5971 0.0046 |
| 1.0056 0.0050 | |
| (106 km) | 1.3569 0.0047 |
| (106 km) | 1.3493 0.0047 |
| (R☉) | 3.8882 0.0095 |
| Other quantities pertaining to the fit | |
| 90 | |
| Time span (days) | 456.9 |
| ( km s-1) | 3.44 |
| ( km s-1) | 3.44 |
| HJD | (O-C) | |||||
|---|---|---|---|---|---|---|
| (2,400,000+) | Year | Eclipseaa1 = primary eclipse; 2 = secondary eclipse. | Typebbpg photographic, v visual, pe photoelectric. | EpochccIn cycles, counted from epoch of primary minimum given in the text. | (days) | Reference |
| 24500.5471 | 1925.9563 | 1 | pg | 30511.0 | 0.0007 | 1 |
| 24573.4233 | 1926.1558 | 2 | pg | 30421.5 | 0.0027 | 1 |
| 24584.4125 | 1926.1859 | 1 | pg | 30408.0 | 0.0063 | 1 |
| 24591.3347 | 1926.2049 | 2 | pg | 30399.5 | 0.0055 | 1 |
| 24595.4127ddThis time of minimum has often been mistakenly listed by other investigators as 2,424,595.4105, which is actually a mean epoch derived by van Gent (1926) from his own period analysis. The correct value to use is the actual observed epoch, as listed here. | 1926.2161 | 2 | pg | 30394.5 | 0.0011 | 1 |
| 24619.4308 | 1926.2818 | 1 | pg | 30365.0 | 0.0022 | 1 |
| 24639.3854 | 1926.3364 | 2 | pg | 30340.5 | 0.0025 | 1 |
| 24791.6548 | 1926.7533 | 2 | pg | 30153.5 | 0.0011 | 2 |
| 24848.6537 | 1926.9094 | 2 | pg | 30083.5 | 0.0003 | 2 |
| 24875.5268 | 1926.9830 | 2 | pg | 30050.5 | 0.0021 | 2 |
| 24916.6466 | 1927.0955 | 1 | pg | 30000.0 | 0.0006 | 2 |
| 24920.3112 | 1927.1056 | 2 | pg | 29995.5 | 0.0010 | 2 |
| 24921.5306 | 1927.1089 | 1 | pg | 29994.0 | 0.0011 | 2 |
| 24922.3441 | 1927.1111 | 1 | pg | 29993.0 | 0.0018 | 2 |
| 24961.4304 | 1927.2182 | 1 | pg | 29945.0 | 0.0011 | 2 |
| 25230.5519 | 1927.9550 | 2 | pg | 29614.5 | 0.0001 | 2 |
| 25234.6211 | 1927.9661 | 2 | pg | 29609.5 | 0.0021 | 2 |
| 25242.3568 | 1927.9873 | 1 | pg | 29600.0 | 0.0021 | 2 |
| 25687.3656 | 1929.2057 | 2 | pg | 29053.5 | 0.0015 | 2 |
| 25698.3561 | 1929.2357 | 1 | pg | 29040.0 | 0.0008 | 2 |
| 27158.3641 | 1933.2330 | 1 | pg | 27247.0 | 0.0008 | 3 |
| 27160.4011 | 1933.2386 | 2 | pg | 27244.5 | 0.0005 | 3 |
| 27461.2782 | 1934.0624 | 1 | pg | 26875.0 | 0.0003 | 4 |
| 28545.4929 | 1937.0308 | 2 | pg | 25543.5 | 0.0017 | 3 |
| 28571.5540 | 1937.1021 | 2 | pg | 25511.5 | 0.0023 | 3 |
| 28596.3861 | 1937.1701 | 1 | pg | 25481.0 | 0.0012 | 3 |
| 29639.4827 | 1940.0260 | 1 | pg | 24200.0 | 0.0001 | 3 |
| 30466.3861 | 1942.2899 | 2 | pg | 23184.5 | 0.0003 | 3 |
| 32605.9146 | 1948.1476 | 1 | pe | 20557.0 | 0.0017 | 5 |
| 32606.3222 | 1948.1487 | 2 | pe | 20556.5 | 0.0022 | 5 |
| 32965.8275 | 1949.1330 | 1 | pe | 20115.0 | 0.0019 | 5 |
| 32966.2353 | 1949.1341 | 2 | pe | 20114.5 | 0.0025 | 5 |
| 40252.4400 | 1969.0827 | 2 | v | 11166.5 | 0.0100 | 6 |
| 40259.3550 | 1969.1016 | 1 | v | 11158.0 | 0.0036 | 6 |
| 40274.4220 | 1969.1428 | 2 | v | 11139.5 | 0.0064 | 6 |
| 40283.3800 | 1969.1674 | 2 | v | 11128.5 | 0.0073 | 6 |
| 40316.3570 | 1969.2577 | 1 | v | 11088.0 | 0.0058 | 6 |
| 40316.3620 | 1969.2577 | 1 | v | 11088.0 | 0.0108 | 6 |
| 40322.4170 | 1969.2742 | 2 | v | 11080.5 | (0.0413) | 6 |
| 40353.3860 | 1969.3590 | 2 | v | 11042.5 | 0.0150 | 6 |
| 40353.4100 | 1969.3591 | 2 | v | 11042.5 | 0.0090 | 6 |
| 40561.4590 | 1969.9287 | 1 | v | 10787.0 | 0.0089 | 6 |
| 40589.5620 | 1970.0056 | 2 | v | 10752.5 | 0.0192 | 6 |
| 40658.3540 | 1970.1940 | 1 | v | 10668.0 | 0.0043 | 6 |
| 40854.5810 | 1970.7312 | 1 | v | 10427.0 | 0.0107 | 6 |
| 40938.4700 | 1970.9609 | 1 | v | 10324.0 | 0.0072 | 6 |
| 40968.9953 | 1971.0445 | 2 | pe | 10286.5 | (0.0031) | 7 |
| 40969.8116 | 1971.0467 | 2 | pe | 10285.5 | (0.0010) | 7 |
| 40970.6265 | 1971.0489 | 2 | pe | 10284.5 | (0.0004) | 7 |
| 40971.8466 | 1971.0523 | 1 | pe | 10283.0 | (0.0017) | 7 |
| 41024.3810 | 1971.1961 | 2 | v | 10218.5 | 0.0115 | 6 |
| 41315.8847 | 1971.9942 | 2 | v | 9860.5 | 0.0021 | 8 |
| 41316.2979 | 1971.9953 | 1 | v | 9860.0 | 0.0082 | 8 |
| 41401.3920 | 1972.2283 | 2 | v | 9755.5 | 0.0098 | 9 |
| 41410.3400 | 1972.2528 | 2 | v | 9744.5 | 0.0007 | 9 |
| 41416.4580 | 1972.2696 | 1 | v | 9737.0 | 0.0116 | 9 |
| 41434.3660 | 1972.3186 | 1 | v | 9715.0 | 0.0054 | 10 |
| 41436.3880 | 1972.3241 | 2 | v | 9712.5 | 0.0083 | 9 |
| 41681.0835 | 1972.9941 | 1 | v | 9412.0 | 0.0047 | 8 |
| 41719.3500 | 1973.0988 | 1 | v | 9365.0 | 0.0094 | 11 |
| 41789.3880 | 1973.2906 | 1 | v | 9279.0 | 0.0003 | 12 |
| 42035.3260 | 1973.9639 | 1 | v | 8977.0 | 0.0251 | 13 |
| 42064.2100 | 1974.0430 | 2 | pe | 8941.5 | 0.0021 | 14 |
| 42403.3570 | 1974.9715 | 1 | v | 8525.0 | 0.0005 | 15 |
| 42411.4956 | 1974.9938 | 1 | v | 8515.0 | 0.0037 | 8 |
| 42411.9100 | 1974.9950 | 2 | v | 8514.5 | 0.0036 | 8 |
| 42416.3990 | 1975.0073 | 1 | v | 8509.0 | 0.0140 | 16 |
| 42430.2300 | 1975.0451 | 1 | pe | 8492.0 | 0.0022 | 14 |
| 42453.0300 | 1975.1075 | 1 | pe | 8464.0 | 0.0023 | 14 |
| 42464.4290 | 1975.1388 | 1 | v | 8450.0 | 0.0014 | 17 |
| 42467.2810 | 1975.1466 | 2 | v | 8446.5 | 0.0034 | 17 |
| 42469.3000 | 1975.1521 | 1 | v | 8444.0 | 0.0133 | 17 |
| 42829.6340 | 1976.1386 | 2 | pe | 8001.5 | 0.0008 | 18 |
| 42835.3340 | 1976.1542 | 2 | v | 7994.5 | 0.0008 | 19 |
| 42837.3760 | 1976.1598 | 1 | v | 7992.0 | 0.0071 | 19 |
| 43131.3280 | 1976.9646 | 1 | v | 7631.0 | 0.0032 | 20 |
| 43142.7276 | 1976.9958 | 1 | v | 7617.0 | 0.0029 | 8 |
| 43510.3630 | 1978.0024 | 2 | v | 7165.5 | 0.0101 | 21 |
| 43514.8660 | 1978.0147 | 1 | pe | 7160.0 | 0.0143 | 22 |
| 43949.6790 | 1979.2051 | 1 | pe | 6626.0 | 0.0006 | 23 |
| 43960.6731 | 1979.2352 | 2 | pe | 6612.5 | 0.0019 | 23 |
| 43969.6277 | 1979.2598 | 2 | pe | 6601.5 | 0.0006 | 23 |
| 44295.3440 | 1980.1515 | 2 | v | 6201.5 | 0.0028 | 24 |
| 44303.4950 | 1980.1738 | 2 | v | 6191.5 | 0.0110 | 25 |
| 44343.3880 | 1980.2831 | 2 | v | 6142.5 | 0.0042 | 25 |
| 44637.3410 | 1981.0879 | 2 | pe | 5781.5 | 0.0013 | 26 |
| 44709.4065 | 1981.2852 | 1 | pe | 5693.0 | 0.0028 | 27 |
| 45036.3430 | 1982.1803 | 2 | v | 5291.5 | 0.0050 | 28 |
| 45036.3500 | 1982.1803 | 2 | v | 5291.5 | 0.0120 | 28 |
| 46017.5488 | 1984.8667 | 2 | pe | 4086.5 | 0.0007 | 29 |
| 46018.7683 | 1984.8700 | 1 | pe | 4085.0 | 0.0012 | 30 |
| 46019.1766 | 1984.8711 | 2 | pe | 4084.5 | 0.0000 | 30 |
| 46019.5800 | 1984.8722 | 1 | pe | 4084.0 | 0.0038 | 31 |
| 46121.3770 | 1985.1509 | 1 | v | 3959.0 | 0.0079 | 32 |
| 46474.3550 | 1986.1173 | 2 | v | 3525.5 | 0.0054 | 33 |
| 46533.3960 | 1986.2790 | 1 | v | 3453.0 | 0.0001 | 33 |
| 46825.3190 | 1987.0782 | 2 | v | 3094.5 | 0.0030 | 34 |
| 46827.3550 | 1987.0838 | 1 | v | 3092.0 | 0.0033 | 34 |
| 46860.3330 | 1987.1741 | 2 | v | 3051.5 | 0.0028 | 34 |
| 47182.3800 | 1988.0558 | 1 | v | 2656.0 | 0.0012 | 6 |
| 47208.4300 | 1988.1271 | 1 | v | 2624.0 | 0.0058 | 35 |
| 47592.3680 | 1989.1783 | 2 | v | 2152.5 | 0.0019 | 36 |
| 48344.3550 | 1991.2371 | 1 | v | 1229.0 | 0.0045 | 37 |
| 48357.3760 | 1991.2728 | 1 | v | 1213.0 | 0.0120 | 37 |
| 48618.3630 | 1991.9873 | 2 | v | 892.5 | 0.0025 | 38 |
| 48686.3530 | 1992.1735 | 1 | v | 809.0 | 0.0050 | 38 |
| 48743.3530 | 1992.3295 | 1 | v | 739.0 | 0.0048 | 38 |
| 50113.3820 | 1996.0804 | 2 | v | 943.5 | 0.0056 | 39 |
| 50146.3680 | 1996.1708 | 1 | v | 984.0 | 0.0020 | 39 |
| 50170.3830 | 1996.2365 | 2 | v | 1013.5 | 0.0044 | 39 |
| 50192.3710 | 1996.2967 | 2 | v | 1040.5 | 0.0020 | 39 |
| 50896.3199 | 1998.2240 | 1 | pe | 1905.0 | 0.0000 | 40 |
| 51163.4047 | 1998.9552 | 1 | pe | 2233.0 | 0.0002 | 40 |
| 51165.4400 | 1998.9608 | 2 | pe | 2235.5 | 0.0002 | 40 |
| 51254.6030 | 1999.2049 | 1 | pe | 2345.0 | 0.0011 | 41 |
| 51288.3920 | 1999.2974 | 2 | v | 2386.5 | 0.0048 | 42 |
References. — (1) van Gent 1926; (2) van Gent 1931; (3) Binnendijk 1950; (4) Gadomski 1934; (5) Kron 1952; (6) Kundera 2001; (7) Leung & Schneider 1978; (8) Mallama 1980a; (9) Peter 1972; (10) Diethelm 1972; (11) Diethelm 1973a; (12) Diethelm 1973b; (13) Diethelm 1974; (14) Budding 1975 (see also Haisch et al. 1980); (15) Diethelm 1975a; (16) Diethelm 1975b; (17) Diethelm 1975c; (18) Mallama et al. 1977; (19) Braune & Hübscher 1979; (20) Diethelm 1977; (21) Diethelm 1978; (22) Kodaira & Ichimura 1980; (23) Mallama 1980b; (24) Diethelm 1980a; (25) Diethelm 1980b; (26) Diethelm 1981; (27) Braune & Mundry 1981; (28) Braune & Mundry 1982; (29) Geyer & Kamper 1985; (30) Haisch et al. 1990; (31) Zsoldos 1986; (32) Diethelm 1985; (33) Hübscher, Lichtenknecker & Meyer 1987; (34) Braune & Hübscher 1987; (35) Diethelm 1988; (36) Hübscher, Lichtenknecker & Wunder 1990; (37) Hübscher, Agerer & Wunder 1991; (38) Hübscher, Agerer & Wunder 1992; (39) Hübscher & Agerer 1996; (40) Agerer & Hübscher 1999; (41) Sowell et al. 2001; (42) Hübscher et al. 1999.
| LS78 data | Kron (1952) data | |
|---|---|---|
| Parameter | () | () |
| Geometric and radiative parameters | ||
| (days) (fixed)aaPeriod from ephemeris in eq.(1). | 0.814282212 | 0.814282212 |
| (fixed) | 0 | 0 |
| (fixed)bbMass ratio from spectroscopic solution (see Table 2). | 1.0056 | 1.0056 |
| (fixed) | 7.315 | 7.48 |
| 7.334 0.042 | 7.50 0.40 | |
| 0.1600 | 0.1558 | |
| 0.1583 | 0.1543 | |
| 0.1589 | 0.1548 | |
| 0.1598 | 0.1556 | |
| ccFractional radius of a sphere with the same volume as the Roche equipotential. | 0.1590 0.0014 | 0.1549 0.0090 |
| (deg) | 86.29 0.10 | 86.39 0.54 |
| (K) (fixed) | 3820 | 3820 |
| 0.984 0.004 | 1.003 0.012 | |
| ( band) | 0.886 0.010 | 1.021 0.074 |
| ( band) | 0.894 0.010 | |
| ( band) | 0.918 0.010 | |
| (fixed) | 0 | 0 |
| Albedo (fixed) | 0.5 | 0.5 |
| Gravity brightening (fixed) | 0.2 | 0.2 |
| Limb darkening coefficients (Logarithmic law) | ||
| and ( band) | 0.814 , 0.303 | 0.814 , 0.303 |
| and ( band) | 0.815 , 0.331 | 0.813 , 0.306 |
| and ( band) | 0.777 , 0.312 | |
| and ( band) | 0.776 , 0.327 | |
| and ( band) | 0.689 , 0.354 | |
| and ( band) | 0.689 , 0.368 | |
| Spot parameters | ||
| (fixed) | 0.90 | 0.90 |
| Latitude (deg) (fixed) | 45 | 45 |
| Phase for spot #1 | 0.733 | 0.516 |
| Radius for spot #1 (deg) | 20.1 | 25.5 |
| Location of spot #1 | Primary | Secondary |
| Phase for spot #2 | 0.587 | 0.836 |
| Radius for spot #2 (deg) | 21.0 | 35.0 |
| Location of spot #2 | Secondary | Secondary |
| Phase for spot #3 | 0.250 | |
| Radius for spot #3 (deg) | 9.0 | |
| Location of spot #3 | Primary | |
| Residuals from the fits | ||
| (mag) | 0.013 | 0.020 |
| (mag) | 0.011 | |
| (mag) | 0.009 | |
| Parameter | Value |
|---|---|
| Mass (M☉) | 0.5992 0.0047 |
| Radius (R☉) | 0.6191 0.0057 |
| (cgs) | 4.6317 0.0083 |
| (gr cm-3) | 3.56 0.10 |
| (km s-1)aaMeasured projected rotational velocity. | 37 2 |
| (km s-1)bbProjected rotational velocity expected for synchronous rotation. | 38.5 0.4 |
| (K) | 3820 100 |
| ccComputed from the radius and effective temperature. | 0.0733 0.0015 |
| (mag)c,dc,dfootnotemark: | 7.569 0.020 |
| (mag)eeComputed from the apparent visual magnitude of the system and the Hipparcos parallax of Castor, revised as described in the Appendix. | 8.950 0.029 |
| MethodaaSee text for details. | Color index | SourcesbbAll individual values from the sources listed have been converted to a uniform system following Leggett (1992). | Result (K) | Calibration used |
|---|---|---|---|---|
| B V | 1.454 | 2,3,4,5,7 | 3877 | Arribas & Martínez Roger 1989 |
| ()C | 0.993 | 1,2,4,7,8 | 3723 | Bessell 1979 |
| ()C | 1.919 | 2,4,7,8 | 3719 | Bessell 1979 |
| 3.890 | 2,4 | 3841 | Arribas & Martínez Roger 1989 | |
| 0.794 | 6 | 3971 | Olsen 1984 | |
| SED | 3800 | Bopp et al. 1974 |
References. — (1) Kron, Gascoigne & White 1957; (2) Johnson 1965; (3) Eggen 1968; (4) Veeder 1974; (5) Budding 1975; (6) Hilditch & Hill 1975; (7) Barnes, Evans & Moffett 1978; (8) Leung & Schneider 1978 .
| ParameteraaBased on the light-curve solution by Schiller & Milone (1987) and the spectroscopic analysis by Peterson & Solensky (1988). | Primary | Secondary |
|---|---|---|
| Mass (M☉) | 1.0591 0.0062 | 0.7605 0.0062 |
| Radius (R☉) | 0.900 0.016 | 0.768 0.010 |
| 4.554 0.016 | 4.548 0.011 | |
| (K)bbDerived from photometric indices, as described in the text. | 5530 100 | 4220 150 |
| 0.678 0.055 | 0.168 0.024 | |
| (mag)ccThe parallax adopted is from the Hipparcos mission. | 5.10 0.13 | 7.39 0.14 |
| Age | Mixing Length/ | ||||||||
|---|---|---|---|---|---|---|---|---|---|
| Model / BC | Refs. | (Myr) | Overshooting | (M☉) | (M☉) | (R☉) | (R☉) | ||
| Girardi/Bertelli | 1 / 2 | 333 | 0.0198 | 0.275 | 1.68 / 0.25 | 2.30 | 1.80 | 2.24 | 1.71 |
| Yi/Lejeune | 3 / 4 | 378 | 0.0175 | 0.265 | 1.74 / 0.20 | 2.29 | 1.80 | 2.20 | 1.68 |
| Yi/Green | 3 / 5 | 369 | 0.0183 | 0.267 | 1.74 / 0.20 | 2.31 | 1.82 | 2.22 | 1.69 |
| Claret/Flower | 6 / 7 | 410 | 0.0165 | 0.270 | 1.52 / 0.20 | 2.26 | 1.80 | 2.19 | 1.69 |
| Claret/Flower | 6 / 7 | 381 | 0.0183 | 0.300 | 1.52 / 0.20 | 2.20 | 1.75 | 2.19 | 1.69 |
| Schaller/Flower | 8 / 7 | 367 | 0.0182 | 0.295 | 1.60 / 0.20 | 2.26 | 1.79 | 2.18 | 1.68 |
| Siess/Siess | 9 / 9 | 300 | 0.0189 | 0.275 | 1.50 / 0.00 | 2.34 | 1.85 | 2.15 | 1.67 |
| Siess/KenyonaaZero point of bolometric corrections adjusted for consistency with . | 9 / 10 | 315 | 0.0186 | 0.274 | 1.50 / 0.00 | 2.36 | 1.84 | 2.20 | 1.67 |
| Siess/Flower | 9 / 7 | 339 | 0.0174 | 0.272 | 1.50 / 0.00 | 2.29 | 1.82 | 2.11 | 1.64 |
References. — (1) Girardi et al. 2000; (2) Bertelli et al. 1994; (3) Yi et al. 2001; (4) Lejeune et al. 1998; (5) Green, Demarque & King 1987; (6) Claret & Giménez 1998; (7) Flower 1996; (8) Schaller et al. 1992; (9) Siess, Forestini & Dougados 1997; (10) Kenyon & Hartmann 1995.
| Parameter | A | B | C | AB |
|---|---|---|---|---|
| Mass (M☉)aaModel-dependent for Castor A and B. | 2.27 0.45 | 1.79 0.32 | 0.60 0.60 | 4.83 |
| Orbital inclination (deg)a,ba,bfootnotemark: | 28 | 90: | 86.3 | 114.5 |
| Orbital period | 9.21280 d | 2.928315 d | 0.814282212 d | 467 yr |
| Orbital eccentricity | 0.4992 | 0 | 0 | 0.343 |