Understanding the nature of the optically faint radio sources and their connection to the submillimeter population
Abstract
We present a sample of 43 submillimeter sources detected (at ), drawn from our program to follow-up optically faint radio sources with SCUBA. These sources already have associated radio and in many cases optical identifications, and many are also detected at 450m. We compare these with 12 submillimeter sources drawn from the literature, which were discovered in blank field mapping campaigns, but also have radio detections. We then use this total sample (55 sources) to study and model the evolution of dusty galaxies. A correlation is observed in the sub-mm/radio color-magnitude diagram, which can be modeled by strong luminosity evolution. The selection effects of the radio/optical pre-selection technique are determined from the models, and a corrected redshift distribution is constrained using a range of model assumptions. The temperature/redshift effects on the 450m detected subset of our sample are studied in relation to the models, and prospects for improved measurements in the shorter sub-mm wavelength windows (450m and 350m) are explored.
Subject headings:
galaxies: evolution — galaxies: formation — sub-mm: galaxies — radio: galaxies1. Introduction
The advent of the Sub-millimeter Common User Bolometer Array (SCUBA) on the James Clerk Maxwell Telescope (JCMT) has spawned a new era of discovery in the sub-mm wavebands. Sub-mm luminous, extragalactic sources were quickly uncovered (Smail, Ivison & Blain 1997) as the possible high redshift analogs to local Ultra-Luminous InfraRed Galaxies (ULIRGs). However, the population continues to be poorly understood, largely as a result of two observational difficulties. Firstly, obtaining large samples of objects from SCUBA sub-mm mapping is an arduous process, whereby typically one to two sources are uncovered in a night’s worth of integration on a blank piece of sky. Secondly, identifying secure detections at other wavelengths is tremendously difficult due to the positional uncertainty and large SCUBA beam-size (15 arcsec), and the intrinsic faintness of most sources at all other wavelengths.
The tight correlation observed locally between thermal far-IR emission and synchrotron radio emission (Helou et al. 1985, Condon 1992) suggests a possibility for identifying the sub-mm sources. The positional accuracy and small beamsizes of large radio interferometers like the VLA can act as a surrogate to the sub-mm, allowing precise identifications at other wavelengths. Smail et al. (2000) demonstrated that a significant fraction of their sub-mm sources could be detected in the radio. However, reaching the radio depths required to detect the sub-mm sources is not trivial. Even the deepest radio map yet obtained, a 100 hour VLA integration at 1.4 GHz in the SSA13 survey region (Fomalont et al. 2002), cannot detect all the bright sub-mm sources found in this field (Barger et al. 2001a). At this depth (=20 Jy) sub-mm sources with warm (K) dust and luminosities similar to the local ULIRG, Arp220 will likely be missed at . Colder sources would be missed at even lower redshifts (Blain 1999).
Putting aside the precise form of the radio/sub-mm overlap, deep radio observations have emerged as an efficient means to pre-select high redshift, sub-mm sources (Barger, Cowie, Richards 2000, hereafter BCR; Chapman et al. 2001a, hereafter C01). This effectively circumvents the time constraint for obtaining large samples of objects with the present generation sub-mm imaging instruments, SCUBA (Holland et al. 1999) and MAMBO (Bertoldi et al. 2000). These surveys (BCR, C01) have used the bi-modal break in the apparent optical magnitudes of radio source identifications lying at (Richards et al. 1999), selecting only the relatively faint sources for sub-mm follow-up – the Optically Faint Radio Sources (OFRS). While the entire blank field sub-mm population (e.g. Smail et al. 2001) is not selected in this manner, a significant percentage of the source counts are recovered (70%, BCR, C01). The key advantage, however, is that the optical and radio properties of the sources are known with certainty, with the high resolution radio providing morphological information for studying the types of galaxies in the sub-mm population (Richards 2000). The challenge is to understand the selection function sufficiently to exploit the rich information gleaned by the large samples of sub-mm sources uncovered in this manner.
In this paper, we investigate the evolutionary behavior of the sub-mm population of galaxies, constrained by the correlations observed in a large sample selected using the radio. We develop models to describe the form of the evolution and study the model-implied radio selection function. The detailed, multi-wavlength properties of this large sample of radio selected sub-mm sources are presented elsewhere (Chapman et al. in preparation, Barger et al. 2001b). We give only a brief description in Section 2, and show color-magnitude diagrams in Section 3. We adopt two modeling approaches. In Section 4 we take the local IRAS bright galaxy sample and evolve individual sources according to prescriptions which are able to fit the SCUBA counts (e.g. Blain et al. 1999a) and the far-infrared background (Puget et al. 1996, Fixsen et al. 1998). In Section 5 we adopt a Monte Carlo approach, drawing luminous infrared galaxies randomly from evolving distributions. We use these models to better understand the range in properties sampled by the radio pre-selected sub-mm galaxy population in Section 6. We then discuss shorter wavelength sub-mm detections in Section 7 and consider wider implications and future directions in Section 8.
2. Sample definition
We draw on the large number of sub-mm sources cataloged and described in Chapman et al. (in preparation) and Barger et al. (2001b), which were obtained through SCUBA follow-up to radio sources in the extended Hubble Deep Field (HDF), and the Hawaii SSA13 survey field. The main sample consists of 43 sources detected at 850m above 3 times the RMS, corresponding to about 5 mJy. Twenty of these were already presented in BCR and C01. The sources were observed in SCUBA ‘photometry’ mode, keeping the source on a bolometer at all times (3-bolometer chopping – C01) in order to go deeper than making a fully sampled map of the field. Targets were selected to be optically faint, with no optical source having flux being coincident with the radio position.
Several of these sources have radio/optical astrometry which is difficult to reconcile, with radio source centroids offset from relatively bright optical sources by 0.5″ to 1.5″. In C01, we assumed that 6 such sources were optically fainter than (3 detected in the sub-mm, and 3 undetected). Further statistical analysis and a more precise astrometric solution now suggest that these optically brighter sources are the likely counterparts to the radio sources. Sub-mm follow-up of radio sources subsequent to the C01 study has extended the sample into optically brighter sources as described in Chapman et al. (2002a). Such endeavors have continued to uncover sub-mm luminous sources, albeit at a lower recovery rate than the samples. We estimate that the sub-mm recovery rate for radio sources with is 38%.
The sub-mm follow-up to radio sources leaves a large undetected sample, with an implied mJy. This begs the question as to the nature of these sources. As discussed in C01, this undetected radio sample has significant sub-mm flux on average, even if individually they are too faint to detect. Since there is no significant difference in the radio flux distribution between the sub-mm detected and undetected OFRS samples, one interpretation is that they are a lower redshift continuation of our detected sample (intrinsically less radio-luminous and harder to detect with SCUBA). However, we do not discount the possibility raised in Richards et al. (1999) that these sources could be high redshift radio-loud AGN. Some fraction of them could also be displaced radio lobes from other radio sources.
A simple inspection of the SED for the ULIRG Arp220 suggests that the deep VLA maps used both to select the OFRS for SCUBA follow-up and to attempt identification of sub-mm blank field surveys (Jy completeness) will not detect a galaxy with twice the luminosity of Arp220 beyond (mJy). However, the sub-mm selection function suggests that sources typically detectable by SCUBA should lie mostly at (Blain et al. 1999b). Thus the radio identified sub-mm population suggests a redshift range spanning 1–3.
We also collected sub-mm sources with radio identifications from the literature, in order to compare the properties of sources drawn from blank fields to our OFRS selected sub-mm sources. Seven sources from the Smail et al. (2001) catalog and five from Eales et al. (2000) were identified in the radio and can thus be compared with our sample. Smail et al. (2001) have suggested optical counterparts for their objects, 4 of which are optically fainter than , while 3 lie between .
3. The sub-mm/radio color-magnitude diagram
A favorable situation exists for studying high redshift sources in the sub-mm waveband: for sub-mm sources lying at redshifts greater than about one, we can use the sub-mm flux alone to estimate the overall luminosity, only weakly dependent on redshift because of the offsetting effects of the steep positive spectral index in the sub-mm and cosmological dimming. The negative spectral index in the radio further implies that the sub-mm/radio ratio can be used as a rough redshift indicator (Carilli & Yun, 1999,2000; Dunne et al. 2000; BCR), effectively tracing the trough in the spectral energy distribution (SED) formed by the opposing spectral indices.
The flat luminosity-redshift relation implies that any trends observed in the ratio of sub-mm/radio as a function of sub-mm flux must be a result of evolutionary effects. Of immediate interest for our sample is therefore to analyze the / versus plane – essentially a sub-mm/radio color-magnitude diagram (CMD). For sources at and in the absence of varying dust effects, such a CMD can be interpreted simply in terms of redshift (-axis) and luminosity (-axis). However, the redshift estimated in this manner is degenerate with dust temperature (Blain 2000) and it is only the quantity which is truly constrained by the sub-mm/radio ratio. This increases the impetus to study the CMD in order to assess any obvious trends of this redshift/temperature indicator with sub-mm flux density.
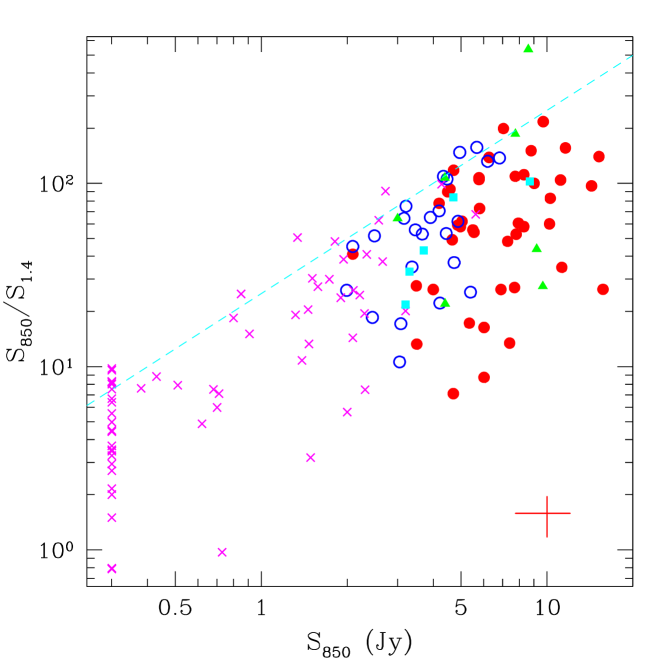
In Fig. 1, we present the sub-mm/radio CMD for the total sub-mm observed OFRS sample. Red circles represent radio sources detected with significance at 850m. An error bar representative of the RMS error for the detected sample is shown in the lower right corner. Blue circles show an additional 24 sources from our sample which have significance at 850m. While we do not consider these robust detections, a large fraction will be real sub-mm sources, and the average properties of this marginally detected sample will help extend the statistical properties of OFRSs to fainter fluxes. Crosses represent radio sources with significance at 850m, where sources with negative sub-mm flux density have been arbitrarily plotted at mJy.
In interpreting Fig. 1 we caution that our sample is only complete at a flux limit of mJy, resulting in accurate distributions in the CMD plane only for these brightest sources. Nevertheless an apparent correlation is seen, whereby an increasing ratio of 850m flux to 1.4 GHz flux scales with increasing . This correlation plausibly extends into the regime of radio sources with significance in the sub-mm (open circles and crosses). However, the absence of sources in the upper left corner of the diagram is largely the result of the radio flux limit of the survey, which we represent with a dashed line. Note that the two sources lying above the line were selected from the deeper SSA13 radio field. On the other hand, the dearth of sources in the lower right of Fig. 1, compared with the high density of sources in the upper right, must be a true evolutionary effect.
As a comparison with other studies, we also plot in Fig. 1 the sub-mm sources with radio counterparts from the catalogs of Smail et al. (2001) and Eales et al. (2000) as 7 triangles and 5 squares respectively. Of interest is the fact that these sources lie scattered around the complete CMD area probed by our OFRS sample, with no obvious bias for the optically brighter members. It is therefore plausible that these sources may trace the same evolutionary trends uncovered by our OFRS population, irrespective of the optical emission. We return to this point later.
Note that all sources presented in the diagram are robustly detected in the radio, and are likely to be relatively high star formation rate galaxies as noted in section 2 above, whether or not we were able to obtain secure sub-mm detections. We can thus study with confidence the CMD at the bright end. However, a more detailed assessment of the population lying in the 1–mJy regime will require additional, deeper sub-mm measurements, which would provide significant leverage of the CMD correlation to fainter sub-mm flux densities.
4. Local CMD relations and a simple picture of evolution
To better understand the intrinsic scatter and correlations present in the sub-mm/radio population at higher redshifts, we examine the local infrared luminous population in the radio and at sub-mm to far-IR wavelengths. We present a sample of 19 objects from the IRAS bright galaxy sample (BGS) which have been measured at 850 and 450m (Dunne & Eales 2001), and in the radio (Condon et al. 1996). We plot them in the CMD plane (Fig. 2a), as well as a color-color diagrams (CCDs) consisting of either or versus (Fig. 2b,c). For the range of likely redshifts of the SCUBA sources in this study (1–4), the 850m band will remain a probe of the Raleigh-Jeans grey-body tail of the SED. However, the observed 450m band will sample a very different part of the SED at higher redshifts, comparable to m locally.
The 850m/radio CMD reflects the intrinsic scatter in the far-IR/radio relation, coupled with the dispersion from dust temperatures and emissivities, as well as measurement uncertainties. The measured scatter of 0.2 dex in 850m/radio (Table 1) is close to that found for the far-IR/radio (Helou et al. 1985).
The 450m/850m CMD shows a flat relation, representing a fairly constant and cool dust temperature component ( K), as discussed in Dunne & Eales (2001). The 100m/850m and 60m/100m CMDs, however, show a rather large scatter, indicative of a range in warmer (40 K) dust properties found in this local infrared luminous sample.
The local galaxy color-color relations, using the 450m/850m versus 850m/radio, continue to reflect the apparent constancy of the cool dust properties of this sample. The color-color relation using the local 100m band, however, now forms a strong correlation (compare Figs. 2a,b), reflecting the effect of dust temperature and emissivity variations on both the 100m/850m and the 850m/radio. This arises since the change in temperature effectively changes the total far-IR luminosity for a fixed 850m measurement, and thus changes the correlation of far-IR/radio. The 60m band is similar to the 100m, but exhibits larger scatter as it lies beyond the grey-body peak and hence has contributions from a range of dust components.
While 19 objects is a small sample from which to establish local correlations, a larger sample exists for IRAS galaxies measured only at 850m Dunne et al. (2000a). Color-color diagrams for this larger IRAS sample are presented in Fig. 2c. The steep negative correlations in the 100m/850m and 60m/850m diagrams are still observed, with similar scatter as in the 19 object sample. For reference, we list the scatter and slope of all these local correlations in Table 1
These correlations may arise due to sources with the highest dust temperatures (and hence 100m/850m, 60m/100m ratios) having effectively have lower FIR fluxes, for galaxies in this limited range of . The 850m/GHz ratio, scaling inversely with far-IR, is therefore also lower. The 850m/GHz correlation from the SED template catalog of Dale et al. (2001a,b) suggests that the more quiescent galaxies have a significantly greater 850m/GHz ratio than active IR-luminous star forming galaxies (as expected since the quiescent galaxies have colder dust). By redshifting the SEDs, we can anticipate the effect of this monotonic scaling of 850m/GHz with galaxy IR luminosity on our high- CMD and CCD relations. Local infrared sources can thus be understood as correlating tightly in color-color space, due to the effect of dust properties and star-formation on both the radio and the far-IR windows, leaving the 850m and 450m flux densities relatively constant. This behavior is modeled in detail in Dale et al. (2001a,b).
In the absence of evolution, tracing sources to higher redshifts would lead to results following the trend discussed above: the sources retain the same observed flux density, whilst increasing in 850m/radio as a function of redshift (Fig. 3a). If we propose instead that a population of IR-luminous objects undergoes a strong luminosity evolution of the form out to , turning over to to (Fig. 3b), then the local sources move along the direction suggested in our observed SCUBA source sample (Fig. 1). The CMD trend can be understood naturally in terms of luminosity evolution: more luminous objects occur at higher redshifts, leaving the lower right corner largely empty. Note that here, and in what follows, we explicitly use an Einstein-de Sitter cosmology.
The source density in comoving coordinates is fixed, since we have simply evolved the local sample of sources in luminosity. The sources (shown by the point symbols in Fig. 3) would therefore only be detected in an enormous survey field. A dashed line represents the radio sensitivity limit of the VLA for hour integrations at GHz. Sources beyond the peak in our luminosity evolution function quickly traverse this radio limit and would not be detected either. The luminosity range of these sources spans = 10 to 12. For the luminosity evolution invoked in our model, all the sub-mm sources could evolve from such a local sample and be at redshifts 1–4.
The local source sample represents an average dust temperature of K (Dunne et al. 2000a). In Fig. 3c, we also evolve a subset of the local sources with cooler ( K – triangles) and hotter ( K – open circles) dust temperatures, keeping the 850m luminosity fixed. As demonstrated in Dale et al. (2001a,b), this is equivalent to fixing the mid-IR luminosity (m), but results in proportionately higher far-IR (hot dust) or lower far-IR (cool dust) sources. Therefore a sample of equivalently far-IR luminous sources with colder dust temperatures will be detected by SCUBA at much lower redshifts, and a less extreme luminosity evolution would be required to generate sources which lie in our sub-mm detection window mJy. The effect of moving to a flat cosmology, however, is to introduce a slope to the CMD which also has to be countered with luminosity evolution or colder sources to maintain sources in our detection window. However, the evolutionary effects are sufficiently strong that the precise cosmology adopted is relatively unimportant.
5. Modeling the evolving CMD relations
We now embark on more comprehensive models of our sub-mm/radio CMD and the trends observed in the previous sections. Our aim will be to simulate the properties of our data sample using a Monte Carlo approach, and to use this to focus on the evolutionary trends implied by the SCUBA data for the OFRS sample. The data we have do not justify embarking upon a detailed fitting of various model parameters. Rather we look at some examples of models which are motivated by fitting what is already known about local ULIRGs and distant SCUBA sources, and using these examples try to draw general conclusions. We start with simple step by step assumptions about the population and progress to more involved and (hopefully) realistic effects, taking careful note of the changes in the resulting CMD.
Monte Carlo simulations of the 850m/1.4 GHz CMD are first attempted by assuming a population of Arp220-like SEDs, equivalent in the far-IR/sub-mm regime to a greybody with dust temperature K and emissivity . Fig. 4a depicts an ensemble of such objects in the CMD, all having the same luminosity (approximately twice that of Arp220). The sources follow a Gaussian redshift distribution (indicated in the insets in Fig. 4) matched to the spectroscopically estimated distribution of Barger et al. (1999), thought to be plausible in light of recent Keck redshift measurements for sub-mm sources (Chapman et al. 2002b). The sources are color-coded by redshift as described in the figure caption, and represent density evolution of a single luminosity of source. This is effectively the opposite hypothesis to our toy model above, where the source density per comoving volume remained constant for all time, but evolved in luminosity. The corresponding track then traces this characteristic sub-mm galaxy as a function of redshift through the CMD. Note that beyond , the source is observed with approximately the same 850m flux density for the adopted cosmology, reflecting the favorable sub-mm -correction described above. However, redshifts map monotonically onto the 850m/GHz axis.
Since we know the local scatter in the 850m/GHz relation (as discussed in Section 4, see also Helou et al. 1995, Yun et al. 2001), we can introduce the assumption that this scatter remains constant and applies at all redshifts. We describe the relation as a Gaussian in the 850m/GHz ratio with an RMS scatter of 0.2 dex. The effect of the scatter of this relation on the CMD distribution is shown in Fig. 5b, distributing the single luminosity sub-mm family vertically. Without spectroscopic measurements, our current data cannot constrain the true evolution in the far-IR/radio correlation. Such information will have to await future redshift surveys of radio and sub-mm detected sources (e.g. Chapman et al. 2002b). At the moment assuming it is the same as the local relation is about the best that can be done.
We can alternatively impose a luminosity distribution on our ULIRG population, as represented in Fig. 4c. The bright SCUBA counts at 850m are well fit by a power law (e.g. Barger et al. 1999), and hence we first adopt a constant power law for our luminosity functions over all redshifts (shown in the lower insets in Fig. 4). This is probably a reasonable assumption for the bright sub-mm sources considered here. This therefore represents a null hypothesis for luminosity evolution. At this point, our radio survey completeness of Jy imposes a diagonal cut on the sources from the upper left corner of the CMD.
We can then combine both the farIR/radio scatter and luminosity function to create a candidate scenario for the CMD relation, as shown in Fig. 5d. Scatter in radio/far-IR relation has a skewed effect on the data compared to Fig. 5c, in the sense of pulling more high redshift objects downwards in the diagram. This can be understood as due to a selection bias associated with our radio threshold.
This scenario is clearly incompatible with our observed CMD, failing to reproduce the dearth of sources in the lower right corner of Fig. 1. What can we learn from the failure of this picture, to help understand how to recover the observational trend in the CMD? Firstly, the model consisted of no luminosity evolution with redshift, and a mild number density evolution governed by the imposed redshift distribution. As noted by Blain et al. (1999b,c), the extremely strong density evolution required to fit the 850m counts (following a form) will quickly overproduce the far-IR background. Boosting our present redshift distribution is not a viable modeling route.
The key to the problem lies in removing sources from the lower right corner, which do not exist at all in the observations, despite our apparent sensitivity to them. As discussed in the previous section, with our toy evolution of a local sample of IRAS galaxies, a reasonably strong luminosity evolution on its own is able to reproduce the general trend of the CMD. Several authors have recently modeled the evolution of dusty galaxies using pure luminosity evolution, reproducing the observed counts and backgrounds at both far-IR and sub-mm wavelengths (e.g. Blain et al. 1999b,c; Rowan-Robinson 2001; Xu et al. 2001). The CMD trend can be understood naturally in terms of luminosity evolution: more luminous objects occur at higher redshifts, thus leaving the lower right corner largely empty. We therefore turn to Monte Carlo simulations of pure luminosity evolution pictures, similar to the models of the above authors.
We must first consider carefully which local luminosity function to adopt. While many authors have adopted a local IRAS 60m luminosity function, Dunne et al. (2000a) have recently attempted to construct an 850m luminosity function directly from SCUBA measurements of the IRAS-BGS. Given that the bright end of the Dunne et al. function is still highly uncertain, we follow the lead of the previous modelers and work from the IRAS 60m function as presented in Saunders et al. (1990). We -correct to 850m with a single temperature greybody spectrum to match as closely as possible the Dunne et al. measurements at 850m (using , ).
We evolve the local luminosity function using . Our evolution function has a power law peak, out to (the consensus of the median redshift for SCUBA sources suggested by Archibald et al. 2001, Smail et al. 2000, Dunlop et al. 2001, Scott et al. 2001). Beyond the function drops again as . This power-law index is chosen based on evolutionary models fit to both optical and sub-mm wavelength data (Blain et al. 1999b,c). To retain the pure luminosity evolution, we truncate the evolved functions so that they integrate to identical numbers of sources per comoving volume, as depicted in Fig. 5.
We can then incorporate this luminosity evolution into our Monte Carlo models. We first introduce our luminosity evolution models into the CMD, without the radio/far-IR scatter for clarity (Fig. 6a). To illustration the total sample and the effect of radio pre-selection, we show all sources, but change the symbol size for the sources we can detect (large) and those that fall below our radio sensitivity (small). Again sources are color-coded by redshift. We now find a scenario which is consistent with the source distribution of our observed CMD, whilst simultaneously fitting the sub-mm through far-IR counts and backgrounds. When we bring in the radio/far-IR scatter (Fig. 6b), we see that the apparent selection bias effect is even larger than in our previous model (Fig. 4), scattering sources into the region which lies above the redshift for which a suitably scaled Arp220 SED would be detectable.
The reasonable match of this model with our measured CMD additionally suggests that there may be very high redshift () sources in our OFRS SCUBA sample. However, consideration of the radio undetected sources in the CMD plane indicates that the maximum luminosity for which we detect sources in the sub-mm and radio represents the peak in the adopted evolution function – sources lying at higher redshifts are necessarily less sub-mm luminous. Our present model represents the maximum amount of luminosity evolution that can be accommodated in such a peak model using the K SED template without overproducing the 850m counts (effectively the far-IR background). With cooler dust temperatures, less severe luminosity evolution is able to reproduce our observed CMD.
6. Selection function and models
6.1. The radio selection function
Having reproduced our observed CMD data set with a scenario consistent with galaxy counts at a variety of far-IR and sub-mm wavelengths, we are now able to better understand our radio selection function relative to the modeled CMDs.
We can take our model and derive predicted versus measured counts (Fig. 7) and redshift distributions (Fig. 8). With our adopted scatter of 0.2 dex in the farIR/radio correlation, we recover a large percentage of the sub-mm counts brighter than mJy, falling to a 50% recovery rate by mJy. This appears to be less than the recovery rate quoted in BCR and C01. A simple explanation for this discrepancy is that our Monte Carlo model gives sources with an infinite effective signal to noise, while the actual data at the mJy level is barely significance. The steep luminosity function therefore results in a large Eddington bias, scattering many sources into our detected catalog, and making up an apparent excess of source counts in the mJy bin.
Our modeling results have demonstrated that a simplistic estimate of the radio pre-selection function based on redshifting a single ULIRG falls short of the true picture. Considering the entire population of IR-luminous sources, evolving in one of several plausible scenarios consistent with our CMD and the 850m counts, it appears that higher redshift sources will scatter into our detection window. Such high- objects appear to comprise a significant fraction of our brightest sources, consisting of 20% of the mJy detections. Our analysis of the Monte Carlo modeled source count and redshift distribution recovery therefore suggests that we look at direct comparison with the measured blank field sub-mm properties presented in BCR, C01, and Chapman et al. in preparation.
In Fig. 7b we plot the integrated source counts estimated from our optically faint radio source sample (filled symbols, with error band). A fit to the blank field sub-mm survey counts from BCR and Eales et al. (2000) are also shown by the dotted line, and the cluster lensing survey counts of Blain et al. (1999a) and Chapman et al. (2002c) by crosses and stars, respectively. The effective volume of our survey is difficult to estimate, as the radio sensitivity falls off with radius from the field center. This issue has been quantified carefully in C01 (and will be discussed further in Chapman et al. in preparation). Since objects were chosen randomly, we use the visibility function to construct the count, as discussed in these papers.
The fraction of sources recovered is clearly high, although the brighter counts are still not very well constrained. While the mJy counts are well determined to be 3000–4000/deg2, brighter than mJy it is not clear how steeply the counts falls. A recent measurement from Borys et al. (2001) for sources brighter than mJy in the extended HDF is also plotted, with a square. This suggests our OFRS recovery rate is about 60%.
Our modeling analysis lead us to a count recovery rate perhaps as high as 70%, in the absence of large-scale structure effects. This seems plausible, both from the direct analysis of the counts comparison (Fig. 7b) and from the sources which we know to be missing from the OFRS pre-selection: the % optically brighter sources at all redshifts, and the remaining sources at redshifts too high to be detected in the radio. This is also in agreement with the direct comparisons of blank field SCUBA surveys with those sources recovered in the radio from the same fields (Borys et al. 2001, Smail et al. 2001, C01). At the faint end of the counts (Fig. 7b), our pre-selected sources appear to fall significantly short of the full source counts. This was already evident in our modeling of the recovery rate (Fig. 7a), where only % were detected at the current radio depths by mJy.
In Fig. 8, we focus on the redshift information gleaned from the 850m/GHz estimators compared to the true distribution. We take two flux cuts on the modeled 850m data and over-plot the true redshift distribution (green/dashed histogram) on that obtained by directly applying the 850m/GHz redshift estimator to the total population (red/solid histogram) and the radio detected sub-population (blue inset histogram). Fig. 8a depicts a mJy cut, corresponding roughly to the sensitivity of our SCUBA OFRS survey, while Fig. 8b presents a mJy cut, comparable to the deepest observations obtainable with SCUBA. Clearly in the absence of 850m/GHz scatter, we recover the true redshift distribution. Introducing the scatter results in a broadening and skewing of the distribution, as a result of the strong luminosity evolution adopted in our model. The radio selection (blue inset histogram) results in a bias, whereby objects at higher redshift, beyond the peak in our evolution function , are scattered into our radio detection window. However, these appear as an excess of sources, having been scattered down from the large population with ever decreasing characteristic luminosity ( in our luminosity functions). The excess of measured high- sources arises simply from the intrinsic scatter in the 850m/GHz relation, broadening the peak in our evolution function, . These features must be ubiquitous in any realistic evolutionary model which rises in luminosity to a peak redshift and then declines to even higher redshifts.
These biases are quantified by comparing the actual redshift distribution recovered by the radio selection (blue histogram) to the recovery in the absence of scatter in the far-IR/radio relation (Figs. 8c,d). In our mJy flux cut, we recover an excess of sources for all but recover a deficit of sources from . Our radio selected survey is therefore less complete at than we would have naively expected based on the redshift at which Arp220 is no longer detectable in the radio. This is important for spectroscopic follow-up of these samples (Barger et al. 1999, Ivison et al. 2000, Chapman et al. 2002b). In Figs. 8e,f, we also plot the residuals, as an estimate of the errors involved in both the intrinsic radio selection and the 850m/GHz estimator. The dashed line (green) shows the residuals of those radio detected sources with an 850m/GHz estimated redshift distribution compared with the true total distribution. The solid line (yellow) shows the true redshifts of the radio selected sources from the total distribution. Finally the light solid line (blue) shows the difference in the 850m/GHz estimated redshift from the true redshift for the radio selected sources alone.
In Fig. 9, we plot the 850m/GHz estimated redshift distribution for the actual SCUBA observed sources in our sample, using the same Arp220 template SED used in the models to derive redshifts. Utilising a template with cooler dust would of course result in lower redshift estimates.
6.2. The optical selection function
The optical selection function rejects any optically brighter sub-mm sources, which comprise % of the Smail et al. (2000) sub-mm survey. A constant optical limit () in the absence of evolution would select more obscured sources at lower redshifts. However, Adelberger & Steidel (2000) and Chapman et al. (2002d) have suggested that star-bursting sources appear less obscured at higher redshifts, counteracting the effect of cosmological dimming. In fact a constant optical limit may produce the most uniform sample of sources across the –3 range.
The majority of the high redshift ULIRG population, as detected by SCUBA, has been demonstrated to be optically faint, typically with , (BCR; C01; Smail et al. 2001; Chapman et al. 2002a). Obtaining their redshift distribution is crucial for constraining their evolution and most importantly for placing them in their cosmological context amongst the hegemony of other galactic denizens (e.g. Blain et al. 1999b,c). With typical magnitude of , however, present generation telescopes are hard pressed to routinely measure redshifts for such distant, faint and highly obscured galaxies. This is particularly disappointing given that accurate redshifts are essential for obtaining CO observations of these gas-rich galaxies. The OVRO observations presented by Frayer et al. (1998, 1999) and Chapman et al. (2002e – the SA22 Ly blob) of three SCUBA galaxies demonstrate the important physical information that can be obtained if accurate redshifts are available.
Fortunately, around 10% of the SCUBA-detected galaxies are unambiguously identified with relatively bright () counterparts (the class 2 sources in the nomenclature of Ivison et al. 2000, a class which includes the two systems targeted by Frayer et al.). Such galaxies are spectroscopically observable with 10m-class telescopes and so could offer one route to estimating the redshift distribution of the population as a whole. However, we first have to address the question of the relevance of these optically brighter cousins to the bulk of the SCUBA population with optically faint counterparts – are the class 2 galaxies representative of the whole or are they an unrelated population, or perhaps a different episode in the evolutionary sequence?
We have shown some evidence that in fact the optically ‘brighter’ sub-mm sources may in fact be representative of the larger optically faint population (Fig. 1) – the CMD reveals that optically brighter galaxies are scattered uniformly amongst the fainter population.
At least in part this effect may be explained because some systems may comprise both obscured and unobscured interacting components, e.g. SMM14011 from Ivison et al. (2000) and MMD11 from Chapman et al. (2000,2002f) – merging systems with the bulk of the sub-mm emission arising in one galaxy component, while the optical emission remains unobscured in an associated component. Equivalently the two ‘components’ may be mixed up within a single galaxy, through patchy dust and star-formation. Our radio-selection of optically faint sub-mm sources is blind to these possibilities, and optically brighter sources are often located very nearby the radio position. In other cases the galaxy may simply have substantial outflows which have expelled dust along prefered viewing directions, allowing a view through the veil.
7. The 450m detections and the color-color relation
Many of our sources are also detected at 450m, which allows for the possibility of improving the constraints on evolutionary properties for the sample. We have extracted 450m flux densities from the models of Fig. 6 and and plotted CMD and color-color diagrams in Fig. 10, along with the 850m/radio CMD (reproduced without the confusion of sources falling beneath our radio limit). In this figure the the redshifts of the sources are mapped onto a continuous color code, represented by the bar in Fig. 10.
While some of the sources are only marginally detected at 450m, the firm detections obtained at 850m and at GHz lend support to their reality. We focus on the 19 sources with 450m flux detected at greater than 2. These data are presented in Fig. 11, where we plot both a 450m/850m CMD and a 450m/850m versus 850m/GHz CCD. The envelopes of our Monte Carlo models are shown as dashed lines. For comparison, we also plot the 5 sources from the Smail et al. (2001) sample detected at 450m, and the single source from Eales et al. (2000) by triangles and squares, respectively. The average (inverse variance weighted) signal at 450m of the 850m detected sources is mJy, consistent with a population with median and our adopted dust parameters.
An additional consideration for 450m observations is the increased instability in the sky opacity at this shorter wavelength, and the larger effect of extinction corrections as a consequence, leading to possibly larger flux uncertainties than naively estimated. The importance of such effects was discussed recently by Dunne & Eales (2001) for a sample of local galaxies measured at 450m. We obtained calibration maps for our data at 6 hour intervals on average, and the data were all taken near the middle of the night where the measured gains at 450m are far more stable than at the extremities of the night. While the absolute calibration is therefore not necessarily the dominant error on our measured flux densities, the current inability to measure atmospheric opacity rapidly during observations precludes calibrating the data to better than 20%, and we adopt this as our nominal calibration error.
Recall that locally (Section 4), the luminous IR sources have a relatively tight 450m/850m correlation, but a much larger scatter in 100m/850m and 60m/850m, the latter two being closer in rest wavelength to 450m in our highest redshift SCUBA sources. Therefore, the relatively flat relation of 450m/850m with 850m flux observed for our OFRS SCUBA observations is suggestive of a sample which is relatively uniform in dust properties. The Smail et al. (2001) sources have amongst the lowest 450m/850m ratios, which could be consistent with redshift effects dominating their sub-mm ratios. Our selection bias to lower redshift sources is much stronger than in their blank field survey due to the negative sub-mm -correction. However, the large error bar on our measurements, and the associated strong Eddington (noise) bias from selecting all sources with is also likely to be a factor. The correlation of 850mto GHz fluxes, coupled with the skewed detection of higher redshift sources from the Eddington bias, results in an even tighter relation in the 450m/850m versus 850m/GHz color-color space.
If the higher redshift sources are the most luminous, as suggested by the correlation in 850m versus GHz fluxes, we expect a smaller 450m/850m with increasing 850m flux, a result of the increasing redshift. However, we also expect brighter sources to have hotter dust, based on the local IRAS correlation, resulting in a larger 450m/850m ratio with increasing 850m flux. These two effects will therefore partially cancel in the 450m/850m versus 850m CMD, resulting in a flat relation.
A scenario with no variation in dust properties or luminosity evolution could also produce such a flat relation. The spread in 450m/850m would then be simply a result of the redshift distribution of objects with identical dust properties. However, the radio/sub-mm correlation introduces either luminosity evolution or dust correlation with luminosity. The flat relation must therefore be the result of some intrinsic property.
Our current data do not allow robust constraints on situations where either the dust properties evolve with redshift (e.g. temperature increasing with redshift), or the population has a larger spread in dust properties with increasing redshift. While the conditions were generally rather poor at 450m during our JCMT runs, the 850m detected sources are mostly luminous enough to be detectable with SCUBA at 450m under more favorable conditions. Better 450m data would certainly improve the constraints on models.
8. Discussion
8.1. Density evolution and the nature of sub-mm galaxies
Studies of hierarchical galaxy formation pictures suggest that significant density evolution must occur (e.g. Cole et al. 2000, Blain et al. 1999c). Successful multi-wavelength evolutionary scenarios have already been explored within this paradigm (e.g. Blain et al. 1999c). However the question for our purposes concerns the significance of merging sub-fragments for the 15 arcsec scales probed by the SCUBA beam. The SCUBA sources seem likely to trace the merger events themselves rather than the fragments coming together before merging (and perhaps surviving afterwards without any significant far-IR emission). Therefore pure luminosity evolution is not necessarily a poor model for the bright end of the SCUBA counts. The situation described above for optically bright versus faint SCUBA sources is also relevant here – luminous sources may sometimes pair with a merging optically bright source, or a snapshot in the merger sequence may have optically luminous and dust-enshrouded parts.
Number evolution, however, is not only driven by merging. The SCUBA-bright population (if driven by star formation) may represent a transitory stage in a galaxy’s evolution, possibly related to the AGN phenomenon (e.g. Lewis & Chapman 2002, Archibald et al. 2001).
The effect of currently fashionable flat, cosmologies is to make the situation worse by introducing a slope to the color-magnitude plot, which also has to be countered with luminosity evolution. This would require even stronger evolution than the adopted in our present study, assuming the characteristic dust temperature of the sources is unchanged. An alternative would be to bring in an additional density evolution component. We have certainly not demonstrated that our particular model is a unque solution. But it seems that strong luminostity evolution is a requirement of an successful model.
8.2. The nature of the sources and future work
The fainter sub-mm sources, marginally detected at 2–mJy, clearly follow the observed and modeled CMD trend. This suggests that pursuing these candidate fainter sources with deeper SCUBA integrations could yield significant detections, providing a valuable lever arm in luminosity for modeling the evolutionary properties of the sample. The most luminous Lyman-break galaxies (LBGs) are known to emit at the 1–mJy level (Chapman et al. 2000,2002d; Peacock et al. 2000), so their –2 counterparts probably contribute some fraction of these fainter sub-mm sources. This is consistent with the high SFR deduced by Steidel et al. (1999), who apply a large dust correction to their results.
Note that whether or not a source has an AGN may not have a tremendous influence on its position in the CMD, especially if the energetics are still dominated by star formation. It has also been pointed out many times (e.g. Sanders 2001) that AGN and star-bursts are both related to merging, and so AGN and star-bursts could be the same objects caught at different evolutionary phases. In that case many of the correlations between fluxes at different wavelengths may continue to hold, at least for weak AGN.
Ho et al. (2000) have investigated the strength of the radio synchrotron emission from Seyferts and LINERs locally. The radio-loud AGN effect on the CMD is to lower points (brighten the radio), which cannot easily be compensated for by other properties, dust temperature for example. This suggests further that it is unlikely that radio-loud AGN dominate the sub-mm luminous sources. One source from Smail et al. (2001), which has been identified with an AGN component inhabits the lower cut-off region of the CMD, suggesting that this region may in general be inhabited by those sub-mm sources with stronger AGN components (a stronger AGN radio source). However, SMM14011 (Ivison et al. 2000), which has been confirmed spectroscopically as a star-forming galaxy, also inhabits this region, and we can draw no firm conclusions that AGN show their presense in any obvious manner in our CMD or color-color diagnostics.
Future work identifying the actual counterparts at multiple optical wavelengths, as well as obtaining a larger sample of radio sources with SCUBA measurements (both optically bright and faint) will lead to substantial refinement of our understanding of these issues. Higher spatial resolution HST observations may also elucidate the morphologies of the sources, allowing an understanding of how the radio/sub-mm emission is traced by the optical, and where the heart of the far-IR energy is generated in high redshift objects. Deeper sub-mm observations of the sub-mm faint radio sources will allow us to place them in context relative to the sub-mm bright radio sources.
9. Conclusions
We have presented a large sample (55) of sub-mm sources with radio and optical counterparts. We observe a correlation between the sub-mm flux and the sub-mm/radio which implies that higher redshift sources must be more luminous. Local correlations in the radio/sub-mm/far-IR properties of luminous infrared galaxies provide a benchmark for assessing the trends observed in our higher redshift analogs. In particular, the effects of dust temperature on our evolutionary scenario can be directly assessed. Using a Monte Carlo approach to model the evolution of the IR luminous galaxies, we are able to simultaneously represent the CMD, counts and sub-mm/radio implied redshift distribution for our observed sample. Our models are not unique, but indicate some general features which any successful model must possess, in particular this strong luminosity evolution.
The selection function from sub-mm follow-up to optically faint radio can be better understood in relation to our Monte Carlo models. There are inherent biases in the technique beyond that expected from a naive redshifting of the Arp220 SED out to redshifts where it is no longer detectable in the radio. The combination of radio/far-IR scatter and the necessary rise and fall in the evolution function results in a bias in the selection of sources (if we were able to obtain spectroscopic redshifts for the entire sample). We uncover an excess of high redshift sources and lose some of the lower redshift sources that would otherwise be present in our selection window. In the absence of spectroscopic redshifts, the reconstruction of the redshift distribution is broadened and weighted towards lower redshifts. The few optically bright sub-mm sources in our sample are distributed uniformly throughout the CMD with no prefered locus. This suggests that spectroscopic follow-up of the optically brighter population may provide a reasonable approximation to the true redshift distribution.
This redshift distortion presents the possibility of a population of very high redshift () star forming galaxies being detected with our radio selection approach. With current radio flux limits, the required luminosities are too large to be included in our sample for under the assumptions of our present model.
A subsample of 25 sources in our sample are marginally detected in the 450m band. When compared to local IRAS galaxies, these suggest a similar range in dust properties to local ULIRGs, possibly with somewhat hotter or more emissive dust.
Acknowledgements
We thank the staff of the JCMT, for their assistance with the observations. The referee, C.Carilli, has helped us to improve the final version of this paper. A special thanks to R. Ivison, I. Smail, A. Blain, and L. Dunne for helpful discussions on this work. We gratefully acknowledge support from NASA through HST grant 9174.1 (SCC) and Hubble Fellowship grant HF-01117.01-A (EAR) awarded by the Space Telescope Science Institute, which is operated by the Association of Universities for Research in Astronomy, Inc., for NASA under contract NAS 5-26555. GFL thanks the Australian Nuclear Science and Technology Organization (ANSTO) for financial support. DS and CB are supported by the Natural Sciences and Engineering Research Council of Canada.
references
Adelberger, K., Steidel, C., 2000, AJ, 119, 2556
Archibald, E., et al., 2001, MNRAS, 323, 417
Barger., A., Cowie, L., Mushotzsky, R., Richards, E., 2001a, AJ, 121, 662
Barger, A., et al., 2001b, ApJ, in preparation
Barger, A., et al., 2001c, ApJ, in press
Barger, A., Cowie, L., Richards, E., 2000a, AJ 119, 2092 (BCR)
Barger, A., et al., 1999, AJ 117, 2656
Barger, A., et al., Nature, 1998, 394, 293
Bertoldi, F., et al., 2000, A&A, 360, 92
Blain, A., 2000, MNRAS, 309, 955
Blain, A., et al., 1999a, ApJL, 512, 87
Blain, A., et al., 1999b, MNRAS 302, 632
Blain, A., et al., 1999c, MNRAS, 309, 715
Blain, A., 1999, MNRAS, 309, 955
Borys, C., Chapman, S.C., Scott, D., Halpern, M., 2001, MNRAS, in press
Borys, C., Chapman, S.C., Scott, D., 1998, MNRAS 308, 527
Carilli, C., Yun, M., 2000, ApJ 530, 618
Carilli, C., Yun, M., 1999, ApJ 5130, 13L
Chapman, S.C., Richards, E., Lewis, G.F., Wilson, G., Barger, A., 2001a, ApJL, 548, 147 (C01)
Chapman, S.C., et al. 2002a, ApJ, in preparation
Chapman, S.C., et al. 2002b, ApJL, in preparation
Chapman, S.C., Scott, D., Borys, C., Fahlman, G., 2002c, MNRAS, in press
Chapman, S.C., et al. 2002d, MNRAS, submitted
Chapman, S.C., et al. 2002e, ApJL, in preparation
Chapman, S.C., et al. 2002f, ApJL, submitted
Chapman, S., Scott, D., Steidel, C., et al., 2000, MNRAS, 319, 318
Cole, S., et al., 2000, MNRAS, 319, 168
Connolly, A., et al., 1997, ApJ 486, L11
Condon, J., Helou G., Sanders D., Soifer, B., 1996, ApJS, 103, 81
Condon, J., 1992, ARA&A, 30, 575
Dale, D., et al., 2001a, ApJ, 549, 215
Dale, D., et al., 2001b, ApJ, submitted
Dunlop, J., 2001, FIRSED2000 conference proceedings, eds. I.M. van Bemmel, B. Wilkes, & P. Barthel, Elsevier New Astronomy Reviews
Dunne, L., et al., 2000a, MNRAS, 319, 813
Dunne, L., et al., 2000b, MNRAS, 315, 115
Dunne, L., Eales, S., 2001, MNRAS, in press
Eales, S., et al., 2000, AJ, 120, 2244
Fixsen, D.J., et al., 1998, ApJ, 508, 123
Fomalont, E., et al., 2002, ApJ, in press
Frayer, D., et al., 1999, ApJ 514, L13
Frayer, D., et al., 1998, ApJ 506, L7
Hauser, M., et al., 1998, ApJ, 508, 25
Helou, P., et al., 1985, ApJ 440, 35
Ho, L., Peng, C.Y., 2001, ApJ, 555, 650
Holland, W., et al., 1999, MNRAS 303, 659
Ivison, R., et al., 2000, MNRAS, 315, 209
Lewis, G., Chapman, S.C., 2000, MNRAS, 318, 31L
Lewis, G., Chapman, S.C., 2002, MNRAS, submitted
Peacock, J., et al., 2000, MNRAS, 318, 535
Puget, J.-L., et al., 1996, A&A 308, L5
Richards, E., 2000, ApJ 533, 611
Richards, E., et al., 1999, ApJ 526, 73L
Rowan-Robinson, M., 2001, ApJ, 549, 745
Sanders, D.B., 2001, ‘QSO Hosts and their Environments’, in press, astro-ph/0109138
Saunders, R., et al., 1990, MNRAS 257, 425
Scott, D., et al., 2000, A&A 357, L5
Scott, S., et al., 2001, submitted
Smail, I., et al., 2001, ApJ in press
Smail, I., et al., 2000, ApJ 528, 612
Smail, I., et al., 1999, MNRAS, 308, 1061
Smail, I., Ivison, R.J., Blain, A.W., 1997, ApJ 490, L5
Steidel, C., Adelberger, K., Shapley, A., Dickinson, M., Pettini, M., Giavalisco, M., 2000, ApJ, 532, 170
Steidel, C., Adelberger, K., Giavalisco, M., Dickinson, M., Pettini, M., 1999, ApJ 519, 1
Xu, C., et al., 2001, ApJ, submitted
Yun, M., Reddy, N., Condon, J., 2001, ApJ, 554, 803
![[Uncaptioned image]](/html/astro-ph/0111157/assets/x2.png)
![[Uncaptioned image]](/html/astro-ph/0111157/assets/x3.png)
![[Uncaptioned image]](/html/astro-ph/0111157/assets/x4.png)
Local CMD and color-color relations for IRAS luminous galaxies. Upper left: CMDs for 19 galaxies observed at 850m and 450m by Dunne & Eales (2001), with L850 in units of L⊙. Dashed lines represent the scatter about the best-fit relations (solid lines). Upper right: Color-color diagrams (CCDs) for these same 19 galaxies. Rather steep power law correlations are observed in the 100m/850m and 60m/850m versus 850m/GHz diagrams (with indices -0.63 and -1.03 respectively), while the 450m/850m relation remains flat. Lower Color-color diagrams for the larger IRAS sample from Dunne et al. (2000a) having only 850m follow-up.
| relation | slopea | log(-intercept)b | scatter (dex)c |
|---|---|---|---|
| 100m/850m vs 850m | 0.13 | 0.97 | 0.16 |
| 60m/850m vs 850m | 0.27 | 0.26 | |
| 450m/850m vs 850m | 1.45 | 0.07 | |
| 850m/GHz vs 850m | 1.04 | 0.19 | |
| 100m/850m vs 850m/GHz | 2.30 | 0.12 | |
| 60m/850m vs 850m/GHz | 2.25 | 0.21 | |
| 450m/850m vs 850m/GHz | 0.06 | 0.87 | 0.07 |
| 100m/850m vs 850m/GHzd | 2.23 | 0.13 | |
| 60m/850m vs 850m/GHzd | 2.08 | 0.22 |
References. — Data taken from Dunne et al. (2000a) and Dunne & Eales (2001).
power law slope index .
the log of the power law coefficient in
scatter in power law fit to the data measured in dex
fits to 121 galaxies having only 850m flux densities from Dunne et al. (2000a) rather than the 19 from Dunne & Eales (2001) with additional 450m measurements.
![[Uncaptioned image]](/html/astro-ph/0111157/assets/x5.png)
![[Uncaptioned image]](/html/astro-ph/0111157/assets/x6.png)
![[Uncaptioned image]](/html/astro-ph/0111157/assets/x7.png)
Upper left: The 19 IRAS sources from Dunne & Eales (2001), shown at by the points, have been redshifted, as indicated by the circles. Flux densities are calculated using the locally estimated luminosties using an cosmology. Beyond the sources retain approximately the same observed flux density, whilst increasing in 850m/radio as a function of redshift (i.e. moving vertically on the plot). Upper right: Evolution of the galaxies in luminosity, scaling by out to , in an attempt to match our observed CMD from Fig. 1. Conversion from luminosity to flux density space, results in the sources traveling roughly along the suggested CMD correlation, but then turning above our radio limit (dashed line) beyond the peak in the adopted luminosity evolution at . Lower panel: Evolution of a subset of the local sources with cooler ( K – triangles), medium ( K – open circles: the mean dust temperature from Dunne et al. 2000a) and hotter ( K – open circles) dust temperatures. The 850m luminosity is kept fixed here.
![[Uncaptioned image]](/html/astro-ph/0111157/assets/x8.png)
![[Uncaptioned image]](/html/astro-ph/0111157/assets/x9.png)
![[Uncaptioned image]](/html/astro-ph/0111157/assets/x10.png)
![[Uncaptioned image]](/html/astro-ph/0111157/assets/x11.png)
Monte Carlo simulations of the 850m/1.4 GHz CMD, showing the null hypothesis for pure luminosity evolution. upper left: A population of ULIRG galaxies with about twice the luminosity of Arp220 is plotted, following a Gaussian redshift distribution (shown in the inset). The cyan, blue, green and red color bands correspond to , , , and respectively. The corresponding track through the CMB shows the redshift spread of galaxies of fixed luminosity and SED. This becomes vertical at high , but redshifts are mapped one-to-one onto a specific value of /. upper right: Now we introduce a spread in the / ratio, corresponding to the locally observed scatter as measured in Table 1. lower left: Imposing a luminosity distribution on our ULIRG population, represented here simply as a power law (shown in the second inset), is probably a reasonable assumption for the bright sources considered here. At this point, the radio survey limit imposes a diagonal cut out of the upper left corner of the CMD. lower right: The effects of redshift distribution, sub-mm/radio scatter, and luminosity function are combined to create a possible realization for the CMD relation. This scenario is clearly incompatible with our observed CMD.
![[Uncaptioned image]](/html/astro-ph/0111157/assets/x12.png)
The luminosity functions adopted in our Monte Carlo models are presented, taking the form of the local IRAS 60m function (Saunders et al. 1990) mapped to 850m using the best fit dust temperature and emissivity from Dunne et al. (2000a). The evolution is pure luminosity, taking the form , consistent with the Blain et al. (1999a) modeling results. Beyond the evolution falls with a form . The lines are color coded by redshift as noted in the figure. Note that the truncation of the function at low luminosities is irrelevant for the flux densities probed by SCUBA.
![[Uncaptioned image]](/html/astro-ph/0111157/assets/x13.png)
![[Uncaptioned image]](/html/astro-ph/0111157/assets/x14.png)
Monte Carlo models including luminosity evolution. upper: Simulation of the 850m/GHz CMD, but without the sub-mm/radio scatter for clarity. For illustration of the total sample and the effect of radio pre-selection, we show all sources, but those we can detect have larger symbols. The distribution of detectable sources is qualitatively similar to our observed CMD. Redshifts are color-coded: red ; green –2; blue –3; magenta –4, cyan . lower: Scatter in the sub-mm/radio relation is now added. The source density for mJy matches that of our observed CMD.
![[Uncaptioned image]](/html/astro-ph/0111157/assets/x15.png)
![[Uncaptioned image]](/html/astro-ph/0111157/assets/x16.png)
Upper panel: Differential source counts extracted from our Monte Carlo simulations. By binning the sources from our CMD as a function of , we can recover the total source counts, as well as the fraction detected in the radio. The solid red line represents the power law fit to the blank field sub-mm source counts (Barger et al. 1999), while the dashed magenta line represents a fit to the bright end of the lensed counts of Blain et al. (1999) and Chapman et al. (2002c). The histograms represent the total modeled counts (solid), the radio detected counts (dashed), and the radio undetected counts (dotted). With our adopted scatter of 0.2 dex in the sub-mm/radio correlation, we recover a large percentage of the sub-mm counts brighter than 10 mJy, falling to a 50% recovery rate by mJy. Lower panel: The integrated source counts estimated from our OFRS sample, shown by filled symbols, with estimated error band. Also plotted is the fit to blank field sub-mm survey counts of Barger et al. (1999) and Eales et al. (2000), shown by the dotted line, and the lensing amplified survey counts of Blain et al. (1999) and Chapman et al. (2002c), shown as crosses and stars respectively. A recent measurement in the extended HDF region for sources brighter than mJy is shown by the square. The fraction of sources recovered is clearly high.
![[Uncaptioned image]](/html/astro-ph/0111157/assets/x17.png)
![[Uncaptioned image]](/html/astro-ph/0111157/assets/x18.png)
![[Uncaptioned image]](/html/astro-ph/0111157/assets/x19.png)
![[Uncaptioned image]](/html/astro-ph/0111157/assets/x20.png)
![[Uncaptioned image]](/html/astro-ph/0111157/assets/x21.png)
![[Uncaptioned image]](/html/astro-ph/0111157/assets/x22.png)
Top row: The modeled redshift distributions extracted from our Monte Carlo simulations. Green histograms (dashed lines) represent the input redshift distribution of the sources, while the distribution as measured from the 850m/GHz ratio is plotted as the blue/red histograms (solid lines). The blue shaded inset in the latter case represents the fraction of sources recovered from the radio pre-selection. The distribution measured from the 850m/1.4 GHz (including 0.2 dex scatter) is flattened and also broader than the true distribution. There is an excess of sources it lower redshift, and also an excess of high- sources, arising simply from the intrinsic scatter in the 850m/GHz relation, which broadens the peak in our adopted evolution function. Middle row: The actual redshift distribution recovered by the radio selection (blue histogram) compared to the recovery in the absence of scatter in the far-IR/radio relation. In our mJy flux cut, we recover an excess of sources for all , but recover a deficit of sources from . Our radio selected survey is therefore less complete at than we would have naively expected. Bottom row: The residuals as an estimate of the errors involved in both the intrinsic radio selection and the 850m/GHz estimator. The dashed line (green) shows the residuals of the radio detected sources with a 850m/GHz estimated redshift distribution, compared with the input distribution. The solid line (yellow) shows the true redshifts of radio selected sources relative to the total distribution. The light solid line (blue) shows the difference in the 850m/GHz estimated redshift from the true redshift distribution for the radio selected sources alone.
![[Uncaptioned image]](/html/astro-ph/0111157/assets/x23.png)
The estimated redshift distribution for SCUBA detected and undetected radio sources in our sample. We plot the histogram with a dashed (blue) line for radio sources detected in the sub-mm above a limit. We also plot the distribution for all sources with (solid line, red histogram). Sources with are shown with a light solid line (green), suggesting a tail of faint sub-mm sources extending to redshifts comparable to those spanned by the sub-mm detected sample. This 850m/GHz constructed redshift distribution is matched by our Monte Carlo simulations (compare Fig. 8).
![[Uncaptioned image]](/html/astro-ph/0111157/assets/x24.png)
450m band estimates can be extracted directly from our models, which effectively use a single dust temperature of K with an emissivity of . The model sources are color coded by redshift as indicated on the bar at lower right. The upper left plot is the versus CMD. The main variable affecting the 450m/850m ratio is the redshift, higher redshift sources having lower ratios. The upper right plot shows the versus color-color diagram, which appears similar to the CMD, although somewhat tighter as a result of the relation between and , which we plot in the lower left panel.
![[Uncaptioned image]](/html/astro-ph/0111157/assets/x25.png)
![[Uncaptioned image]](/html/astro-ph/0111157/assets/x26.png)
19 sources 450m flux density detected at 2. A representative error-bar for our detected sample is displayed in the lower left corner. The upper panel shows the / versus CMD, with all sources undetected at 450m presented as 2 upper limits. Dashed lines indicate the envelope of our models. The lower panel presents the / versus / color-color diagram. The results from our single (50 K) dust temperature model are overlaid as an envelope defining the region of detected sources from Fig. 10. The measured sources are consistent within of the envelope, but on average have a higher 450m/850m value. The sources from the Smail et al. (2001) catalog (triangles) and the source from Eales et al. (2000) (square) lie near the lowest values of 450m/850m that we find from the OFRS sample (red circles). Given the relation between / and , the color-color plot is similar to the CMD. The source positions are rearranged in the color-color plot, suggesting that the 850m luminosities are somewhat independent of redshift.