Measurement of the Cosmic-Ray Antiproton to Proton Abundance Ratio
between 4 and 50 GeV
Abstract
We present a new measurement of the antiproton to proton abundance ratio, , in the cosmic radiation. The HEAT-pbar instrument, a balloon borne magnet spectrometer with precise rigidity and multiple energy loss measurement capability, was flown successfully in Spring 2000, at an average atmospheric depth of 7.2 g/cm2. A total of 71 antiprotons were identified above the vertical geomagnetic cut-off rigidity of 4.2 GV. The highest measured proton energy was 81 GeV. We find that the abundance ratio agrees with that expected from a purely secondary origin of antiprotons produced by primary protons with a standard soft energy spectrum.
pacs:
95.85.Ry, 96.40.DeAntiprotons constitute a rare but interesting component of the cosmic radiation. They are secondary cosmic-ray particles, generated in nuclear interactions of high-energy cosmic rays with the interstellar medium (ISM). It remains an open question whether there are significant additional contributions that have a different and perhaps more exotic origin. The kinematic threshold energy for production in p-p collisions of primary cosmic-ray protons causes a energy spectrum, and a intensity ratio, that decline rapidly from a few GeV towards lower energies. Solar modulation inside the heliosphere softens this ‘cutoff’ and leads to uncertainties in the predicted flux at low energy. Additional sources of antiprotons might be evaporating primordial black holes (PBH), or annihilating supersymmetric particles. The PBH contribution would be expected to be significant at energies well below 1 GeV, while supersymmetric particle annihilations, for instance neutralinos, could also affect the antiproton intensity at higher energy, above several GeV. At those higher energies, the energy spectrum will be essentially unaffected by uncertainties due to solar modulation.
The energy spectrum of antiprotons measured near Earth carries the imprint of losses during propagation through the Galaxy and thus, is a sensitive probe of the confinement environment of protons. For instance, if the propagation path length and the diffusion coefficient for protons depended on energy E in the same way as has been observed for the heavy cosmic ray nuclei (i.e. ), one would expect the antiproton fraction to gradually decrease with increasing energy above a few GeV. This behavior would be equivalent to that of the intensities of secondary spallation nuclei such as Li, Be, and B, relative to those of their heavier primary parents C and O. In order to obtain a self-consistent model of the propagation of protons in the Galaxy the observed spectrum must also be compared with measurements of positrons and gamma rays, which also result from nuclear interactions in the ISM (mostly via and decay).
It would be difficult to explain if the antiproton fraction were found to be constant or if it increased at higher energy. Models of extragalactic origin are unlikely because of constraints in intergalactic transport Adams et al. (1997). Closed Galaxy models have been suggested Peters and Wetergaard (1977) which would boost the ratio at high energy, but these would also predict a higher abundance of He3 than has been observed Beatty et al. (1993); Reimer et al. (1998). It has been proposed that the primary proton spectrum in distant regions of the Galaxy is harder than locally observed Moskalenko et al. (1998). This would also lead to enhanced production in these regions, although not necessarily to an enhanced fraction near Earth. Thus it appears that a constant or rising fraction might indeed require the presence of a primary and possibly exotic source of antiprotons.
Observationally, the situation has been unclear. Measurements at low energies, in particular the series of observations with the BESS instrument Orito et al. (2000); Maeno et al. (2000), have provided the energy spectrum with good statistical accuracy from 0.2 to 3 GeV. These results are in good agreement with interstellar secondary production models. PBH contributions, if they exist, are hidden by the uncertainties due to solar modulations. Above 5 GeV, the results reported in the three previous measurements Mitchell et al. (1996); Hof et al. (1996); Boezio et al. (1994, 2001) are statistics limited, and no solid conclusion about the shape of the energy dependence of the antiproton fraction can be drawn. The current HEAT-pbar experiment has been developed to clarify this situation with a series of balloon flights.
A schematic view of the HEAT-pbar instrument is shown in Fig. 1. It consists of a superconducting magnet with a drift tube hodoscope at its center, combined with stacks of multi-wire proportional chambers above and below the hodoscope. Two layers of scintillators, one at the very top and one at the very bottom of the instrument, provide time-of-flight (ToF) measurements and, together with a scintillator just above the hodoscope, form the event trigger.
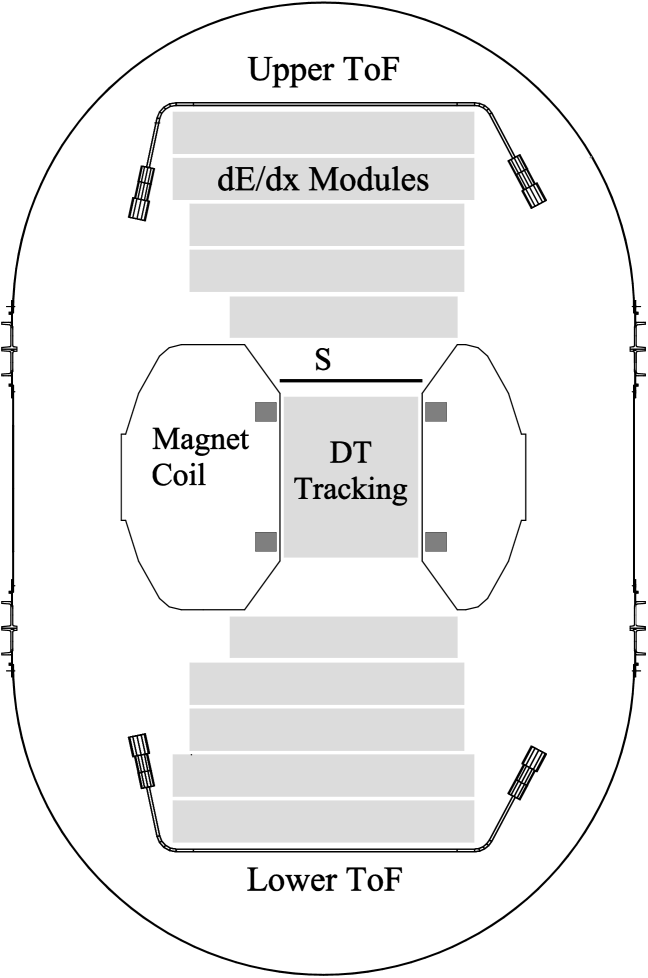
The spectrometer has been described in detail Barwick et al. (1997). It consists of 479 drift tubes in twenty four layers. It is mounted in the room-temperature bore of a superconducting magnet with a 10 kG central field, and measures the particle trajectory within the magnetic field, providing both the particle rigidity (momentum/charge) and charge sign. It has a single-point tracking accuracy of better than 70 m, an average track length of 58 cm, and typically measures 15 points along a particle trajectory. The continuous-tracking approximation then yields a mean Maximum Detectable Rigidity (MDR) of 170 GV, and the rigidities of particles up to 60 GV can be reliably measured.
Antiproton flux measurements require excellent particle identification for background discrimination. The primary sources of background to the flux are electrons, and negatively charged muons, pions and kaons produced in the atmosphere as well as in the material above and in the detector. To provide mass discrimination between antiprotons and these particles we measure multiple samples of the ionization energy loss. The logarithmic rise in the mean rate of energy loss for a relativistic charged particle is used to determine the Lorentz factor of the particle from which, together with the rigidity measurement, the mass is obtained.
The multiple dE/dx detector consists of a stack of 140 segmented multi-wire proportional chambers, each providing a measurement of the specific ionization loss. In order to maximize the particle identification power, the proportional chambers are filled with Xenon (and 5% CH4), which exhibits an increase in ionization loss rate of 70% between minimum ionization and relativistic saturation Labrador et al. (1999).
The HEAT-pbar instrument was flown from Ft. Sumner, NM on June 3, 2000. The detector was at float altitude for 22 hours, at an average atmospheric overburden of 7.2 g/cm2. More than 1.9 million events were recorded over an integrated live time of 16.2 hours at a residual pressure between 4.5 and 8.6 mbar. The average vertical geomagnetic cut-off rigidity along the flight path is 4.2 GV. The instrument performed flawlessly during the flight.
Albedo particles, which mimic antiparticles in the spectrometer, can be efficiently rejected with the ToF measurement. The flux of upward-going relativistic particles is roughly 10-3 that of relativistic downward-going particles, and thus a rejection power of 1000 is required to keep the contamination of these particles below 1% in the final antiproton data set. The standard deviation in the velocity distribution for relativistic protons is 0.093c. This results in a rejection power against upward moving particles which is several orders of magnitude better than required.

In analyzing events recorded by the dE/dx system, first suitable selections on tracking quality are made and events are selected for which the incident particle transits the entire dE/dx chamber system. The effect of high-energy tails in the Landau distribution is minimized by computing, for each event, a restricted average specific ionization which is the average ionization signal measured by 50% of the dE/dx chambers with signals smaller than the median for this event. Note that the precise value of the selected fraction is not very critical, but that 50% is close to optimal. Fig. 2a and b show histograms of the response for negative and positive particles, respectively, having rigidities in the range 4.5–6 GV. In these distributions, the peak at smallest corresponds to protons and antiprotons, the next peak to / and /, and the peak at large to and . Compared to the antiproton flux, the kaon production is small, although not negligible. Our Monte Carlo simulations show that our event selection criteria reduce this contribution to negligible levels, since kaons result from interactions in or near the instrument. A somewhat better mass resolution can be obtained by properly accounting for the dependence of the signal on the rigidity within a given rigidity interval, but these histograms, which are representative of the equivalent histograms at higher energy, demonstrate clearly that particle identification is achieved for both antiprotons and positrons. The large sampling for each energy loss measurement produces highly gaussian distributions, and thus for each energy interval, the ratio can be obtained from fits to the restricted average dE/dx distributions, such as those shown in Fig. 2a and b for the rigidity interval from 4.5 – 6 GV.
The results are summarized in Table 1. In order to obtain the number of protons and antiprotons at the top of the atmosphere, we correct for particle production in the atmosphere (total average column density 7.2 g/cm2) above the instrument. In addition, corrections for interaction and annihilation losses of protons and antiprotons in the atmosphere and in the instrument (maximum column density 5.7 g/cm2 above the lower ToF counter for a vertically traversing particle) are applied. The corrections assume that all particles that interact inside the gondola are rejected by our selection criteria.
The calculated background of secondary antiprotons and protons produced in the atmosphere was based on Pfeifer et al. Pfeifer et al. (1996) for the antiprotons and Papini et al. Papini et al. (1996) for the protons. Interaction and annihilation losses are based on the measured cross sections quoted in Kuzichev et al. Kuzichev et al. (1994) and Denisov et al. Denisov et al. (1973), accounting in detail for the total material traversed by a particle in passing through the atmosphere, aluminum shell, and detector material. The number of antiprotons and protons in each energy bin obtained after applying all of these corrections are shown in Table 1, along with the resulting ratios. The errors quoted in this table are purely statistical. Systematic errors resulting from uncertainties in correcting the particle numbers in the instrument to the top of the atmosphere and in the background due to particle mis-identification are estimated to be less than 4% of the ratio.
| R (GV) | T (GeV) | Np | N | N | N | ratio |
|---|---|---|---|---|---|---|
| 4.5 – 6.0 | 3.7 – 5.1 | 119361 | 18 | 124814 | 13.9 | 1.11 |
| 6.0 – 10.0 | 5.1 – 9.1 | 141447 | 23 | 148952 | 16.9 | 1.13 |
| 10.0 – 15.0 | 9.1 – 14.1 | 60727 | 21 | 64971 | 18.9 | 2.91 |
| 15.0 – 25.0 | 14.1 – 24.1 | 37742 | 15 | 40141 | 12.9 | 3.21 |
| 25.0 – 50.0 | 24.1 – 49.1 | 8773 | 1 | 9090 | 0 |
Our results are shown in Fig. 3, along with previous measurements by others, and a number of recent calculations of the ratio resulting from secondary production of antiprotons in the interstellar medium. Only recent measurements have been included in this figure Orito et al. (2000); Maeno et al. (2000); Mitchell et al. (1996); Hof et al. (1996); Boezio et al. (1994, 2001).
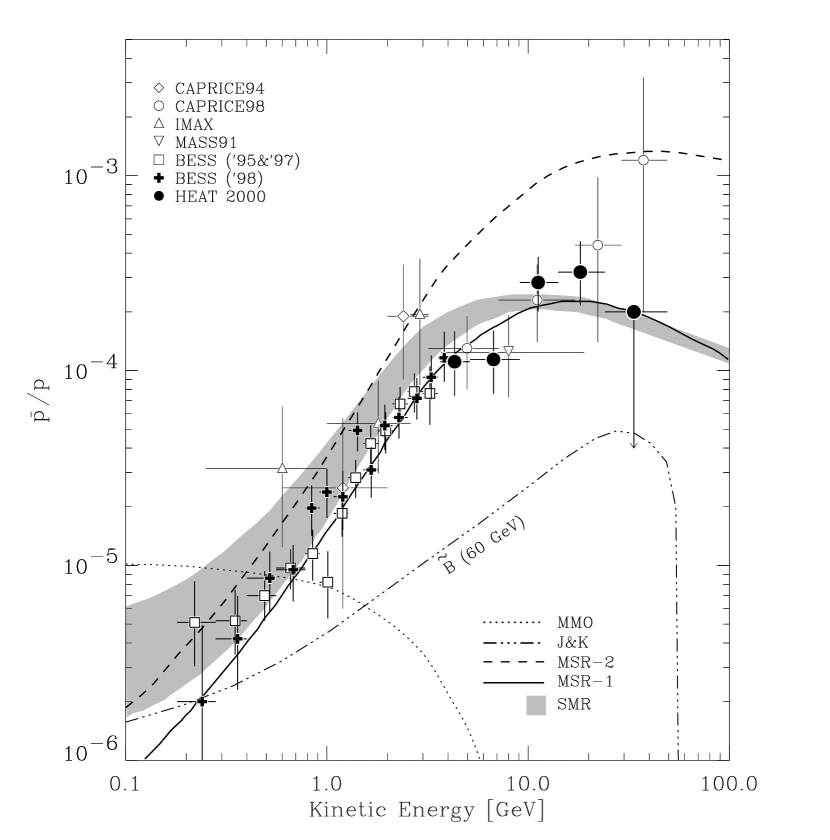
Many predictions for the ratio have been published over the years. We show here theoretical curves that are consistent with the now well measured flux ratio in the low energy region around 1 GeV. The result of calculations by Simon et al. Simon et al. (1998) are shown in the figure as a shaded band. The calculations are based on the leaky box model and the uncertainties in the flux prediction, reflected by the band in the figure, are primarily uncertainties in the galactic path length distribution. The dashed and solid line in Fig 3 show the results of calculations by Moskalenko et al. Moskalenko et al. (1998) within a self-consistent CR propagation model. The dashed line represents the case of a proton injection spectrum that is much harder than locally observed, which has been proposed to explain the observed high continuum gamma-ray emission above 1 GeV Hunter et al. (1997). A standard proton injection spectrum, consistent with the locally observed one, is reflected in the solid line. The sensitivity of the ratio to the nucleon injection spectrum above a few GeV makes antiproton measurements at energies above a few GeV an important test for CR models. Our data are in good agreement with the ‘standard spectrum’ calculations Moskalenko et al. (1998) at high energy, and do not support an antiproton to proton ratio approaching 10-3 at energies above 20 GeV, in contrast to recent CAPRICE measurements Boezio et al. (2001). Our result does not support models which are based on hard nucleon injection spectra. At energies covered by the measurements presented here, secondary production with a nucleon injection spectrum consistent with the locally observed one describes the data well.
The HEAT-pbar instrument is scheduled for additional balloon flights and we expect to statistically improve the data and to further clarify the experimental situation.
Acknowledgements.
This work was supported by NASA grants No. NAG 5-5058, No. NAG 5-5220, No. NAG 5-5223, and No. NAG 5-5230, and by financial assistance from our universities. We wish to thank the National Scientific Balloon Facility and the NSBF launch crews for their excellent support of balloon missions and we acknowledge contributions from D. Kouba, M. Gebhard, S. Ahmed, and P. Allison.References
- Adams et al. (1997) F. Adams et al., Astrophys. J. 491, 6 (1997).
- Peters and Wetergaard (1977) B. Peters and H. Wetergaard, Ap. Sp. Sci. 48, 21 (1977).
- Beatty et al. (1993) J. Beatty et al., Astrophys. J. 413, 268 (1993).
- Reimer et al. (1998) O. Reimer et al., Astrophys. J. 496, 490 (1998).
- Moskalenko et al. (1998) I. Moskalenko, A. Strong, and O. Reimer, A&A 338, L75 (1998).
- Orito et al. (2000) S. Orito et al., Phys. Rev. Lett. 84, 1078 (2000).
- Maeno et al. (2000) T. Maeno et al., astro-ph/0010381 (2000).
- Mitchell et al. (1996) J. Mitchell et al., Phys. Rev. Lett. 76, 3057 (1996).
- Hof et al. (1996) M. Hof et al., Astrophys. J. 467, L33 (1996).
- Boezio et al. (1994) M. Boezio et al., Astrophys. J 487, 415 (1994).
- Boezio et al. (2001) M. Boezio et al., astro-ph/0103513 (2001).
- Barwick et al. (1997) S. Barwick et al., Nucl. Instrum. Methods A400, 34 (1997).
- Labrador et al. (1999) A. Labrador et al., Proc. ICRC, Utah 3, 97 (1999).
- Pfeifer et al. (1996) C. Pfeifer, S. Roesler, and M. Simon, Phys. Rev. C. 54, 882 (1996).
- Papini et al. (1996) P. Papini, C. Grimani, and S. Stephens, Nuovo Cimento 19, 367 (1996).
- Kuzichev et al. (1994) V. Kuzichev, Y. Lepikhin, and V. Smirnitsky, Nucl. Phys. A576, 581 (1994).
- Denisov et al. (1973) S. Denisov et al., Nucl. Phys. B61, 62 (1973).
- Simon et al. (1998) M. Simon, A. Molnar, and S. Roesler, Astrophys. J. 499, 250 (1998).
- Maki et al. (1996) K. Maki, T. Mitsui, and S. Orito, Phys. Rev. Lett. 76, 3474 (1996).
- Jungman and Kamionkowski (1994) G. Jungman and M. Kamionkowski, Phys. Rev. D. 49, 2316 (1994).
- Hunter et al. (1997) S. Hunter et al., Astrophys. J. 481, 205 (1997).